
How to Release Capital Requirements
during a Pandemic?
Evidence from Euro Area Banks
C. Couaillier
1
A. Reghezza
1,2
C. Rodriguez d’Acri
1
A. Scopelliti
3
1
The views presented are those of the authors and should not be attributed
to the European Central Bank or the Eurosystem.
1
European Central Bank;
2
U. Genoa;
3
KU Leuven
Columbia / BPI Conference, 01 March 2023

Credito al settore privato non finanziario
Motivation
▪ Expected functioning of the Basel III macroprudential framework.
• Bank capital buffers built up in economic upturns when vulnerabilities accumulate.
• They can be employed to absorb losses and meet credit demand in downturns.
▪ But some concerns about potential limitations of this framework.
• Are there constraints to the actual usability of capital buffers?
• Is there adequate macroprudential space for buffer releases?
▪ The pandemic as ideal setting to test the functioning of the framework,
due to exogenous nature of shock and different measures of capital relief
▪ Euro area provides attractive setting to study effects of capital relief.
• Institutional setting of macro- and micro-prudential policy
• Data for multiple countries: supervisory, credit register
• Prudential policy measures: reduction of requirement; supervisory flexibility
2

Research Questions and Preview of Results
➢ Setting. Bank capital relief by prudential authorities at onset of pandemic
➢ Analysis. Loan-level study on the effects of capital relief on bank lending
to firms, controlling for credit demand and concurrent policy measures
1. What is the impact of bank capital relief on credit supply?
• Capital relief measures contribute to expand credit supply to firms
2. Does the nature of the capital relief matter for its effectiveness?
• Releases of capital requirements (permanent or temporary) raise lending.
• Supervisory flexibility on capital expectations has no significant impact.
3. Are the effects different across banks?
• Requirement releases more effective for banks with smaller capital headroom
4. Does capital relief promote bank risk-taking towards weaker firms?
• The requirement releases does not promote lending towards insolvent firms
3

Credito al settore privato non finanziario
Outline
➢ Related Literature and Contributions
➢ Capital Relief Measures
➢ Methodology & Data
➢ Empirical Results
➢ Conclusions
4

Credito al settore privato non finanziario
Related Literature and Contribution
1. The effect of changes in capital requirements on bank lending
▪ Capital surcharges and structural buffers [Gropp et al., 2019; De Jonghe et al., 2020; Behn and
Schramm, 2020; Degryse et al. 2022; Cappelletti et al., 2022]
▪ Dynamic requirements [Aiyar et al 2014; Auer et al 2022; Imbierowicz et al 2018; Basten 2019]
▪ Capital requirement releases during Global Financial Crisis [Jimenez et al., 2017]
➢ Analyse the effects of (different) capital releases during a pandemic.
2. Rules vs. discretion in prudential policy
▪ Microprudential regulation and supervision [Walther and White, 2020; Elliott et al., 2013]
▪ Macroprudential policy [Agur and Sharma, 2013; Calem et al., 2020].
➢ Predictability within known frameworks supports policy effectiveness.
3. Basel III framework and bank lending during the pandemic
▪ Capital buffers, internal models and bank lending [Abad and Garcia, 2022; Berrospide et al.,
2021; Couaillier et al., 2022; Mathur et al., 2022; Matyunina and Ongena, 2022; Fiordelisi et al., 2022]
➢ Assess capital requirement releases under the Basel III framework.
5


The Capital Stack for EU Banks
7
Pillar 1
Source: Couaillier et al. (2022)

Capital Relief: Reduction of CET1 Requirements
8
▪ Starting on 12 March 2020, euro area prudential authorities adopted two types
of measures, providing capital relief for overall EUR 140 bn:
1. Reduced binding capital requirements (rule-based action)
Composition change of Pillar 2 Requirement (P2R)
▪ Frontloaded by ECB Banking Supervision in March
2020, while expected to come into force in January 2021
▪ Banks can meet it with AT1 and Tier 2, up to 43.25%
✓ Only banks with excess AT1 and T2 could immediately
benefit from this relief
Decrease the Combined Buffer Requirements (CBR)
▪ Decisions by national macroprudential authorities:
✓ release Countercyclical Capital Buffer (CCyB)
✓ lower Systemic Risk Buffer (SyRB)
MDA Trigger
Pillar 2 Guidance
Combined Buffer
Requirement
Pillar 2 Requirement
Pillar 1

Capital Relief: P2G Usability
Permission to operate below Pillar 2 Guidance (P2G)
▪ Decided by ECB Banking Supervision
▪ While supervisory expectation in place, temporary
waiver on the potential consequences of a breach
9
▪ Starting on 12 March 2020, euro area prudential authorities adopted two types
of measures, providing capital relief for overall EUR 140 bn :
2. Granted flexibility on supervisory guidance (discretionary measure)
Pillar 2 Guidance
Combined Buffer
Requirement
Pillar 2 Requirement
Pillar 1

Empirical Strategy
➢ Econometric identification:
▪ Bank-firm loan-level data to study
the effects of capital relief measures
on banks’ credit supply
▪ Control for demand through firm
fixed effects (Khwaja and Mian, 2008)
▪ Supply controlled for:
• bank characteristics (time-variant
balance sheet variables, bank FEs);
• policy interventions
• TLTRO III and dividend restrictions
at bank level
• credit guarantees and moratoria at
bank-firm level
10
Endogeneity
Credit
Demand
•Exploit
multiplicity
of lending
relationships
Other
policies
• Guarantees
• Moratoria
• Monetary policy
• Dividend restrictions

Credito al settore privato non finanziario
Data
➢ Combine different micro confidential datasets with euro area coverage for
a quarterly sample from 2019 Q3 to 2020 Q4.
▪ Loan-level data from Anacredit
• All bank-firm credit relations with initially more than 25,000€
• Credit contract data: loan volumes, lender, borrower, guarantees, moratoria
• Firm level information: Industry (NACE), Location & Size information
▪ Bank-level supervisory data
• Offer a vast variety of bank characteristics to control for
• Information on capital relief measures and distance to the P2G
• Focus on Significant Institutions due to P2G data availability
▪ Pandemic-related policy measures
• Central bank liquidity measures: TLTRO-III allotment
• Suspension of dividend distribution (decided by ECB Banking Supervision)
11

Empirical Specification
▪ Regression equation:
▪
▪ f is the firm, b is the lender bank, c is the country of the bank, t is the quarter
▪ Dependent variable for credit at the firm-bank level:
• ∆ log of lending stocks
▪ Key regressors expressed as continuous variables:
•
is the size of capital requirement decreases (from P2R & CBR)
•
is the pre-Covid level of the Pillar 2 Guidance
▪ Fixed effects: firm-quarter, country-quarter and bank (or firm-bank)
▪ Errors clustered at the firm-quarter, bank-quarter, firm-bank levels.
▪ Bank controls: bank size, NPL ratio, provisions/tot assets, net interest
margin, cost to income ratio, deposits/tot assets, liquid assets/tot assets,
loans/tot assets, average risk weight, lagged CET1 ratio
12

Table 1. Effects of Different Capital Relief Measures
➢ The reduction in capital requirements increased banks’ credit supply
to firms (as able to affect banks’ dividend policy and capital planning)
➢ The flexibility on supervisory guidance had no significant impact on
banks' lending behaviour
13
(1)
Δ Log (loans)
(2)
Δ Log (loans)
(3)
Δ Log (loans)
(4)
Δ Log (loans)
CAPREL*
PostCOVID
1.247*
(0.665)
1.744**
(0.734)
2.723**
(1.19)
2.773**
(1.169)
P2G*
PostCOVID
-1.046
(0.963)
-0.975
(0.992)
-1.240
(1.081)
-0.358
(0.960)
Obs.
5,480,013 5,480,013 5,480,013 5,480,013
Firm*Quarter FE
YES YES YES YES
Bank country*Quarter FE
NO YES YES YES
Bank FE
NO NO YES NO
Firm
-bank FE NO NO NO YES
Bank controls: log of bank total asset, non-performing loans ratio, provisions-to-total-assets, net interest margin, cost to income ratio, deposits-
to-total assets, liquid-assets-to-total-assets, loans-to-total-assets, average risk weight, lagged CET1 ratio. Policy controls: (at the bank-level)
TLTRO-to-total assets, dividend restrictions; (at the bank-firm level) share of loans under moratoria, share of loans under guarantee schemes,
dividend restriction policy. Capital relief measure s

Effectiveness of Different Relief Measures
➢ The design of the capital relief measure is key for its effectiveness.
What are the main differences?
14
Decrease in Requirements Usability of P2 Guidance
Benefits from
change?
Reduction of binding requirements
→
Reduce MDA trigger (breach
implies automatic restrictions)
Supervisory
expectation still in place
→ Temporary waiver on supervisory
actions (already discretionary)
Replenishment
rules/timeline?
-
P2R permanent
-
CBR temporary but set within
established framework (clear rules
for future rate increase decisions)
-
Temporary usability, on
discretionary
basis
outside scope of the framework
-
Timeline communicated only at the
end of July 2020
Predictability of measures for
replenishment and sanctions
enhance policy effectiveness
Uncertainty on replenishment or
breach consequences may hamper
relief effectiveness

Table 2. Bank Heterogeneity and Capital Headroom
➢ Expansionary effects stronger for banks closer to P2G pre-pandemic
▪ Dist. P2G PreCOVID= CET1 ratio - P2G level (as of 2019 Q4).
▪ The reduction of capital requirements released buffer usability constraints
particularly for banks with smaller capital headroom (Couaillier et al., 2022)
15
(1)
Δ Log (loans)
(2)
Δ Log (loans)
(3)
Δ Log (loans)
(4)
Δ Log (loans)
CAPREL*
PostCOVID 3.33***
(1.05)
3.36***
(1.11)
4.18***
(1.60)
4.32***
(1.51)
P2G*
PostCOVID -1.51
(1.43)
-0.52
(1.50)
-1.89
(1.75)
-0.51
(1.63)
Dist. P2G
PreCOVID
0.08
(0.20)
0.14
(0.20)
-14.09
(39.38)
CAPREL*
PostCOVID* Dist. P2G
PreCOVID
-0.62**
(0.27)
-0.41
(0.28)
-0.70*
(0.39)
-0.72**
(0.34)
Obs.
5,308,638 5,308,638 5,308,638 5,308,638
Firm*Quarter FE
YES YES YES YES
Bank country*Quarter FE
NO YES YES YES
Bank
FE NO NO YES NO
Bank
-firm FE NO NO NO YES
Bank controls: log of bank total asset, non-performing loans ratio, provisions-to-total-assets, net interest margin, cost to income ratio, deposits-to-total
assets, liquid-assets-to-total-assets, loans-to-total-assets, average risk weight, lagged CET1 ratio. Policy controls: (at the bank-level) TLTRO-to-total
assets, dividend restrictions; (at the bank-firm level) share of loans under moratoria, share of loans under guarantee schemes, dividend restriction policy.

Table 3. Firm Heterogeneity and Riskiness
➢ Requirement releases did not promote risk-taking towards insolvent firms
▪ L.IMPAIRMENT=1 if bank b has recognized impairments in credit relationships
with firm f in quarter t-1 (private info available to the lender; Jimenez et al. 2014)
▪ Releases supported a considerably lower lending growth for riskier firms
16
Bank controls: log of bank total asset, non-performing loans ratio, provisions-to-total-assets, net interest margin, cost to income ratio, deposits-to-total
assets, liquid-assets-to-total-assets, loans-to-total-assets, average risk weight, lagged CET1 ratio. Policy controls: (at the bank-level) TLTRO-to-total
assets, dividend restrictions; (at the bank-firm level) share of loans under moratoria, share of loans under guarantee schemes, dividend restriction policy.
(1)
Δ Log (loans)
(2)
Δ Log (loans)
(3)
Δ Log (loans)
(4)
Δ Log (loans)
CAPREL*
PostCOVID 1.291*
(0.6841)
1.842**
(0.7610)
3.169***
(1.220)
3.073***
(1.188)
P2G*
PostCOVID -1.063
(0.9981)
-1.005
(1.031)
-1.620
(1.143)
-0.5618
(1.014)
L.IMPAIRMENT
0.0257***
(0.0050)
0.0247***
(0.0051)
0.0259***
(0.0052)
0.1005***
(0.0077)
CAPREL*
PostCOVID*
L.IMPAIRMENT
-1.773*
(0.9172)
-2.098**
(0.9395)
-2.747***
(0.9075)
0.6275
(0.8477)
Obs.
5,180,712 5,180,712 5,180,712 5,180,712
Firm FE
YES YES YES YES
Bank country*Quarter FE
NO YES YES YES
Bank FE
NO NO YES NO
Bank
-firm FE NO NO NO YES

Robustness Analysis
➢ Definition of the dependent variable
✓ Investigate increase in loan volumes in lending relationships (table)
• Define a binary dependent variable for the increase in credit and estimate
a logit regression
➢ Potential endogeneity of the P2G
✓ P2G set by banking supervisors based on the risk of banks (table)
• Two stage approach:
– Estimate the P2G as function of expected capital depletion from 2018 Stress
Tests under adverse scenario
– Use residuals from the P2G estimation as regressors in the main estimation
➢ Disentangle the decrease of different capital requirements
✓ Estimate separately the effects of the release of P2R and CBR (table)
17

Conclusions
▪ COVID-19 pandemic provides ideal setting to study the functioning of
capital buffer framework and the design of capital releases in crisis times
▪ Capital relief measures support banks’ credit supply to firms, but not
all measures are equally successful.
• Banks adjust their credit supply only if the capital relief is permanent
or implemented within rule-based processes (which foresee long
release periods or define clear rules on replenishment and sanctions)
• Discretionary relief measures show limited success, possibly for the
uncertainty in capital replenishment or as not affecting dividend policy.
▪ The effectiveness of countercyclical capital relief measures in crisis times
depends not only on the relief size, but also on the design of measures.
• Focus on rules setting clear policy reactions.
• Tilting the balance from usable to releasable buffers
18

Thank you!
19

APPENDIX

Countercyclical Capital Buffer Rates
21
Source: ESRB (2022)
Country Jan-19 Jan-20 Jan-21 Jan-22 Jan-23 Jan-24
Austria
0 0 0 0 0 0
Belgium
0 0 0 0 0 0
Croatia
0 0 0 0 0 0.5
Cyprus
0 0 0 0 0 0
Estonia
0 0 0 0 1 1.5
Finland
0 0 0 0 0 0
France
0 0.25 0 0 0 0.5
Germany
0 0 0 0 0 0.75
Greece
0 0 0 0 0 0
Ireland
0 1 0 0 0 1
Italy
0 0 0 0 0 0
Latvia
0 0 0 0 0 0
Lithuania
0.5 1 0 0 0 1
Luxembourg
0 0.25 0.5 0.5 0.5 0.5
Malta
0 0 0 0 0 0
Netherlands
0 0 0 0 0 1
Portugal
0 0 0 0 0 0
Slovakia
1.25 1.5 1 1 1 1.5
Slovenia
0 0 0 0 0 0
Spain
0 0 0 0 0 0
Countercyclical Capital Buffer rate applicable in euro area countries
(2019-2024, as of January, percent of Risk Weighted Assets)
At the beginning of 2020,
among euro area countries:
• 5 had activated a
positive CCyB rate;
• 2 (BE, DE) had
announced a positive
CCyB (under phase-in).
The activation or the
increase of the CCyB rate
requires a 12-month phase-
in implementation period
Capital ratios
before pandemic

Capital Relief Measures
22
Capital relief measures by euro area prudential authorities for
overall EUR 140 bn at the onset of the pandemic
Source: ECB (2020)
Macroprudential adjustments
include the releases of:
- the CCyB buffer: € 13.7 bn
- the SyRB buffer: € 7.5 bn
- the O-SII buffer: € 0.6 bn
Microprudential adjustments include:
- the composition change of P2R: approx. € 30 bn
- the temporary usability of P2G: approx. € 90 bn
Overview of
relief measures

Timeline of Capital Relief Measures
23
Source: ECB (2022)

Credit Developments
24
On aggregate euro area
banks were able to meet
credit demand during the
pandemic.
Growth rate of loans to non-financial corporations
Source: ECB
But the aggregate perspective does not explain the functioning of the
buffer framework nor the effects of capital releases in the lending
behaviour of banks with borrowers
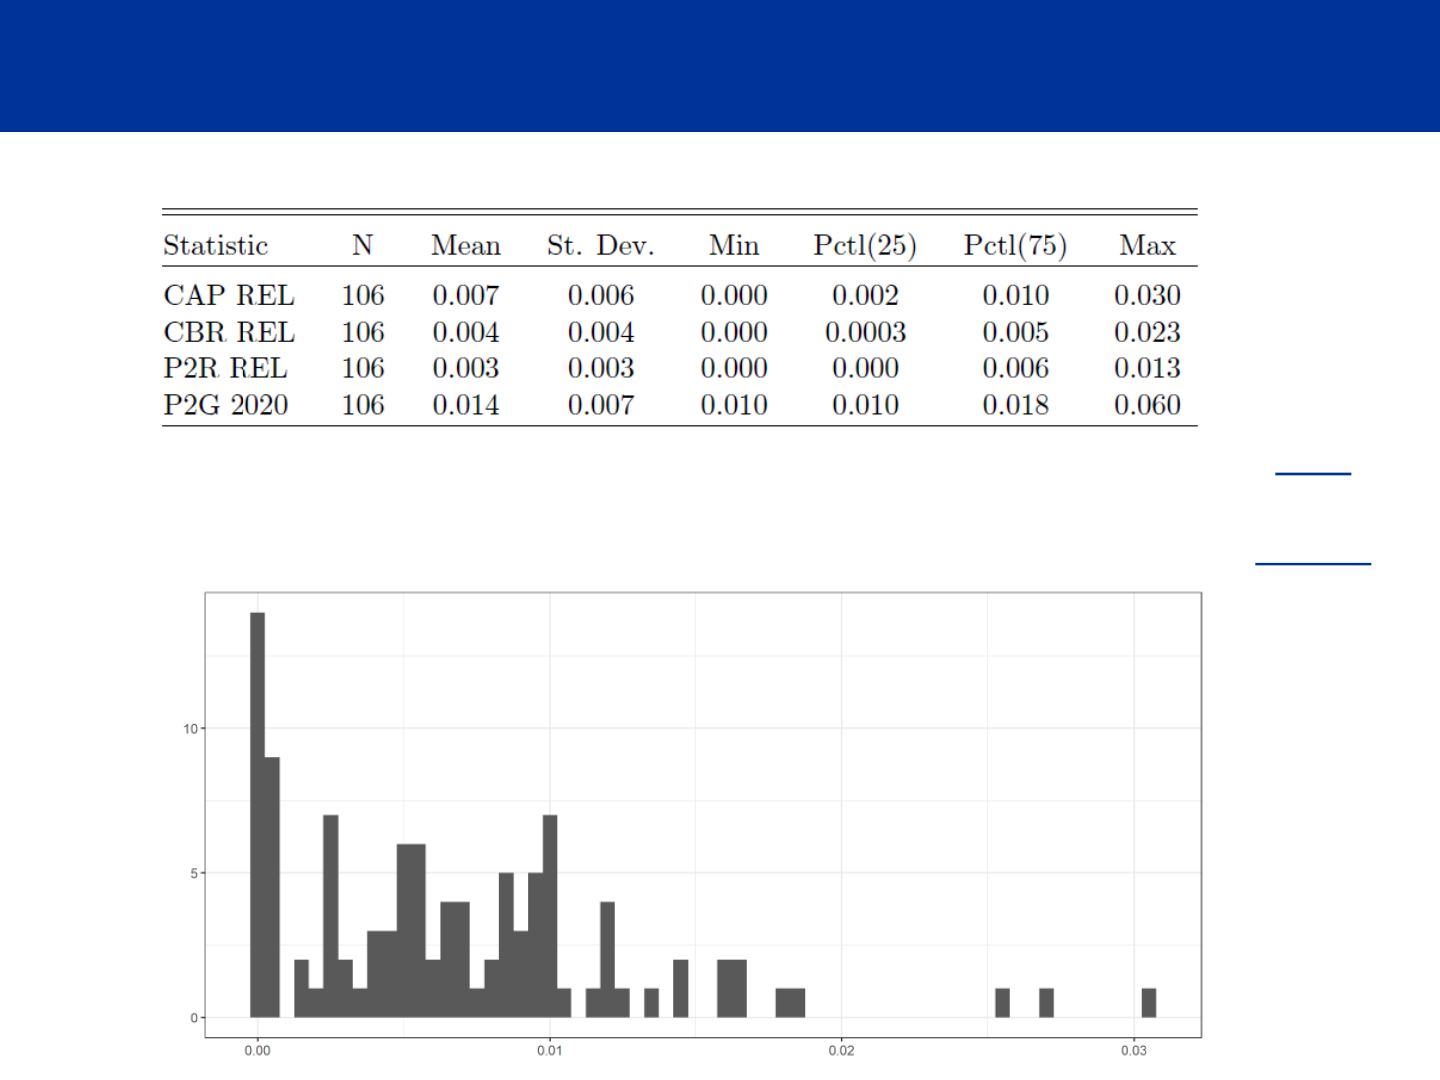

Table A.1. Loan Volumes in Existing Relationships
➢ Definition of the dependent variable
➢ Define a dummy equal to 1 when the credit volume in lending
relationships increased between t-1 and t and run a logit regression
26
(1)
I(Δ credit >0)
CAPREL*
PostCOVID 32.69***
(9.927)
P2G*
PostCOVID -42.34**
(17.11)
Bank Controls
YES
Policy Controls
YES
Obs.
2,216,490
Firm*Quarter FE
YES
Bank controls: log of bank total asset, non-performing loans ratio, provisions-to-
total-assets, net interest margin, cost to income ratio, deposits-to-total assets,
liquid-assets-to-total-assets, loans-to-total-assets, average risk weight, lagged
CET1 ratio. Policy controls : (at the bank-level) TLTRO-to-total assets, dividend
restrictions; (at the bank-firm level) share of loans under moratoria, share of loans
under guarantee schemes, dividend restriction policy.
The expansionary impact of
requirement releases is confirmed also
in supporting the increase of lending
volumes in existing relationships
The possibility to operate below the
P2G did not support credit expansion
Robustness
Table A.2. Robustness Analysis for the P2G
27
▪ Concern: P2G may be endogenous, set by the supervisor based on bank’s
riskiness, which could potentially drive bank’s behavior in crisis times
▪ Solution: use Expected Capital depletion from 2018 Stress Tests under adverse
scenario to calibrate P2G and use residuals as regressors in the main estimation
▪ Two steps:
→ Define
-
▪
(1)
Δ Log (loans)
(2)
Δ Log (loans)
(3)
Δ Log (loans)
(4)
Δ Log (loans)
CAPREL*
PostCOVID 1.933**
(0.8074)
2.564***
(0.9718)
3.093***
(1.181)
2.542**
(1.132)
*PostCOVID
-0.3245
(1.043)
0.0730
(1.211)
-0.4038
(1.404)
-0.4323
(1.383)
Obs.
3,526,437 3,526,437 3,526,437 3,526,437
Firm*time FE
YES YES YES YES
Lender country FE
NO YES YES YES
Bank FE
NO NO YES NO
Bank
-firm FE NO NO NO YES
Bank controls: log of bank total asset, non-performing loans ratio, provisions-to-total-assets, net interest margin, cost to income ratio, deposits-to-total
assets, liquid-assets-to-total-assets, loans-to-total-assets, average risk weight, lagged CET1 ratio. Policy controls: (at the bank-level) TLTRO-to-total
assets, dividend restrictions; (at the bank-firm level) share of loans under moratoria, share of loans under guarantee schemes, dividend restriction policy.
Results confirm:
- expansionary
impact of
requirement
releases
- no significant
effect of P2G
usability
Robustness

Table A.3. Disentangling different capital requirements
28
(1)
Δ Log (loans)
(2)
Δ Log (loans)
(3)
Δ Log (loans)
(4)
Δ Log (loans)
P2R REL*
PostCOVID 2.012**
(0.9094)
1.725*
(0.9376)
2.086*
(1.194)
2.455**
(1.194)
CBR REL*
PostCOVID -0.5674
(1.123)
1.811
(1.671)
9.751***
(3.689)
5.966*
(3.502)
P2G*
PostCOVID -1.208
(0.9735)
-0.9702
(0.9988)
-0.7386
(1.036)
-0.1425
(0.9391)
Obs.
5,480,013 5,480,013 5,480,013 5,480,013
Firm*time FE
YES YES YES YES
Lender country FE
NO YES YES YES
Bank FE
NO NO YES NO
Bank
-firm FE NO NO NO YES
Bank controls: log of bank total asset, non-performing loans ratio, provisions-to-total-assets, net interest margin, cost to
income ratio, deposits-to-total assets, liquid-assets-to-total-assets, loans-to-total-assets, average risk weight, lagged CET1
ratio. Policy controls: (at the bank-level) TLTRO-to-total assets, dividend restrictions; (at the bank-firm level) share of loans
under moratoria, share of loans under guarantee schemes, dividend restriction policy. Standard errors clustered at the bank
and firm levels.
Frontload P2R
composition change:
1.72-2.45% increase in
credit volume
Decrease in Combined
Buffer Requirement:
effect positive but not
always significant
Robustness
