
Iowa’s Tuition and Textbook Tax Credit
Tax Credits Program Evaluation Study
December 2022
By
John Good
Research and Policy Division
Iowa Department of Revenue

1
Preface
Iowa Code Section 2.48 requires certain state agencies, including the Department of
Revenue, to review a schedule of tax expenditures each year and file a report with the
legislature. Each review is required to assess the tax expenditure's equity, simplicity,
competitiveness, public purpose, adequacy, and extent of conformance with the original
purpose of the enacting legislation. A review may also include recommendations for better
aligning a tax expenditure with the original intent of the enacting legislation. The Tuition
and Textbook Tax Credit is scheduled for review in 2022. An evaluation study of the
Tuition and Textbook Tax Credit was completed in 2012 and 2017. This study updates
the information about claims and claimants provided in those earlier studies and provides
economic analysis.
As part of the evaluation, an advisory panel was convened to provide input and advice on
the study’s scope and analysis. We wish to thank the members of the panel:
Kassandra Cline Department of Education
Liesl Eathington Iowa State University
Brent Kreider Iowa State University
Thomas Mayes Department of Education
Shawn Snyder Iowa Association of School Boards
Trish Wilger Iowa Alliance for Choice in Education
This study and other evaluations of Iowa tax credits can be found on the evaluation study
web page on the Iowa Department of Revenue website.
2
Preface ............................................................................................................................ 1
I. Introduction ............................................................................................................... 4
II. Executive Summary .................................................................................................. 4
III. History of the Tuition and Textbook Tax Credit .......................................................... 7
A. Credit Enacted ................................................................................................... 7
B. Legal Challenges ............................................................................................... 7
C. End of Itemized Deduction and Expansion ........................................................ 8
D. Most Recent Changes ........................................................................................ 8
IV. Federal and Other State Programs Comparisons ...................................................... 9
V. Literature Review ...................................................................................................... 11
VI. Analysis of Iowa Tuition and Textbook Tax Credit Claims ....................................... 13
A. Historical Tuition and Textbook Tax Credit Claims (1999 – 2020)......................... 13
B. Tuition and Textbook Tax Credit Claimant Characteristics .................................... 14
C. Tuition and Textbook Tax Credit Claims by School District ................................... 16
D. Tuition and Textbook Tax Credit Impact Analysis ................................................. 17
E. Tuition and Textbook Tax Credit Potential Scenarios ............................................ 18
References .................................................................................................................... 22
Tables and Figures........................................................................................................ 23
Table 1. Expenses Eligible for the Tuition and Textbook Tax Credit.......................... 24
Figure 1. Number of Households Claiming the Tuition and Textbook Tax Credit, Tax
Years 1999 - 2020 ..................................................................................................... 25
Figure 2. Total Tuition and Textbook Tax Credit Claims, Tax Years 1999 – 2020 ..... 26
Figure 3. School Enrollment and Number of Tuition and Textbook Tax Credit Claims
................................................................................................................................... 27
Table 2. Age of Dependents Reported by Tuition and Textbook Tax Credit Claimants,
Tax Year 2020 ........................................................................................................... 28
3
Table 3. Tuition and Textbook Tax Credit Claims by Qualifying Dependents, Tax Year
2020 ........................................................................................................................... 29
Table 4. Share of Households Claiming the Maximum Tuition and Textbook Tax
Credit, Tax Years 2010 - 2020 ................................................................................... 29
Table 5. Tuition and Textbook Tax Credit Claims by Resident Status, Tax Year 2020
................................................................................................................................... 30
Table 6. Tuition and Textbook Tax Credit Claims by Filing Status, Tax Years 2010-
2020 ........................................................................................................................... 31
Table 7. Tuition and Textbook Tax Credit Claims by Adjusted Gross Income, Tax
Years 2010-2020 ....................................................................................................... 32
Figure 6. Average Tuition and Textbook Tax Credit Utilization Rates by School
District, Tax Years 2010-2020 ................................................................................... 33
Figure 7. Average Tuition and Textbook Tax Credit Claims by School District, Tax
Years 2010-2020 ....................................................................................................... 34
Table 8. Top Ten School Districts by Average Total Tuition and Textbook Tax Credit
Claims, Tax Years 2010-2020 ................................................................................... 35
Table 9. Top Ten School Districts by Average Tuition and Textbook Tax Credit Claim,
Tax Years 2010-2020 ................................................................................................ 36
Table 10. Top Ten School Districts by Average Tuition and Textbook Tax Credit
Utilization Rate, Tax Year 2010-2020 ........................................................................ 37
Table 11. Average Impact of the Tuition and Textbook Tax Credit to Claimants, Tax
Years 2013-2018 ....................................................................................................... 38
Table 12. Estimated Distribution of Tuition and Textbook Tax Credit Claimants
Experiencing Decreases and Increases in Total Tax Liability in Tax Year 2023 by
Potential Scenario...................................................................................................... 39
Table 13. Translation of Tax Year Estimated Impact to Fiscal Year Estimated Impacts
Under Potential Scenarios ......................................................................................... 40
4
I. Introduction
The Iowa Tuition and Textbook Tax Credit is available to individual taxpayers who have
one or more dependents receiving private instruction, as defined in Iowa Code section
422.12(1), or attending grades K-12 in an accredited Iowa school. Tuition and Textbook
Tax Credits do not require an award from a government agency. Taxpayers can claim the
credit, when eligible, on their individual income tax return. Tuition and Textbook Tax
Credits may not be sold, traded or otherwise transferred to a second party. For Tuition
and Textbook Tax Credits claimed by married taxpayers who file separately on a
combined return, the Tuition and Textbook Tax Credit must be claimed by the spouse
who claims the dependent on the return. Tuition and Textbook Tax Credits are
nonrefundable and unused credits may not be carried forward. This is the third evaluation
study completed on the Tuition and Textbook Tax Credit.
II. Executive Summary
A. Iowa and Other State Tuition and Textbook Benefit Programs
• For the period of this study, the Tuition and Textbook Tax Credit has been a
nonrefundable credit of 25 percent of the first $1,000 of eligible expenses for a
maximum $250 credit per eligible dependent. The definition of “textbooks and
tuition” includes non-public school tuition, books, materials, and equipment for
extracurricular activities.
• Iowa is not exclusive in providing tax incentives for educational expenses incurred
prior to higher education. Eight other states offer some form of either a tax credit
or deduction.
• A School Tuition Organization Tax Credit is available in Iowa, equal to 75.0 percent
of the amount of a voluntary cash or noncash contribution made by a taxpayer to
a School Tuition Organization (STO).
B. Historical Tuition and Textbook Tax Credit Claims (1999 – 2020)
• During the 2020-21 school year, a total of 516,848 students attended accredited
public and private elementary and secondary schools in Iowa.
• Public school enrollment decreased by an average of 0.5 percent per year from
1999 through 2010 before increasing by an average of 0.4 percent from 2010
through 2019 before decreasing 1.2 percent in 2020 associated with the pandemic.
• Since 2016, the count of claims has consistently decreased from nearly 118,000
to just over 104,500 in TY 2020. Likewise, the amount of credit awarded steadily
decreased from approximately $15.5 million in TY 2015 to $14.0 million in TY 2020.
5
C. Characteristics of Tuition and Textbook Tax Credit Claimants
• For tax year 2020, the most recent complete tax year, 118,348 households claimed
a total of $15.5 million in TTC. The average TTC claim in 2020 was $134 per
household.
• The largest number of households (39,181) claiming TTC reported two qualifying
dependents. These households accounted for the largest share of dependents for
which credits were claimed, at 41.9 percent, and the largest dollar share of credits
claimed, at 36.0 percent.
• In tax year 2020, 10,453 households, or 10.0 percent of all claimants claimed the
maximum credit of $250 for each qualifying dependent. Households receiving
maximum credits had 18,566 dependents, or 9.9 percent of all dependents. Since
2010, when the share of households claiming the max credit was 7.2 percent, the
share of households claiming the maximum credit per dependent has increased
nearly each year, to 10.0 percent in 2020.
• On average, in tax years 2010-2020, married households filing separately on a
combined return made up the largest share of the number of TTC claims (67.2
percent), followed by head of household (18.5 percent), married joint (11.9
percent) and single filers (1.5 percent).
D. Tuition and Textbook Tax Credit Claims by School District
• Across the state, 34.8 percent of taxpayers identified with qualifying dependents
claimed a Tuition and Textbook Tax Credit in tax years 2010-2020.
• Comparing utilization rates across the school districts in existence for the 2020-
2021 school year reveals significant variation. The utilization rate ranges from 8.4
percent in the Corning School District to 57.4 percent in the Pella School District.
Over one-half of households with qualifying dependents claimed the credit in 11
school districts while less than one-fifth made claims in 15 school districts.
• Average TTC claims from TY 2010-TY 2020 among school districts ranged from
$1,089 in the Hamburg School District to $884,874 in the Des Moines School
District. In tax years 2010-2020, the Des Moines, Cedar Rapids, and Davenport
school districts were the three largest school districts in the state based on the
number of eligible households. These three districts ranked as the top three
districts in terms of TTC claims and comprised three of the top districts in terms
of count of claims.
• Pella School District had the highest utilization rate in the state with 57.4 percent
of households with qualifying dependents making TTC claims. All of the top ten
school districts by utilization had utilization rates over 50 percent.
6
D. Tuition and Textbook Tax Credit Analysis
• The impact of the TTC to individual’s income tax liability varied depending upon
the adjusted gross income (AGI) group to which they belong. While results do
conclude that as an individual’s AGI increases, both their TTC claim amount
increases and their differential in total tax liability, their percent change in tax
liability does not.
• Five different policy scenarios are examined for changes in tax liability under
different permutations of the TTC.
o Under the first scenario (increase the credit rate from 25 percent of first
$2,000 of qualified expenses to 50 percent of first $2,000 of qualified
expenses). It is estimated that 88.8 percent of taxpayers will see no
change to their taxes. The estimated average tax liability decrease per
TTC claimant in TY 2023 is $206 but the average decrease is estimated to
rise with income from about $50 at the lowest income level up to $470 for
individuals with an AGI above $1.0 million.
o Under the second scenario (increase the credit rate from 25 percent of
first $2,000 of qualified expenses to 100 percent of first $2,000 of qualified
expenses). It is estimated that 88.9 percent of taxpayers will see no
change to their taxes. The estimated average tax liability decrease per
TTC claimant in TY 2023 is $551, but the average decrease is estimated
to rise with income from about $85 at the lowest income level up to $1,412
for individuals with an AGI above $1.0 million.
o Under the third scenario (increase the credit rate from 25 percent of first
$2,000 of qualified expenses to 25 percent of the first $4,000 of qualified
expenses). It is estimated that 98.8 percent of taxpayers will see no
change to their taxes. The estimated average tax liability decrease per
TTC claimant in TY 2023 is about $639, but the average decrease is
estimated to rise with income from about $133 at the lowest income level
up to $977 for individuals with an AGI above $1.0 million.
o Under the fourth scenario (revise the credit from a nonrefundable 25
percent of first $2,000 of qualified expenses to a refundable 25 percent of
the first $2,000 of qualified expenses). It is estimated that 91.0 percent of
TTC claimant will see no change to their taxes. $287, but the average
decrease is estimated to vary with income from about $265 at the lowest
income level up to $573 for individuals with an AGI between $500,000 to
$1.0 million.
o Under the fifth scenario (elimination of the TTC from the Iowa Tax Code).
It is estimated that 88.2 percent of taxpayers will see no change to their
7
taxes. The estimated average tax liability increase per TTC claimant in TY
2023 is about $223, but the average increase is estimated to increase with
income from about $94 at the lowest income level up to $470 for
individuals with an AGI above $1.0 million.
III. History of the Tuition and Textbook Tax Credit
A. Credit Enacted
Beginning in 1987, taxpayers who itemized deductions on their State income tax returns
could deduct up to $1,000 in eligible education expenses per dependent, while taxpayers
who took the standard deduction could claim a nonrefundable tax credit equal to five
percent of the first $1,000 in eligible expenses per dependent. Expenses must be incurred
for dependents attending kindergarten through 12th grade at an Iowa school, accredited
under Iowa Code section 256.11, not operated for profit, and adhering to the provisions
of the U.S. Civil Rights Act of 1964.1 Taxpayers with federal adjusted gross income of
$45,000 or more could not claim either the itemized deduction or the tax credit. Married
couples were required to combine their incomes in considering the $45,000 limitation,
even if filing separately. In the case of divorced parents, only the spouse claiming the
dependent credit could claim expenses for that dependent. Eligible education expenses
included tuition and fees; however, expenses for extracurricular activities were not
originally eligible for the deduction or the tax credit.
B. Legal Challenges
In 1992, Iowa’s Tuition and Textbook Tax Credit program faced a legal challenge over
whether the credit was constitutional. In the case of Luthens v. Bair, the plaintiffs argued
that the credit program favored religious schools over public schools and discriminated
against parents of children attending non-accredited schools. They further argued that
the credit program allowed for government entanglement with religion because the law
excludes expenses relating to “the teaching of religious tenets, doctrines or worship”; their
argument was that IDR would have to monitor and inspect school activities to ensure that
the law was not violated.
The District Court found that the credit did not favor one type of school over another as
the credit was available to all parents incurring education expenses regardless of whether
their children attended public, private sectarian, or private non-sectarian schools. Also,
the benefits of the credit were viewed as being distributed to the parents themselves and
not to the schools. In addition, the court ruled that the credit program did not violate the
rights of parents as the credit provision encouraged students to attend accredited schools
that meet state education requirements, which is a valid government interest. Finally, the
court ruled that provisions in the Iowa Administrative Rules provided for a proration of the
credit based on time spent in religious classes versus time spent in all classes, and no
8
monitoring by IDR was necessary. Therefore, Iowa’s TTC was upheld by the District
Court.
C. End of Itemized Deduction and Expansion
In 1996, the itemized deduction option was discontinued and the Tuition and Textbook
Tax Credit was made available to all taxpayers with eligible expenses. The tax credit
percentage was increased from five percent to ten percent of the first $1,000 of eligible
expenses per dependent and the $45,000 income restriction was eliminated.
Soon after the 1996 legislation became law, the Iowa Catholic Conference initiated a
campaign to expand the tax credit even further. The Catholic Conference’s proposal was
to increase the maximum credit from $100 per dependent (10 percent of the first $1,000
of eligible expenditures) to $500 per dependent in grades kindergarten through 8 and
$1,000 per dependent enrolled in high school. Their proposal would also have made the
credit refundable.
The proposal to change the TTC advanced through the 1997 Iowa Legislature. However,
concerns about the bill’s cost resulted in the bill being held over into the 1998 legislative
session.
In 1998, legislation was passed and signed into law which increased the tax credit
percentage from ten percent to 25 percent of the first $1,000 of eligible expenses. The
definition of “textbooks and tuition” was expanded to include books and materials for
extracurricular activities. However, the tax credit remained nonrefundable, meaning it can
only be used to offset current tax year liability, and there is no carry-forward provision.
D. Most Recent Changes
In 2021, the credit was increased to 25 percent of the first $2,000 of expenditures per
dependent, and was further modified to allow expenditures related to dependents
receiving private instruction. The 2021 modifications are not reflected in this study as the
reportable data is as yet unavailable.
Eligible expenses include costs for personnel, buildings, equipment, textbooks, and other
expenses for subjects legally and commonly taught in Iowa’s public elementary and
secondary schools as well as books and materials for extracurricular activities, such as
sporting events, music, drama or speech events, driver’s education, or programs of a
similar nature. Expenses relating to the teaching of religious doctrines, tenets, or worship,
are not eligible, nor are expenses related to home schooling, tutoring, or schooling outside
of an accredited school eligible for the credit.
9
IV. Federal and Other State Programs Comparisons
Iowa is not exclusive in providing tax incentives for educational expenses incurred prior
to higher education. Eight other states offer some form of either a tax credit or deduction.
Alabama offers a refundable tax credit to taxpayers who transfer their children enrolled in
or assigned to a failing public school to a non-failing public or private school. Alabama
defines a public school as failing if it meets one or more of the following requirements:
The school is labeled as persistently low-performing by the Alabama State Department
of Education; the school is designated as a failing school by the state Superintendent of
Education; the school does not exclusively serve a special population of students; or the
school has been listed three or more times during the most recent six years in the lowest
6 percent of public K–12 schools on the state standardized assessment in reading and
math. Taxpayers can claim a tax credit worth the lesser of either 80 percent of the average
annual state cost of attendance for a K–12 public school student during the applicable tax
year, or their children’s actual cost of attending school. If the taxpayer’s liability is less
than the total credit allowed, they may receive a rebate equal to the amount of the unused
credit. Taxpayers who transfer their children from failing public schools to non-failing
public or accredited private schools are eligible, as-well-as taxpayers with children who
are starting school for the first time and zoned to attend a failing public school.
Illinois allows individuals to claim a tax credit for educational expenses for dependent
students attending a public, private or home school. Taxpayers can claim a tax credit
worth 25 percent of their K–12 education expenditures after the first $250 spent, up to a
maximum credit of $750 per household. To qualify for the maximum credit of $750,
taxpayers must meet the expenditure limit of $3,250 on educational expenses.
Educational expenses must be for students who are residents of Illinois, who are younger
than 21 and attend K-12 in a public, private or home school in Illinois. Qualified expenses
include tuition, books and lab or activity fees. Beginning in 2018, Illinois imposed an
income limit for the tax credit. Married families with an AGI exceeding $500,000, as well
as non-married families with an AGI of $250,000, are no longer eligible for the credit.
Indiana’s Private School/Homeschool Deduction program is a tax deduction for
individuals who make educational expenditures for private schools or home schooling on
behalf of their dependent children. The tax deduction is worth up to $1,000 per child.
Households can utilize tax deductions for multiple children. Deductions are available for
taxpayers’ expenditures on either private schools or homeschooling for their dependent
children, including tuition, textbooks, fees, software, tutoring and supplies.
Louisiana Elementary and Secondary School Tuition Deduction is open to any taxpayer
who has private schooling expenses, including private school tuition and fees, uniforms,
textbooks, curricular materials, lab schools, and any supplies required by the school. The
10
deductions are worth 100 percent of the total amount spent on tuition, fees and other
eligible expenses at private schools. Taxpayers may deduct up to $5,000 per child.
Deductions are worth 100 percent of the total amount spent on tuition, fees and other
eligible expenses at private schools. All K–12 Louisiana private school students are
eligible. Any taxpayer that has private school educational expenses may claim the
deduction.
Minnesota has two tax incentive programs for education expenses. First, Minnesota
provides a tax deduction covering educational expenses for students in any public, private
or home school, including in North Dakota, South Dakota, Iowa or Wisconsin. Eligible
expenses reduce a family’s taxable income when taxes are filed. The tax deduction is
worth 100 percent of the amount spent on education, up to $1,625 per child in grades K–
6 and $2,500 per child in grades 7–12. The tax deduction lowers a family’s taxable income
and covers books, tutors, academic after-school programs and other educational
expenses, including tuition payments at private schools.
Minnesota’s second tax incentive program provides a tax credit covering educational
expenses including tutoring, educational after-school programs and books for students in
any public, private or home school, including in North Dakota, South Dakota, Iowa, or
Wisconsin. The tax credit is worth 75 percent of the amount spent on educational
expenses other than tuition. The maximum credit amount that a family may claim is equal
to $1,000 per child in the family. The tax credit reduces the family’s total tax liability and
covers books, tutors, academic after-school programs and other non-tuition educational
expenses.
The refundable tax credit is phased out for taxpayers who earn more than $33,500. For
families with one child, the maximum allowable credit is reduced by $1 for every $4 of
income above $33,500, and the family may not claim the credit at all if its income is above
$37,500. For families with two children, the maximum allowable credit is reduced by $2
for every $4 of income above $33,500, and, again, the family may not claim the credit if
its income is above $37,500. For families with more than two children, the phase-out is
still $2 for every $4 of income above $33,500, but the $37,500 income ceiling is raised by
$2,000 for each child after the first two. For example, a family with four children may not
claim the credit if its income is more than $41,500.
Ohio also has two tax incentive programs for education expenses. First, Ohio provides a
tax credit of up to $250 for qualifying home education expenses, including books,
supplementary materials, supplies, computer software, applications or subscriptions.
Ohio provides a nonrefundable tax credit of up to $250 for qualifying home education
expenses, including books, supplementary materials, supplies, computer software,
applications or subscriptions. All Ohio students who are excused from the state’s
11
compulsory attendance law for the purpose of home instruction are eligible to receive the
tax credit.
The second tax incentive that Ohio provides is a tax credit of up to $500 or $1,000,
depending on household income, for tuition paid for one or more dependents to attend a
non-chartered private school. Families are eligible if their total annual household income
is less than $100,000. Ohio provides a tax credit of up to $500 for families with a total
annual household income of less than $50,000 for tuition paid for one or more dependents
to attend a non-chartered private school. For families with a total annual household
income that is between $50,000 and $100,000, the tax credit is worth up to $1,000.
Families are eligible to receive the tax credit if at least one of their dependents is enrolled
in a non-chartered private school and their total annual household income is less than
$100,000.
The South Carolina Refundable Educational Credit for Exceptional Needs Children is a
refundable tax credit program, for what they paid out of pocket for private school tuition.
Parents or guardians receive a tax credit worth the lesser of $11,000 per student or their
children’s actual cost of attending school. However, if the student receives an Educational
Credit for Exceptional Needs Children Fund scholarship, then the credit claimed may
equal only the difference of $11,000 or the cost of tuition, whichever is lower, and the
amount of the tax credit-funded scholarship. The total cap on the program is $2 million.
Wisconsin provides an income tax deduction for individuals who pay private school tuition
for their dependent children. It has no income limit, and taxpaying families can apply for
an individual tax deduction after paying for K–12 private school tuition. The tax deduction
is worth up to $4,000 per child in grades K–8 and up to $10,000 per child in grades 9–12.
The deduction may not be applied for tuition paid for by a voucher or a college savings
account, nor may it be used for fees, transportation or room and board. Any Wisconsin
taxpayer enrolling their children in an approved private school is eligible. Approved private
schools must provide at least 875 hours of instruction per year in a sequentially
progressive curriculum including reading, language arts, math, social studies, science
and health.
V. Literature Review
The Iowa Tuition and Textbook Tax Credit is not confined to just tuition and textbook
expenses but also to resources that a student would require for extracurricular activities
such as sports, music, the arts, and debate. This evaluation study finds that approximately
90 percent of Iowa Tuition and Textbook Tax Credit claimants are utilizing this credit for
school supplies and possibly extracurricular activity equipment. Therefore, this literature
review is going to focus on the availability, benefits, and affordability of extracurricular
activities in the United States.
12
It is the policy of the Iowa Department of Education that no Iowa student enrolled in a
public school be excluded from participation in or denied the benefits of course offerings
and related activities due to the student’s or the student’s parent’s or guardian’s financial
inability to pay a fee associated with the class, program, or activity. There are no expressly
authorized fees related to extracurricular activities and therefore charging fees to
participate is prohibited in the State of Iowa.
There are numerous reports on the benefits of participation in extracurricular activities by
students. As public and non-public school systems in the US come under greater
pressure regarding their budgets and commitment to academic success, the necessity of
extracurricular activities in schools has been called into question (Israel, 2013; Vukic &
Zrilic, 2016). When a school district is faced with limited resources such as instructional
time, finances, and staff, school administrators must decide whether extracurricular
activities are a worthwhile investment (Israel, 2013; Vukic & Zrilic, 2016).
According to a study by Morse, Anderson, Christenson, and Lehr (2004), student
engagement is defined as the participation in school activities and the student’s
identification with school while accepting school values. They further define student’s
identification as obtaining a sense of belonging and safety security at school, maintaining
social commitments, and creating comfortable relationships with teachers to the extent
which the student values school success. School-related extracurricular activities such as
sports, music programs, and community service projects foster environments where
students are able to formulate strong identifications with school (Miller, 2016). As stated
before, a strong identification with school reduces school dropout rates and increases
school engagement characteristics for at risk adolescent students (Miller, 2016).
Some studies suggested the impacts that extracurricular activities have on at-risk
students are positive (Miller, 2016), and other studies suggested they were negative
(Miller, 2016). Research finds that parental involvement, socio-economic status, and
motivations are key factors in the success of children’s academic performances.
However, there are studies concluded extracurricular activities have the most influential
impact on attitudes towards school and academic achievement amongst at-risk students
(Miller, 2016). Research shows that household income is a significant predictor of whether
a child participates in an extracurricular activity. However, as mentioned earlier in this
literature review, Iowa cannot exclude students from participation in extracurricular
activities based upon financial needs.
Charging students to play makes it easier for the schools to offer the activity because they
are receiving an income. However, making students pay will decline the participation rate,
especially for the children who can’t afford it. Paying to play prevents a lot of students in
poverty from being able to participate (Hoff & Mitchell, 2006). There are many factors that
13
limit participation in extracurricular activities, but one key factor is the costs. Costs for
activities vary and are used for uniforms, equipment, coaches, referees, and locations to
play. It is especially difficult for low-income families to meet these needs. Activity fees that
exceed $300 causes the participation rate in school activities to drop by a third or more
(Burkhardt, 2016).
According to a survey by the University of Michigan C. S. Mott Children’s Hospital (2012),
61 percent of middle and high school students in the US were charged a pay-to-play fee.
According to survey results, the average fee was $93. It was found that 21 percent of
parents were charged a participation fee of $150 or more. According to a report by
Snellman, Silva, and Putnam (2015), these numbers do not include the cost of equipment,
uniforms, and additional fees like travel, which raise the average cost to $381. These
survey results are not reflective of Iowa’s statute against pay-to-play policies.
The fees identified in the Michigan survey disproportionately hinder children from families
who earn less than $60,000 per year, as 19 percent of these households reported that
their children’s participation dropped because of the cost (Snellman, Silva, and Putnam,
2015). On the other end of the spectrum, among households earning more than $60,000
per year, only 5 percent reported lower participation due to increased costs (Snellman,
Silva, and Putnam, 2015).
There are many negative effects for children living in poverty and joining extra activities
is one of them. Parents who work are more likely to allow their child to participate in
activities rather than a family who only has one or no parent working (Barnett, 2008).
Families living in poverty cannot afford the extra costs for extra activities, and as a result,
it can have negative effects on the child’s health. Extracurricular activities help to promote
physical, mental, emotional, and social wellness. Children that live in poverty miss out on
the health benefits because they cannot afford to participate. Extracurricular activities
have many great benefits and unfortunately research has shown that families living in
poverty are less likely to provide these opportunities to their children (Burkhardt, 2016).
VI. Analysis of Iowa Tuition and Textbook Tax Credit Claims
A. Historical Tuition and Textbook Tax Credit Claims (1999 – 2020)
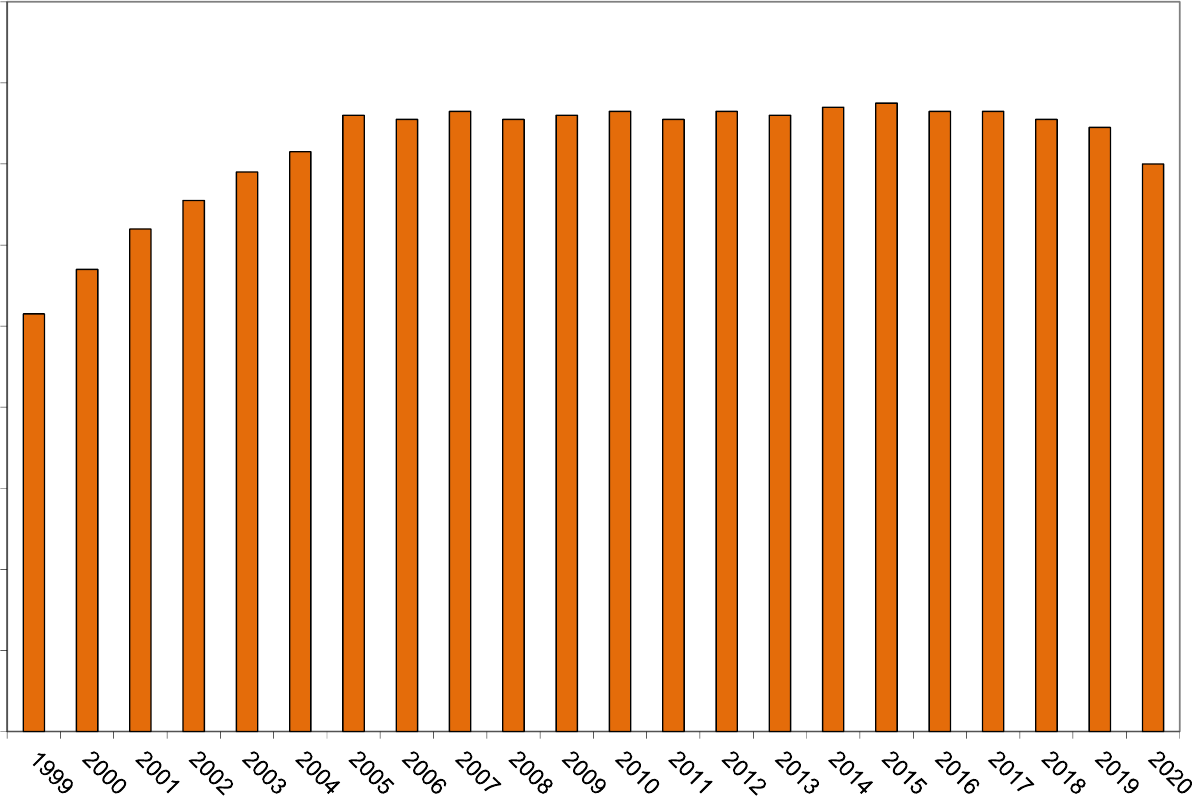
Historical data show large increases in both the number of TTC claimed and the amount
of credits claimed from 1999 through 2007 (see Figures 1 and 2). An observable
plateauing with slight variation occurs from 2007 through 2015 in both the number of TTC
claimed and the amount of credits claimed. Since 2015, there has been an observable
decrease in number of TTC claims and amount of credits.

14
The number of TTC claims increased from 76,000 in 1999 to a high of 121,000 from 2009
through 2012 and the aggregate TTC claim amount increased from $10.3 million in 1999
to a high of $15.5 million in 2015. Since 2012, the number of claims has decreased each
year to 105,000 in 2020. The amount of credits has also decreased each year since 2015
to $14.0 million in 2020. During the 2020-21 school year, a total of 516,848 students
attended accredited public and non-public elementary and secondary schools in Iowa.
Public school enrollment decreased by an average of 0.5 percent per year from 1999
through 2010 before increasing by an average of 0.4 percent from 2010 through 2019
before decreasing 1.2 percent in 2020. This decrease in 2020-21 may be attributed to
parents choosing to pull their kids out of school due to the COVID Pandemic (see Figure
3). School enrollment trends reflect the school-age population dropping from 1999
through 2010 before increasing each year since. In contrast, non-public school enrollment
has declined from 42,800 students in 1998 to a low of 32,700 in 2020, or -23.6 percent.
Non-public school enrollment declined in 16 of 22 years from 1999 through 2020, for an
average annual decline of 1.2 percent.
The pattern of TTC claims does not follow either public or non-public school enrollment
patterns (see Figure 3). After moving to its most recent pre-2021 structure in 1998, a 25
percent nonrefundable tax credit with no income limit, taxpayer awareness drove the rise
in claims over the next nine years. After that point, the plateauing suggests widespread
knowledge and usage; later analysis will question that suggestion. However, in tax years
2014 and 2015, the counts of claims dipped below 120,000 while the value of claims
continued to rise (Figures 1 and 2). Since 2016 the count of claims has consistently
decreased from nearly 118,000 to just over 104,500 in TY 2020 (Figure 1). Likewise, the
amount of credit awarded steadily decreased from approximately $15.5 million in TY 2015
to $14.0 million in TY 2020 (Figure 2).
B. Tuition and Textbook Tax Credit Claimant Characteristics
For tax year 2020, the most recent complete tax year, 104,609 households claimed a total
of $14.0 million in TTC. Although taxpayers report the total number of dependents in the
household (209,722), taxpayers do not indicate on the return the number of dependents
with expenses for which Tuition and Textbook Tax Credits are being claimed. Dependents
claimed on the Iowa individual income tax return can be of all ages while the TTC is limited
to eligible expenses incurred for dependents in kindergarten through 12th grade. To
determine the number of dependents in grades K-12, Iowa income tax returns were
matched with federal tax return information containing the birth dates of up to four
dependents. Of the total number of dependents claimed on returns with a TTC claim,
187,110 dependents (89.2 percent) were identified as elementary and secondary school
age, 5 to 21, referred to as qualifying dependents (see Table 2).
1
No federal age data
could be matched to 3,575 dependents, in many cases because the household had more
than four dependents. It was assumed that any dependents in a household beyond four
and dependents with no age data matches were between ages 5 to 21. Under these
assumptions, 187,110 dependents are considered qualifying.
1
Disabled children can attend secondary school through age 21.

15
The largest number of households (39,181) claiming TTC reported two qualifying
dependents (see Table 3). These households accounted for the largest share of
dependents for which credits were claimed, at 41.9 percent, and the largest dollar share
of credits claimed, at 36.0 percent. Households with three dependents were the second
largest group with 26.0 percent of dependents and 23.2 percent of credits claimed.
Households with only one dependent accounted for 20.0 percent of the dependents for
which credits were claimed, and 21.6 percent of TTC claims. Not surprisingly, as the
number of qualifying dependents increases, the average claim per household increases.
Overall, the average household TTC claim was $134. The average claim per dependent
is highest for households with four or more dependents with an overall average claim per
dependent of $120.
Although the taxpayer is not required to report on the tax return the expenses for which
the credit was claimed or the school attended by each dependent, the size of the claim
may suggest claimants whose children attend non-public school. In tax year 2020, 10,453
households, or 10.0 percent of all claimants claimed the maximum credit of $250 for each
qualifying dependent (see Table 4). Because these taxpayers are claiming $1,000 in
eligible expenses for each dependent, it may be the case that they are paying tuition to a
non-public school.
2
The estimated 10.0 percent share is higher than the 6.4 percent share
of all Iowa students who attended non-public schools during the 2020-2021 school year
(Iowa Department of Education). Households receiving maximum credits had 18,566
dependents, or 9.9 percent of all dependents. Since 2010, when the share of households
claiming the max credit was 7.2 percent, the share of households claiming the maximum
credit per dependent has increased nearly each year, to 10.0 percent in 2020.
Given that only dependents attending an accredited Iowa school are qualifying, it is
expected that the tax credit is mainly claimed by Iowa residents. Based on the Iowa county
of residence reported on the tax return, 103,709 resident households claimed $13.8
million (98.8%) in credits (see Table 5). Nonresidents can claim the Tuition and Textbook
Tax Credit as long as their children are attending an accredited school in Iowa. There
were 896 nonresident households who claimed a total of $172,004 in TTC in tax year
2020. The nonresident claims with mailing addresses in neighboring states are broken
down as follows: Illinois (85), Minnesota (56), Missouri (39), Nebraska (162), South
Dakota (110), and Wisconsin (49). The other 395 nonresident returns had addresses from
states not contiguous to Iowa; these could reflect taxpayers who lived in Iowa at some
point during the year but had moved out of the state by December 31, 2020.
On average, in tax years 2010-2020, married households filing separately on a combined
return made up the largest share of the number of TTC claims (67.2 percent), followed by
head of household (18.5 percent), married joint (11.9 percent) and single filers (1.5
percent) (see Table 6). Married separate filers filing on separate returns and qualifying
widow(er)s made up less than one percent of all claimants (0.9 percent and 0.1 percent).
As expected, when considering the amount of TTC claimed, married taxpayers filing
2
The average non-public school tuition in Iowa is $5,359 per year in 2022.
16
separately on combined returns also had the largest share of dollar claims (70.5 percent)
(see Table 6). However, married joint filers had the second largest share of credit claims
(15.5 percent), followed by head of household filers (12.4 percent) and single filers (0.9
percent). Married separate filers filing on separate returns and qualifying widow(er)s
accounted for less than one percent of dollars claimed (0.6 percent and 0.1 percent).
Iowa taxpayers claiming the TTC are concentrated in middle- and upper-income levels,
with households reporting less than $20,000 in adjusted gross income (AGI) comprising
only 1.0 percent of TTC households and 0.7 percent of the dollars being claimed (see
Table 7). Low-income taxpayers are exempt from public school fees, reducing qualifying
expenses. These taxpayers also have less tax liability against which to claim the
nonrefundable tax credit. Claimants with AGI between $20,000 and $49,999 comprised
21.6 percent of the total number of claims and 15.6 percent of the total dollars claimed.
Households with AGI between $50,000 and $149,999 comprised 63.8 percent of the total
number of claims and 62.7 percent of the total amount claimed. The average TTC claim
rises from $76 to $230 as income rises. Because the average TTC claim rises as AGI
rises, the shares of dollars claimed exceed the shares of claimants at the higher income
levels (above $90,000). Households with income above $150,000 reported 13.7 percent
of the number of claims and 21.1 percent of the total amount of TTC claimed. As income
rises, taxpayers are able to spend more on their children’s education, including the choice
of non-public school.
C. Tuition and Textbook Tax Credit Claims by School District
Across the state, 34.8 percent of taxpayers identified with qualifying dependents claimed
a Tuition and Textbook Tax Credit in tax years 2010-2020 (see Table 6). The utilization
rate is defined as the ratio of resident households claiming the credit compared to all
resident households with dependents between ages 5 and 21. The households included
in the utilization rate are limited to resident taxpayers because dependents must attend
an Iowa accredited school in order for a taxpayer to claim the credit. In analyzing the
utilization rate by AGI, the highest rate occurred between $100,000 and $124,999 and
$125,000 and $149,999 (over 50.0% for these income ranges). The lowest rates were
found in the less than $20,000 group (2.4%) and the $20,000 to $29,999 income group
(17.1%). Recall that many households in these low-income groups may not face any
eligible expenses or may not have any Iowa tax liability against which to the claim the
nonrefundable TTC.
Comparing utilization rates across the school districts in existence for the 2020-2021
school year reveals significant variation. Iowa resident taxpayers must provide their
school district of residence on their individual income tax return. Although it is possible
that a taxpayer may reside in one school district and their children attend school in a
different district, for this analysis the taxpayer is considered in the school district of
residence. The utilization rate ranges from 8.4 percent in the Corning School District to
57.4 percent in the Pella School District (see Figure 6). Over one-half of households with
qualifying dependents claimed the credit in 11 school districts while less than one-fifth
17
made claims in 15 school districts. The highest utilization rates appear to coincide with
the location of non-public schools.
The top ten school districts with the highest total of TTC dollars claimed tended to be, not
surprisingly, the school districts with the most eligible households, defined as any resident
household with a dependent aged 5 to 21 (see Table 8). Average TTC claims from TY
2020-TY 2020 among school districts ranged from $1,089 in the Hamburg School District
to $884,874 in the Des Moines School District. In tax years 2010-2020, the Des Moines,
Cedar Rapids, and Davenport school districts were the three largest school districts in the
state based on the number of eligible households. These three districts ranked as the top
three districts in terms of TTC claims and comprised three of the top districts in terms of
count of claims. Five of the other seven districts with the highest amount of claims were
also in the top ten largest school districts based on eligible households. Despite these
districts claiming the highest amounts of credits, only four of the top ten had utilization
rates above the statewide average of 34.8 percent.
School districts were ranked by average TTC credit claim for households making claims.
The average credit claimed by school district from 2010 through 2020 ranged from $38 in
the Hamburg School District to $342 in the Rock Valley School District (see Table 9). The
ten school districts with the highest average household claim ranked from 27th in the
number of eligible households to 289th. Nearly all of these school districts had above
average utilization, with only the Sheldon school district below the statewide average. Six
of the school districts in the top ten based on the average household claim are located in
Sioux County in Northwest Iowa.
Pella School District had the highest utilization rate in the state with 57.4 percent of
households with qualifying dependents making TTC claims (see Table 10). All of the top
ten school districts by utilization had utilization rates over 50 percent. Western Dubuque
was the largest school district in the top ten with 1,453 eligible households and Remsen-
Union, which ranked 6th by utilization rate, was the smallest district with only 326
households with qualifying dependents.
D. Tuition and Textbook Tax Credit Impact Analysis
This section of the analysis will focus on the impact that the TTC has on an individual’s
tax liability. Analysis was performed as to the TTCs effect on taxpayer’s liability in terms
of how much a taxpayers’ liability is increased due to the elimination of the credit. The
average impact of the TTC to an individual’s income tax liability between tax year 2013
and 2018 was gathered utilizing the IDR individual income tax micro model.
Micro model
This analysis employs the IDR individual income tax micro model developed for previous
Legislative sessions. The model forecasts both federal and Iowa tax liability at household
level for all the Iowa individual income tax filers. Non-filers’ tax liability (essentially through
withholding payments) are also estimated as one category. To estimate tax liability in
18
individual years, individual tax return data for that particular tax year are used by the
model. The income components are then run through two tax calculators which reflect
current law during that particular tax year and removing the Tuition and Textbook Tax
Credit from the calculation of an individual’s nonrefundable tax credit calculation. Tax-
year impacts are converted into State fiscal-year changes using current or proposed
withholding tax formulas and historical patterns of estimates, final returns, and refunds.
Claimants of the TTC are aggregated into groupings based upon adjusted gross income
ranges and individual tax years between 2013 and 2018. The results will be presented in
chart form to show the percent by which the TTC affects an individual’s tax liability after
all the deductions, non-refundable credits, and refundable credits calculations are
completed.
The impact of the TTC to individual’s income tax liability varied depending upon the AGI
group to which they belong. While results do conclude that as an individual’s AGI
increases, both their TTC claim amount increases and their differential in total tax liability,
their percent change in liability does not. Though claimants with an AGI between $20,000
and $30,000 only experience a differential of $71 due to the TTC, their change in tax
liability due to the TTC is 24.0 percent (see table 11). TTC claimants with an AGI between
$30,000 and $40,000 had the second highest percent change in tax liability due to the
TTC at 10.3 percent, while the lowest percent change in tax liability was for claimants with
an AGI between $125,000 and $150,000 at 2.4 percent (see table 11).
E. Tuition and Textbook Tax Credit Potential Scenarios
The following analyses presents the fiscal impacts for potential scenarios that would
change the Tuition and Textbook Tax Credit. Scenarios include:
Scenario 1: raise the Tuition and Textbook Tax Credit from 25 percent of the first
$2,000 in qualified expenses for each student to 50 percent of the first
$2,000 in qualified expenses for each student.
Scenario 2: raise the Tuition and Textbook Tax Credit from 25 percent of the first
$2,000 in qualified expenses for each student to 100 percent of the
first $2,000 in qualified expenses for each student.
Scenario 3: increase to 25 percent of the first $4,000 in qualified expenses for each
student.
Scenario 4: the tax credit revised from nonrefundable to refundable.
Scenario 5: eliminate the tax credit from the Iowa Tax Code
These scenarios are assumed to be effective for tax years beginning on or after January
1, 2023.
When the State changes a tax credit from nonrefundable to refundable, some taxpayers
may experience a small tax increase as a result of increased school surtax. School surtax
is calculated on computed tax net of nonrefundable tax credits; thus, when a formerly
nonrefundable tax credit becomes refundable, the school surtax base (computed tax net
19
of nonrefundable tax credits) increases, resulting in a higher school surtax. For taxpayers
with comparatively low tax credit claims, this results in a net tax increase.
The revisions under the proposals described in these analyses would decrease Iowa
individual income tax liability and thereby decrease General Fund income tax revenues
and surtax revenues.
Micro model
These analyses employ the IDR individual income tax micro model. The model forecasts
both federal and Iowa tax liability at household level for all the Iowa individual income tax
filers. Non-filers’ tax liability (essentially through withholding payments) are also estimated
as one category.
To estimate tax liability in years after 2020, individual tax return data for tax year 2020
(the most recent complete tax year data) used by the model are adjusted for estimated
growth in income components and changes in the size and age distribution of the
population. The income growth forecasts are based on various income projections
produced by external economic models primarily from Moody’s Analytics. Economic
projections do not assume any specific unusual growth or recessionary periods.
Population projections are based on the REMI model for the State of Iowa.
The income components are then run through two tax calculators which reflect current
law and the proposal to calculate tax liability changes by tax year. Tax-year impacts are
converted into State fiscal-year changes using current or proposed withholding tax
formulas and historical patterns of estimates, final returns, and refunds. In the model,
temporary federal law changes under TCJA expire after TY 2025. All revisions to the Iowa
Tax Code during the 2022 legislative session are included in the micromodel, including
the phased in flat income tax rates.
Scenario 1
Under the first scenario (increase the credit rate from 25 percent of first $2,000 of qualified
expenses to 50 percent of first $2,000 of qualified expenses). It is estimated that 88.8
percent of taxpayers will see no change to their taxes. Approximately 11.2 percent of
taxpayers (over 192,000) will see a decrease in tax liability, including more than 30.0
percent of taxpayers with AGI over $100,000 and less than $500,000. The estimated
average tax liability decrease per TTC claimant in TY 2023 is $206, but the average
decrease is estimated to rise with income from about $50 at the lowest income level up
to $470 for individuals with an AGI above $1.0 million (see Table 12).
It is assumed that nearly all the higher tax credit claims would be realized when taxpayers
file final returns. State General Fund revenues are estimated to drop only $0.08 million in
FY 2023. This negative impact increases to $38.5 million in FY 2024, $38.3 million in FY
2025, $38.1 million in FY 2026, and then remains around $34.0 million from FY 2027
20
through FY 2028 (see Table 13). School surtax collections are estimated to decrease by
approximately $1.1 million each tax year (author’s calculations, not included in the tables).
Scenario 2
Under the second scenario (increase the credit rate from 25 percent of first $2,000 of
qualified expenses to 100 percent of first $2,000 of qualified expenses). It is estimated
that 88.9 percent of taxpayers will see no change to their taxes. Approximately 11.1
percent of taxpayers (over 191,000) will see a decrease in tax liability, including more
than 30.0 percent of taxpayers with AGI over $100,000 and less than $500,000. The
estimated average tax liability decrease per TTC claimant in TY 2023 is $551, but the
average decrease is estimated to rise with income from about $85 at the lowest income
level up to $1,412 for individuals with an AGI above $1.0 million (see Table 12).
It is assumed that nearly all the higher tax credit claims would be realized when taxpayers
file final returns. State General Fund revenues are estimated to drop only $1.19 million in
FY 2023. This negative impact increases to $101.21 million in FY 2024, $102.61 million
in FY 2025, $101.86 million in FY 2026, and then remains around $89.0 million from FY
2027 through FY 2028 (see Table 13). School surtax collections are estimated to
decrease by approximately $2.9 million each tax year (author’s calculations, not included
in the tables).
Scenario 3
Under the third scenario (increase the credit rate from 25 percent of first $2,000 of
qualified expenses to 25 percent of the first $4,000 of qualified expenses). It is estimated
that 98.8 percent of taxpayers will see no change to their taxes. Approximately 1.2
percent of taxpayers (over 20,000) will see a decrease in tax liability, including more than
5.0 percent of taxpayers with AGI over $175,000. The estimated average tax liability
decrease per TTC claimant in TY 2023 is about $639, but the average decrease is
estimated to rise with income from about $133 at the lowest income level up to $977 for
individuals with an AGI above $1.0 million (see Table 12).
It is assumed that nearly all the higher tax credit claims would be realized when taxpayers
file final returns. State General Fund revenues are estimated to drop only $0.03 million in
FY 2023. This negative impact increases to $12.5 million in FY 2024, $12.4 million in FY
2025, $12.3 million in FY 2026, and then remains around $11.0 million from FY 2027
through FY 2028 (see Table 13). School surtax collections are estimated to decrease by
approximately $0.3 million each tax year (author’s calculations, not included in the tables).
Scenario 4
Under the fourth scenario (revise the credit from a nonrefundable 25 percent of first
$2,000 of qualified expenses to a refundable 25 percent of the first $2,000 of qualified
expenses). It is estimated that 91.0 percent of taxpayers will see no change to their taxes.
Approximately 2.8 percent of taxpayers (over 48,000) will see a decrease in tax liability,
21
including more than 5.0 percent of taxpayers with AGI under $10,000. The estimated
average tax liability decrease per TTC claimant in TY 2023 is about $287, but the average
decrease is estimated to vary with income from about $265 at the lowest income level up
to $573 for individuals with an AGI between $500,000 to $1.0 million (see Table 12).
It is assumed that nearly all the higher tax credit claims would be realized when taxpayers
file final returns. State General Fund revenues are estimated to drop only $0.02 million in
FY 2023. This negative impact increases to $13.8 million in FY 2024, $14.3 million in FY
2025, $14.5 million in FY 2026, and then remains around $18.0 million from FY 2027
through FY 2028 (see Table 13). School surtax collections are estimated to decrease by
approximately $1.2 million each tax year (author’s calculations, not included in the tables).
Scenario 5
Under the fifth scenario (elimination of the TTC from the Iowa Tax Code). It is estimated
that 88.2 percent of taxpayers will see no change to their taxes. Approximately 11.8
percent of taxpayers (nearly 203,000) will see an increase in tax liability, including more
than 30.0 percent of taxpayers with AGI over $100,000 and less than $500,000. The
estimated average tax liability increase per TTC claimant in TY 2023 is about $223, but
the average increase is estimated to increase with income from about $94 at the lowest
income level up to $470 for individuals with an AGI above $1.0 million (see Table 12).
It is assumed that nearly all the higher tax credit claims would be realized when taxpayers
file final returns. State General Fund revenues are estimated to increase only $0.09
million in FY 2023. This impact increases to $43.66 million in FY 2024, $43.61 million in
FY 2025, $43.39 million in FY 2026, and then remains around $38.0 million from FY 2027
through FY 2028 (see Table 13). School surtax collections are estimated to increase by
approximately $1.25 million each tax year (author’s calculations, not included in the
tables).
22
References
Barnett, L. A. (2008). Predicting youth participation in extracurricular recreational
activities: Relationships with individual, parent, and family characteristics. Journal of Park
& Recreation Administration, 26(2), 28-60.
Burkhardt, Randi J. (2016). The Impact of Poverty on Participation in Extracurricular
Activities. Graduate Programs in Education Goucher College
C. S. Mott Children’s Hospital. 2012. “Pay-to-Play Keeping Lower-Income Kids out of the
Game,” C.S. Mott Children’s Hospital National Poll on Children’s Health 15, no. 3.
Hoff, D. L., & Mitchell, S. N. (2006). Pay-to-play: fair or foul? Phi Delta Kappan, 88(3),
230-234.
Hoff, D. L., & Mitchell, S. N. (2007). Should our students pay to play extracurricular
activities? Education Digest, 72(6), 27-34.
Israel, J. M. (2013). Student extracurricular participation, student achievement, and
school perception: An elementary school perspective. Doctoral Dissertation
Miller, Derek G., "The Impact of Formal Extracurricular Activities on Satisfaction and
Attitudes-toward-School among At-Risk Adolescents" (2016). MA IDS Thesis Projects.
39.
Morse, A. B., Anderson, A. R., Christenson, S. L., & Lehr, C. A. (2004). Promoting school
completion. National Association of School Psychologists.
Snellman, Kaisa; Silva, Jennifer M.; Putnam, Robert D. (2015). Inequity outside the
Classroom: Growing Class Differences in Participation in Extracurricular Activities. Voices
in Urban Education, n40 p7-14 2015
Vukic, V. V., & Zrilic, S. (2016). The Connection between Pupils’ School Success and
Their Inclusiveness in Extracurricular and Out-of-School Activities in Croatia. World
Journal of Education, 6(3).
23
Iowa’s Tuition and Textbook Tax Credit
Tables and Figures

24
Table 1. Expenses Eligible for the Tuition and Textbook Tax Credit
Sources: IDR individual income tax instructions and Iowa Administrative Rules Chapter 701.42.4.
Expenditure Category Eligible Expenditures Ineligible Expenditures
Tuition Tuition for any K-12 school that is accredited
Any amount for food, lodging, or clothing or
amounts paid relating to the teaching of
religious tenets, doctrines or worship;
amounts for private instruction or tutoring not
paid to a school
Textbooks and
Publications
Textbooks and other instructional materials
used in teaching subjects legally and
commonly taught in Iowa's public elementary
and secondary schools, including those
needed for extracurricular activities (including
fees for required textbooks and supplies);
computers, if required
Yearbooks or annuals; textbook fines
Clothing
Rental or purchase of “non-street” costumes
for a play or special clothing for a concert not
suitable for everyday wear; rental of prom
dresses and tuxedos
Clothes which can be used for street wear,
such as T-shirts for extracurricular events;
clothing for a play or concert that is suitable
for everyday wear; purchase of prom dresses
and tuxedos
Driver's Education Only if paid to the K-12 school Paid to other than a K-12 school
Dues, Fees and
Admissions
Annual school fees; fees or dues paid for
extracurricular activities ; booster club dues
(for dependent only); fees for athletics; activity
ticket or admission for K-12 school athletic,
academic, music, or dramatic events and
awards banquets or buffets; fees for a
physical education event such as roller
skating; advanced placement fees if paid to
high school; fees for homecoming, winter
formal, prom, or similar events
Sports-related socials; special education
programs like career conferences; special
testing like SAT, PSAT, ACT and Iowa talent
search tests; fees paid to K-12 schools for
college credit or special programs at colleges
and universities; advanced placement fees if
paid to a college or a university
Materials for
Extracurricular Activities
Materials for extracurricular activities, such as
sporting events, speech activities, musical or
dramatic events, awards banquets,
homecoming, prom, and other school-related
social events
Class rings
Music
Rental of musical instruments for school or
band; music / instrument lessons at a school;
sheet music used in a school; music books
and materials used in school bands or
orchestras for maintenance of instruments,
including reeds, strings, picks, grease, and
other consumables
Purchase of musical instruments (including
rent-to-own contracts); music lessons outside
of school; sheet music for private use
Religion --------
Amounts paid are not allowed if they relate to
teaching of religious tenets, doctrines, or
worship
Shoes
Football, soccer, and golf shoes; other shoes
with cleats or spikes not suitable for street
wear for teams associated with the school
Basketball shoes and other shoes suitable for
everyday wear
Supplies for Industrial
Arts, Home Economics
or Equivalent Classes
Cost of required basic materials for classes
such as shop class, mechanics class,
agricultural class, home economics class, or
equivalent classes
Optional expenditures or materials used for
personal projects of the dependents or for
family benefit
Travel
Fees for transportation to and from school if
paid to the school; fees for field trips if the trip
is during school hours
Travel expenses for overnight trips which
involve payment for meals and lodging
Uniforms Band and athletic uniforms --------

25
Figure 1. Number of Households Claiming the Tuition and Textbook Tax Credit, Tax Years 1999 - 2020
Source – IDR 1999 - 2020 individual income tax returns
75.9 75.9
78.0
99.4
102.7
106.3
113.8
118.6
120.0
119.4
121.4 121.4
120.7
121.1
120.3
117.3
118.3
117.8
116.7
113.9
111.9
104.6
0
20
40
60
80
100
120
140
Number of Households (thousands)
Tax Year
26
Figure 2. Total Tuition and Textbook Tax Credit Claims, Tax Years 1999 – 2020
Source – IDR 1999 - 2020 individual income tax returns
$10.3
$11.4
$12.4
$13.1
$13.8
$14.3
$15.2
$15.1
$15.3
$15.1
$15.2
$15.3
$15.1
$15.3
$15.2
$15.4
$15.5
$15.3 $15.3
$15.1
$14.9
$14.0
$0
$2
$4
$6
$8
$10
$12
$14
$16
$18
$ Millions
Tax Year

27
Figure 3. School Enrollment and Number of Tuition and Textbook Tax Credit Claims
Source – IDR 1999 - 2020 individual income tax returns

28
Table 2. Age of Dependents Reported by Tuition and Textbook Tax Credit Claimants,
Tax Year 2020
Source: 2020 IDR and Internal Revenue Service individual income tax returns
Notes: The IRS captures birth dates for the first four dependents. In households with five or
more dependents, the eligibility of the first four were verified against the IRS age data; all
additional dependents were assumed to be qualified.
Dependents missing age data are assumed to be from ages 5 through 21.
The Tuition and Textbook Tax Credit was not necessarily claimed for all dependents reported
by the taxpayer.
Age
Number of
Dependents
Distribution of
Dependents
5 8,337 3.98%
6 10,355 4.94%
7 11,066 5.28%
8 11,499 5.48%
9 11,925 5.69%
10 12,333 5.88%
11 13,171 6.28%
12 13,617 6.49%
13 14,090 6.72%
14 14,592 6.96%
15 14,256 6.80%
16 14,102 6.72%
17 13,789 6.57%
18 9,446 4.50%
19 5,251 2.50%
20 3,496 1.67%
21 2,210 1.05%
Subtotal 183,535 87.51%
Missing 3,575 1.70%
Subtotal 187,110 89.22%
0 to 4 20,125 9.60%
22 - 24 1,569 0.75%
25 and over 918 0.44%
Total 209,722 100%

29
Table 3. Tuition and Textbook Tax Credit Claims by Qualifying Dependents, Tax Year 2020
Source: 2020 IDR and Internal Revenue Service individual tax returns
Table 4. Share of Households Claiming the Maximum Tuition and Textbook Tax Credit, Tax Years 2010 - 2020
Source: IDR individual income tax returns
Number of Qualifying
Dependents
Number of
Households
Number of
Dependents
Distribution of
Dependents
Amount of
Claims
Distribution of
Claims
Average Claim
per Household
Average Claim
per Dependent
1 37,466 37,466 20.02% $3,020,641 21.57% $81 $81
2 39,181 78,362 41.88% $5,036,856 35.96% $129 $64
3 16,241 48,723 26.04% $3,244,635 23.16% $200 $67
4 or more 11,721 22,559 12.06% $2,704,505 19.31% $231 $120
Total 104,609 187,110 100% $14,006,637 100% $133.90 $75
Tax Year
Total Number
of Households
Total Amount
of Claims
(millions)
Households Claiming
Maximum Credit
Number of
Dependents
Share of Households
Claiming Max Credit
Amount of
Maximum Claims
(millions)
2010 121,400 $15.3 8,686 15,546 7.2% $3.9
2011 120,654 $15.1 8,916 15,952 7.4% $4.0
2012 121,071 $15.3 9,346 16,698 7.7% $4.2
2013 120,252 $15.2 9,269 16,647 7.7% $4.2
2014 117,284 $15.4 9,411 16,759 8.0% $4.2
2015 118,348 $15.5 9,694 17,237 8.2% $4.3
2016 117,788 $15.3 9,608 17,106 8.2% $2.4
2017 116,707 $15.3 9,891 17,628 8.5% $2.5
2018 113,938 $15.1 10,058 17,949 8.8% $2.5
2019 111,904 $14.9 10,042 17,927 9.0% $2.5
2020 104,609 $14.0 10,453 18,566 10.0% $2.6

30
Table 5. Tuition and Textbook Tax Credit Claims by Resident Status, Tax Year 2020
Source: IDR 2020 and Internal Revenue Service individual income tax returns
(1) There were 4 returns with an Iowa address that did not report a valid Iowa county number
State of Residence
Number of
Households
Share of
Households
Amount of Claims
Share of
Claims
Number of
Dependents
Share of
Dependents
Iowa Residents 103,709 99.14% $13,833,882 98.77% 220,436 99.15%
Iowa (1) 4 0.00% $751 0.01% 9 0.00%
Nonresidents
Illinois 85 0.08% $12,882 0.09% 181 0.08%
Minnesota 56 0.05% $9,952 0.07% 128 0.06%
Missouri 39 0.04% $7,237 0.05% 79 0.04%
Nebraska 162 0.15% $37,750 0.27% 339 0.15%
South Dakota 110 0.11% $31,641 0.23% 236 0.11%
Wisconsin 49 0.05% $9,777 0.07% 108 0.05%
Not Contiguous to Iowa 395 0.38% $62,765 0.45% 809 0.36%
Nonresidents Total 896 0.86% $172,004 1.23% 1,880 0.85%
Total 104,609 100% $14,006,637 100% 222,325 100%

31
Table 6. Tuition and Textbook Tax Credit Claims by Filing Status, Tax Years 2010-2020
Source: IDR 2010-2020 individual income tax returns
Note: Utilization Rate is the ratio of resident households claiming the credit compared to all resident households with
dependents between ages 5 and 21.
Filing Status
Average
Number of
Households
Distribution of
Households
Average
Amount of
Claims
Distribution of
Claims
Average
Claim
Average
Eligible
Expenses
Utilization
Rate*
Single 1,697 1.45% $140,725 0.93% $83 $562,898 11.1%
Married Joint 13,855 11.87% $2,345,910 15.52% $169 $9,383,641 28.6%
Married Separate
Combined
78,438 67.19% $10,648,982 70.46% $136 $42,595,928 47.7%
Married Separate 996 0.85% $91,867 0.61% $92 $367,467 30.9%
Head of Household 21,599 18.50% $1,865,722 12.35% $86 $7,462,889 21.2%
Qualified Widow(er) 155 0.13% $19,559 0.13% $126 $78,237 28.1%
Total 116,741 100% $15,112,765 100% $129 $60,451,062 34.8%

32
Table 7. Tuition and Textbook Tax Credit Claims by Adjusted Gross Income, Tax Years 2010-2020
Source: IDR 2020 individual income tax returns
Note: Utilization Rate is the ratio of resident households claiming the credit compared to all resident households with
dependents between ages 5 and 21.
Income Range
Average
Number of
Households
Distribution of
Households
Average
Amount of
Claims
Distribution of
Claims
Average
Claim
Average
Eligible
Expenses
Utilization
Rate*
Less than $20,000 1,130 0.97% $98,269 0.65% $87 $393,074 2.4%
$20,000 - $29,999 5,993 5.13% $454,638 3.01% $76 $1,818,550 17.1%
$30,000 - $39,999 9,379 8.03% $886,269 5.86% $94 $3,545,077 28.5%
$40,000 - $49,999 9,829 8.42% $1,016,156 6.72% $103 $4,064,626 35.0%
$50,000 - $59,999 10,041 8.60% $1,103,265 7.30% $110 $4,413,059 40.0%
$60,000 - $69,999 10,306 8.83% $1,176,562 7.79% $114 $4,706,247 44.0%
$70,000 - $79,999 10,098 8.65% $1,203,963 7.97% $119 $4,815,851 46.5%
$80,000 - $89,999 9,476 8.12% $1,175,448 7.78% $124 $4,701,792 48.1%
$90,000 - $99,999 8,659 7.42% $1,121,807 7.42% $130 $4,487,230 49.1%
$100,000 -$124,999 16,455 14.10% $2,273,093 15.04% $138 $9,092,374 50.4%
$125,000 -$149,999 9,406 8.06% $1,415,335 9.37% $150 $5,661,340 50.7%
$150,000 -$174,999 5,249 4.50% $870,670 5.76% $166 $3,482,678 50.0%
$175,000 -$199,999 3,003 2.57% $538,844 3.57% $179 $2,155,375 48.8%
$200,000 and Over 7,717 6.61% $1,778,447 11.77% $230 $7,113,788 46.4%
Total 116,741 100% $15,112,765 100% $129 $60,451,062 34.8%

33
Figure 6. Average Tuition and Textbook Tax Credit Utilization Rates by School District, Tax Years 2010-2020
Sources: IDR 2010-2020 individual income tax returns; Iowa State University Geographic Information Systems Support &
Research Facility
Note: Utilization Rate is the ratio of resident households claiming the credit compared to all resident households with
dependents between ages 5 and 21.
n
n
n
n
n
nn
n
n
n
n
n
n
n
n
n
n
n
n
n
nn
n
n
n
n
n
n
n
n
n
n
n
n
n
n
n
n
n
n
n
n
n
n
n
n
n
n
nn
n
n
n
n
n
n
n
n
n
n
n
n
n
n
n
n
n
n
n
n
n
n
n
n
n
n
n
n
nn
n
n
n
n
n
n
n
n
n
nn
nn
n
n
n
n
n
nn
nn
n
n
n
n
n
n
n
n
nnn
n
n
n
n
nn
n
n
n
n
n
n
nn
n
n
n
n
n
n
nn
n
n
n
n
n
n
n
n
nn
n
nnn
nn
n
n
n
n
n
n
n
n
n
n
n
n
n
n
n
n
n
n
n
n
n
n
n
n
n
n
n
n
n
n
n
n
nn
n
n
n
n
n
n
n
n
n
n
nn
n
n
nn
n
n
n
n
n
n
nn
n
n
n
n
n
n
n
n
n
n
n
n
n
n
Legend
n
k-12_schools selection
Share
8.4% - 25%
25% < 35%
35% < 40%
40% < 45%
45% < 50%
50% < 57.4%
Legend
n
k-12_schools selection
Share
8.4% - 25%
25% < 35%
35% < 40%
40% < 45%
45% < 50%
50% < 57.4%
Legend
n
k-12_schools selection
Share
8.4% - 25%
25% < 35%
35% < 40%
40% < 45%
45% < 50%
50% < 57.4%
Legend
n
k-12_schools selection
Share
8.4% - 25%
25% < 35%
35% < 40%
40% < 45%
45% < 50%
50% < 57.4%
Legend
n
k-12_schools selection
Share
8.4% - 25%
25% < 35%
35% < 40%
40% < 45%
45% < 50%
50% < 57.4%
Legend
n
k-12_schools selection
Share
8.4% - 25%
25% < 35%
35% < 40%
40% < 45%
45% < 50%
50% < 57.4%

34
Figure 7. Average Tuition and Textbook Tax Credit Claims by School District, Tax Years 2010-2020
Sources: IDR 2010-2020 individual income tax returns; Iowa State University Geographic Information Systems Support &
Research Facility
n
n
n
n
n
nn
n
n
n
n
n
n
n
n
n
n
n
n
n
nn
n
n
n
n
n
n
n
n
n
n
n
n
n
n
n
n
n
n
n
n
n
n
n
n
n
n
nn
n
n
n
n
n
n
n
n
n
n
n
n
n
n
n
n
n
n
n
n
n
n
n
n
n
n
n
n
n
n
n
n
n
n
n
n
n
n
n
nn
nn
n
n
n
n
n
n
n
nn
n
n
n
n
n
n
n
n
nnn
n
n
n
n
n
n
n
n
n
n
n
n
nn
n
n
n
n
n
n
nn
n
n
nn
n
n
n
n
nn
n
n
nn
nn
n
n
n
n
n
n
n
n
n
n
n
n
n
n
n
n
n
n
n
n
n
n
n
n
n
n
n
n
n
n
n
n
nn
n
n
n
n
n
n
n
n
n
n
nn
n
nnn
n
n
n
n
n
n
nn
n
n
n
n
n
n
n
n
n
n
n
n
n
n
Legend
n
k-12_schools selection
Claims
20 - 150
150 - 300
300 - 500
500 - 1,000
1,000 - 2,000
2,000 - 6,200
Legend
n
k-12_schools selection
Claims
20 - 150
150 - 300
300 - 500
500 - 1,000
1,000 - 2,000
2,000 - 6,200
Legend
n
k-12_schools selection
Claims
20 - 150
150 - 300
300 - 500
500 - 1,000
1,000 - 2,000
2,000 - 6,200
Legend
n
k-12_schools selection
Claims
20 - 150
150 - 300
300 - 500
500 - 1,000
1,000 - 2,000
2,000 - 6,200
Legend
n
k-12_schools selection
Claims
20 - 150
150 - 300
300 - 500
500 - 1,000
1,000 - 2,000
2,000 - 6,200
Legend
n
k-12_schools selection
Claims
20 - 150
150 - 300
300 - 500
500 - 1,000
1,000 - 2,000
2,000 - 6,200

35
Table 8. Top Ten School Districts by Average Total Tuition and Textbook Tax Credit Claims, Tax Years 2010-2020
Source: IDR 2010-2020 individual income tax returns
Notes: Eligible household is a resident household with a dependent aged 5 to 21. Utilization rate is the ratio of resident
households claiming the credit compared to all resident households with dependents between ages 5 and 21.
Number Total Amount Percent of All Utilization
School District Rank Number of Claims of Claims Dollars Claimed Rate
1 DES MOINES 1 24,252 6,196 $884,874 5.9% 25.5%
2 CEDAR RAPIDS 2 13,185 4,369 $723,156 4.8% 33.1%
3 DAVENPORT 3 11,767 3,391 $558,869 3.7% 28.7%
4 DUBUQUE 7 8,091 3,421 $505,658 3.4% 42.3%
5 WEST DES MOINES 9 6,940 2,791 $490,047 3.3% 40.2%
6 SIOUX CITY 4 9,982 2,548 $420,856 2.8% 25.5%
7 IOWA CITY 5 9,345 2,899 $402,439 2.7% 31.0%
8 WESTERN DUBUQUE 27 2,558 1,453 $346,181 2.3% 56.8%
9 WATERLOO 6 8,215 1,831 $339,367 2.3% 22.2%
10 WAUKEE 11 5,350 2,423 $333,713 2.2% 45.3%
Average Tuition and Textbook Tax Credit Claims
Average
Number of Eligible Households

36
Table 9. Top Ten School Districts by Average Tuition and Textbook Tax Credit Claim, Tax Years 2010-2020
Source: IDR 2010-2020 individual income tax returns
Note: Utilization Rate is the ratio of resident households claiming the credit compared to all resident households with
dependents between ages 5 and 21.
Number Total Amount Average Credit Utilization
School District Rank Number of Claims of Claims Per Claimant Rate
1 ROCK VALLEY 111 657 322 $110,190 $342 49.1%
2 SIOUX CENTER 60 1,075 571 $183,204 $321 53.2%
3 BOYDEN-HULL 133 531 285 $91,309 $320 53.6%
4 SHELDON 96 765 183 $51,131 $280 23.9%
5 REMSEN-UNION 229 326 175 $48,437 $277 53.4%
6 CARROLL 38 1,635 808 $201,180 $249 49.4%
7 WESTERN DUBUQUE 27 2,558 1,453 $346,181 $238 56.8%
8 MOC-FLOYD VALLEY 54 1,156 541 $122,722 $227 46.8%
9 NORTH KOSSUTH 297 184 75 $14,619 $195 41.0%
10 AR-WE-VA 289 205 80 $15,408 $192 39.2%
Average
Number of Eligible Households
Average Tuition and Textbook Tax Credit Claims

37
Table 10. Top Ten School Districts by Average Tuition and Textbook Tax Credit Utilization Rate, Tax Year 2010-
2020
Source: IDR 2010-2020 individual income tax returns
Notes: Eligible household is a resident household with a dependent aged 5 to 21. Utilization Rate is the ratio of resident
households claiming the credit compared to all resident households with dependents between ages 5 and 21.
Number Total Amount Percent of All Utilization
School District Rank Number of Claims of Claims Dollars Claimed Rate
1 PELLA 35 1,708 980 $169,696 1.1% 57.4%
2 WESTERN DUBUQUE 27 2,558 1,453 $346,181 2.3% 56.8%
3 WEST MARSHALL 132 532 285 $30,189 0.2% 53.7%
4 BOYDEN-HULL 133 531 285 $91,309 0.6% 53.6%
5 WEST DELAWARE 63 1,050 561 $80,734 0.5% 53.5%
6 REMSEN-UNION 229 326 175 $48,437 0.3% 53.4%
7 SIOUX CENTER 60 1,075 571 $183,204 1.2% 53.2%
8 SOUTH WINNESHIEK 157 448 235 $39,130 0.3% 52.5%
9 GILBERT 99 755 389 $45,649 0.3% 51.5%
10 ALGONA 68 1,014 512 $94,998 0.6% 50.5%
Average
Number of Eligible Households
Average Tuition and Textbook Tax Credit Claims

38
Table 11. Average Impact of the Tuition and Textbook Tax Credit to Claimants, Tax Years 2013-2018
Source: Individual Return Data from Tax Years 2013 through 2018. Iowa Department of Revenue, Research and Policy
Division
Adjusted Gross Income
Average of Tax Liability
Differential
Average Percent Change
in Liability
Average Tax Liability for
TTC Claimants With TTC
Average Tax Liability for
TTC Claimants Without TTC
$20,000 to $30,000 $71 24% $226 $297
$30,000 to $40,000 $93 10% $804 $897
$40,000 to $50,000 $100 6% $1,485 $1,586
$50,000 to $60,000 $109 5% $2,039 $2,148
$60,000 to $70,000 $114 4% $2,555 $2,669
$70,000 to $80,000 $120 4% $3,057 $3,177
$80,000 to $90,000 $124 3% $3,584 $3,708
$90,000 to $100,000 $132 3% $4,112 $4,244
$100,000 to $125,000 $139 3% $5,016 $5,156
$125,000 to $150,000 $155 2% $6,346 $6,501

39
Table 12. Estimated Distribution of Tuition and Textbook Tax Credit Claimants Experiencing Decreases and
Increases in Total Tax Liability in Tax Year 2023 by Potential Scenario
Source: Individual Return Data from Tax Year 2020. The micro model created for FY 2022 legislative session. Iowa
Department of Revenue, Research and Policy Division
Iowa Taxable Income
Current Law
Residents Filers Total Average Total Average Total Average Total Average Total Average
$10,000 or less -$220,392 -$49 -$380,493 -$85 $0 $0 -$8,704,835 -$265 $862,456 $94
$10,001 to 20,000 -$1,409,348 -$104 -$2,810,199 -$204 -$86,160 -$133 -$758,671 -$339 $2,896,674 $184
$20,001 to 30,000 -$2,198,254 -$151 -$4,817,253 -$315 -$359,743 -$317 -$260,512 -$324 $3,181,349 $209
$30,001 to 40,000 -$2,535,763 -$172 -$5,970,904 -$408 -$528,802 -$391 -$112,482 -$306 $3,184,998 $213
$40,001 to 50,000 -$2,593,744 -$191 -$6,535,710 -$474 -$693,384 -$486 -$41,319 -$228 $2,909,006 $212
$50,001 to 60,000 -$2,597,353 -$201 -$6,593,617 -$515 -$732,312 -$537 -$33,631 -$249 $2,799,824 $216
$60,001 to 70,000 -$2,612,545 -$211 -$6,465,946 -$535 -$840,481 -$649 -$32,613 -$247 $2,724,336 $219
$70,001 to 80,000 -$2,496,086 -$214 -$6,489,014 -$572 -$801,798 -$650 -$36,238 -$292 $2,545,024 $217
$80,001 to 90,000 -$2,471,314 -$220 -$6,712,286 -$621 -$858,308 -$688 -$27,778 -$231 $2,500,504 $222
$90,001 to 100,000 -$2,279,635 -$220 -$6,119,847 -$614 -$861,596 -$740 -$27,027 -$273 $2,298,826 $221
$100,001 to 125,000 -$4,783,114 -$222 -$12,897,272 -$640 -$1,674,587 -$730 -$57,791 -$292 $4,819,962 $223
$125,001 to 150,000 -$3,374,865 -$232 -$9,610,873 -$680 -$1,289,616 -$774 -$38,169 -$261 $3,391,706 $233
$150,001 to 175,000 -$2,046,874 -$247 -$6,356,191 -$736 -$826,784 -$769 -$24,738 -$326 $2,063,498 $248
$175,001 to 200,000 -$1,375,103 -$269 -$4,179,418 -$778 -$611,286 -$819 -$11,500 -$225 $1,381,987 $270
$200,001 to 250,000 -$1,616,011 -$276 -$5,086,071 -$808 -$718,004 -$800 -$19,717 -$340 $1,623,784 $277
$250,001 to 500,000 -$2,158,536 -$320 -$6,918,561 -$946 -$1,067,049 -$869 -$51,062 -$486 $2,165,548 $321
$500,001 to 1,000,000 -$706,629 -$431 -$2,129,207 -$1,251 -$396,797 -$961 -$21,196 -$573 $708,229 $432
$1,000,001 or more -$267,764 -$470 -$869,494 -$1,412 -$158,301 -$977 -$12,031 -$481 $267,754 $470
Resident Filers Total -$37,743,330 -$205 -$100,942,356 -$551 -$12,505,008 -$646 -$10,271,310 -$272 $42,325,465 $220
Nonresident Filers
$50,000 or less -$333,561 -$157 -$667,608 -$323 -$31,004 -$274 -$1,701,700 -$322 $651,577 $213
$50,001 to 100,000 -$519,322 -$235 -$1,150,231 -$528 -$85,332 -$395 -$591,939 -$351 $732,376 $268
$100,001 to 500,000 -$812,254 -$264 -$2,108,923 -$672 -$143,311 -$527 -$927,328 -$356 $1,049,402 $279
$500,001 or more -$276,053 -$291 -$701,793 -$734 -$47,740 -$503 -$384,874 -$377 $372,997 $324
Composite Filers $0 $0 $0 $0 $0 $0 $0 $0 $0 $0
Nonresident Filers Total -$1,941,190 -$232 -$4,628,555 -$555 -$307,387 -$441 -$3,605,841 -$340 $2,806,352 $262
All Tax Filers Total -$39,684,520 -$206 -$105,570,911 -$551 -$12,812,395 -$639 -$13,877,151 -$287 $45,131,817 $223
Estimates for Tax Year 2023
Scenario 4
Scenario 5
Scenario 1
Scenario 2
Scenario 3
Estimated Change in State Income Tax and School Surtax Liability
For Claimants of the Iowa Tuition and Textbook Tax Credit

40
Notes: Scenario 1: 50 percent of the first $2,000 in qualified expenses for each student; Scenario 2: 100 percent of the first
$2,000 in qualified expenses for each student; Scenario 3: increase to 25 percent of the first $4,000 in qualified expenses
for each student; Scenario 4: the tax credit revised from nonrefundable to refundable; Scenario 5: eliminate the tax credit
from the Iowa Tax Code
Table 13. Translation of Tax Year Estimated Impact to Fiscal Year Estimated Impacts Under Potential Scenarios
Source: Individual Return Data from Tax Year 2020. The micro model created for FY 2022 legislative session. Iowa
Department of Revenue, Research and Policy Division
Notes: Scenario 1: 50 percent of the first $2,000 in qualified expenses for each student; Scenario 2: 100 percent of the first
$2,000 in qualified expenses for each student; Scenario 3: increase to 25 percent of the first $4,000 in qualified expenses
for each student; Scenario 4: the tax credit revised from nonrefundable to refundable; Scenario 5: eliminate the tax credit
from the Iowa Tax Code
Fiscal Year Estimates
FY 2023 FY 2024 FY 2025 FY 2026 FY 2027 FY 2028
Scenario 1 -$0.079 -$38.477 -$38.291 -$38.114 -$34.007 -$34.177
Scenario 2 -$1.188 -$101.206 -$102.610 -$101.862 -$88.806 -$89.475
Scenario 3 -$0.030 -$12.461 -$12.375 -$12.321 -$10.948 -$11.025
Scenario 4 -$0.023 -$13.840 -$14.265 -$14.499 -$18.094 -$17.957
Scenario 5 $0.085 $43.659 $43.614 $43.386 $39.724 $39.790
Millions of Dollars
