
NORTH
Colorado Department of Transportation Region 4
Lane Closure Strategy
Fourth Edition
Technical Report and
Lane Closure Schedules
Year 2020
LANE CLOSURE STRATEGY – 4
TH
EDITION
Colorado Department of Transportation
Region 4
Jointly prepared by:
Colorado Department of Transportation, Region 4 – Traffic Section
Felsburg Holt & Ullevig
Colorado Department of Transportation
Jonathan Woodworth
Felsburg Holt & Ullevig
Lyle E. DeVries, PE, PTOE
Ryan K. Saline, EI
FHU Reference No. 117009-21
May 2020

Region 4 Lane Closure Strategy, 4
th
Ed.
i
Page i
TABLE OF CONTENTS
Page
I. INTRODUCTION ................................................................................................................... 1
A. Purpose and Use ................................................................................................................................................. 1
B. Summary of Major Changes ............................................................................................................................. 1
C. Strategy Parameters ........................................................................................................................................... 4
D. Technical Report ................................................................................................................................................. 5
E. Analysis Methodology ........................................................................................................................................ 5
II. LANE CLOSURE SCHEDULING AND VARIANCE PROCEDURES ............................... 8
A. Lane Closures for Maintenance Work .......................................................................................................... 8
B. Lane Closures for Design Projects ................................................................................................................. 8
C. Lane Closure Variances – During Construction ......................................................................................... 8
D. Variance Requests .............................................................................................................................................. 8
III. FREEWAY ANALYSIS ......................................................................................................... 13
A. Data Collection and Synthesis ....................................................................................................................... 13
B. Analysis Methodology ...................................................................................................................................... 13
C. Freeway Analysis Results ................................................................................................................................ 15
IV. MULTI-LANE HIGHWAY ANALYSIS ............................................................................... 17
A. Data Collection and Synthesis ....................................................................................................................... 17
B. Analysis Methodology ...................................................................................................................................... 17
C. Multi-Lane Analysis Results ............................................................................................................................ 18
V. TWO-LANE HIGHWAY ANALYSIS ................................................................................. 19
A. Data Collection and Synthesis ....................................................................................................................... 19
B. Capacity Analysis .............................................................................................................................................. 19
C. Analysis Methodology ...................................................................................................................................... 20
D. Two-Lane Analysis Results ............................................................................................................................. 20
VI. ADJUSTMENTS TO ALLOWABLE LANE CLOSURE HOURS ..................................... 21
Appendices
Appendix A. Lane Closure Strategy Use Specifications
Appendix B. Local Noise Ordinances
Appendix C. Spring/Summer Allowable Closure Hours
Appendix D. Fall/Winter Allowable Closure Hours
Appendix E. Dual-Lane Allowable Closure Hours

Region 4 Lane Closure Strategy, 4
th
Ed.
ii
Page ii
List of Figures
Page
Figure 1. CDOT Region 4 Map ................................................................................................................................. 2
Figure 2. Lane Closure Scheduling Decision Tree ................................................................................................ 3
Figure 3. CDOT Maintenance Work Lane Closure Procedure ...................................................................... 10
Figure 4. CDOT Projects During Design Lane Closure Procedure .............................................................. 11
Figure 5. Variance Procedure – During Construction ...................................................................................... 12
Figure 6. Sample Arterial Arrival / Departure Curves ...................................................................................... 16
List of Tables
Page
Table 1. Analysis Seasons and Months ................................................................................................................... 5
Table 2. ATR Day-of-Week Factors ....................................................................................................................... 6
Table 3. Closure Capacity Values for Two-Lane Highways ............................................................................ 19

Region 4 Lane Closure Strategy, 4
th
Ed.
1
Page 1
I. Introduction
A. Purpose and Use
The intent of this Lane Closure Strategy (LCS) is to establish uniform criteria and guidance for
scheduling lane closures in Region 4. Figure 1 shows the Region 4 engineering and maintenances areas
covered by this LCS. The LCS was formulated to strike an appropriate balance between delays to the
traveling public in the work zone and the cost of construction and maintenance. It is applicable to single-
lane closures (and multi-lane closures on six-lane roadways) related to construction and maintenance
activities on roads controlled by the Colorado Department of Transportation (CDOT). It is based on
extensive data analyses and estimates of delays expected during lane closures. The LCS addresses
weekday and weekend traffic demand and considers temporal variations in traffic volume occurring over
a typical 24-hour period. The LCS also accounts for seasonal variations in traffic volumes.
Prior to the completion of the 1
st
Edition of the Region 4 LCS (published in 2009), lane closure decisions
were primarily based on field observations, previous experience, and engineering judgment. Use of the
information presented in this LCS clarifies the lane closure hours that may be more appropriate,
simplifies the decision process for the end user, and reduce the uncertainty associated with handling
traffic during construction.
This LCS is not meant to be a stand-alone document but is intended to be used in concert with all
relevant information available to the decision-maker. For instance, a highway segment may be within the
recommended delay threshold to allow a lane closure, but the use of the route for a special event or
holiday traffic may influence the final selection of a lane closure schedule. At some locations, a noise
ordinance may conflict with lane closure schedules recommended in this LCS. If a potential to generate
noise levels in excess of the limit allowed by the ordinance exists, the project manager may need to seek
a variance.
The Region 4 Traffic Section plans to recalibrate the lane closure schedules presented herein every
three years to reflect changes in traffic volumes and available capacity. This is the 4
th
Edition of the
Region 4 LCS and a full revision will occur again after 3 years.
Figure 2 depicts a decision tree which can be used to locate and schedule a lane closure. Detailed lane
closure schedules for this LCS are found in Appendix C, Appendix D, and Appendix E.
B. Summary of Major Changes
The 4
th
Edition of this LCS incorporates some changes compared to the previous edition, including
changes in strategy parameters and allowable closure hours. The following points summarize major
changes to the LCS in this edition:
Based on conversations with Region 4 Traffic Staff, only a portion of highway segments were
reanalyzed in this edition of the LCS. The highways selected for reanalysis experienced
significant AADT increases, had recent construction altering the roadway geometry, or were
identified as critical highway segments within the Region.
Since the publishing of the previous Region 4 LCS edition, the Highway Capacity Manual (HCM)
has revised the baseline capacity of two-lane highways, which is used in this LCS to determine
allowable closure hours for three-lane highways. Section III.
B reflects this change.
This version of the LCS does not include descriptive closure maps like the previous edition.
Tables in
Appendix C, Appendix D, and Appendix E display allowable closure hours.
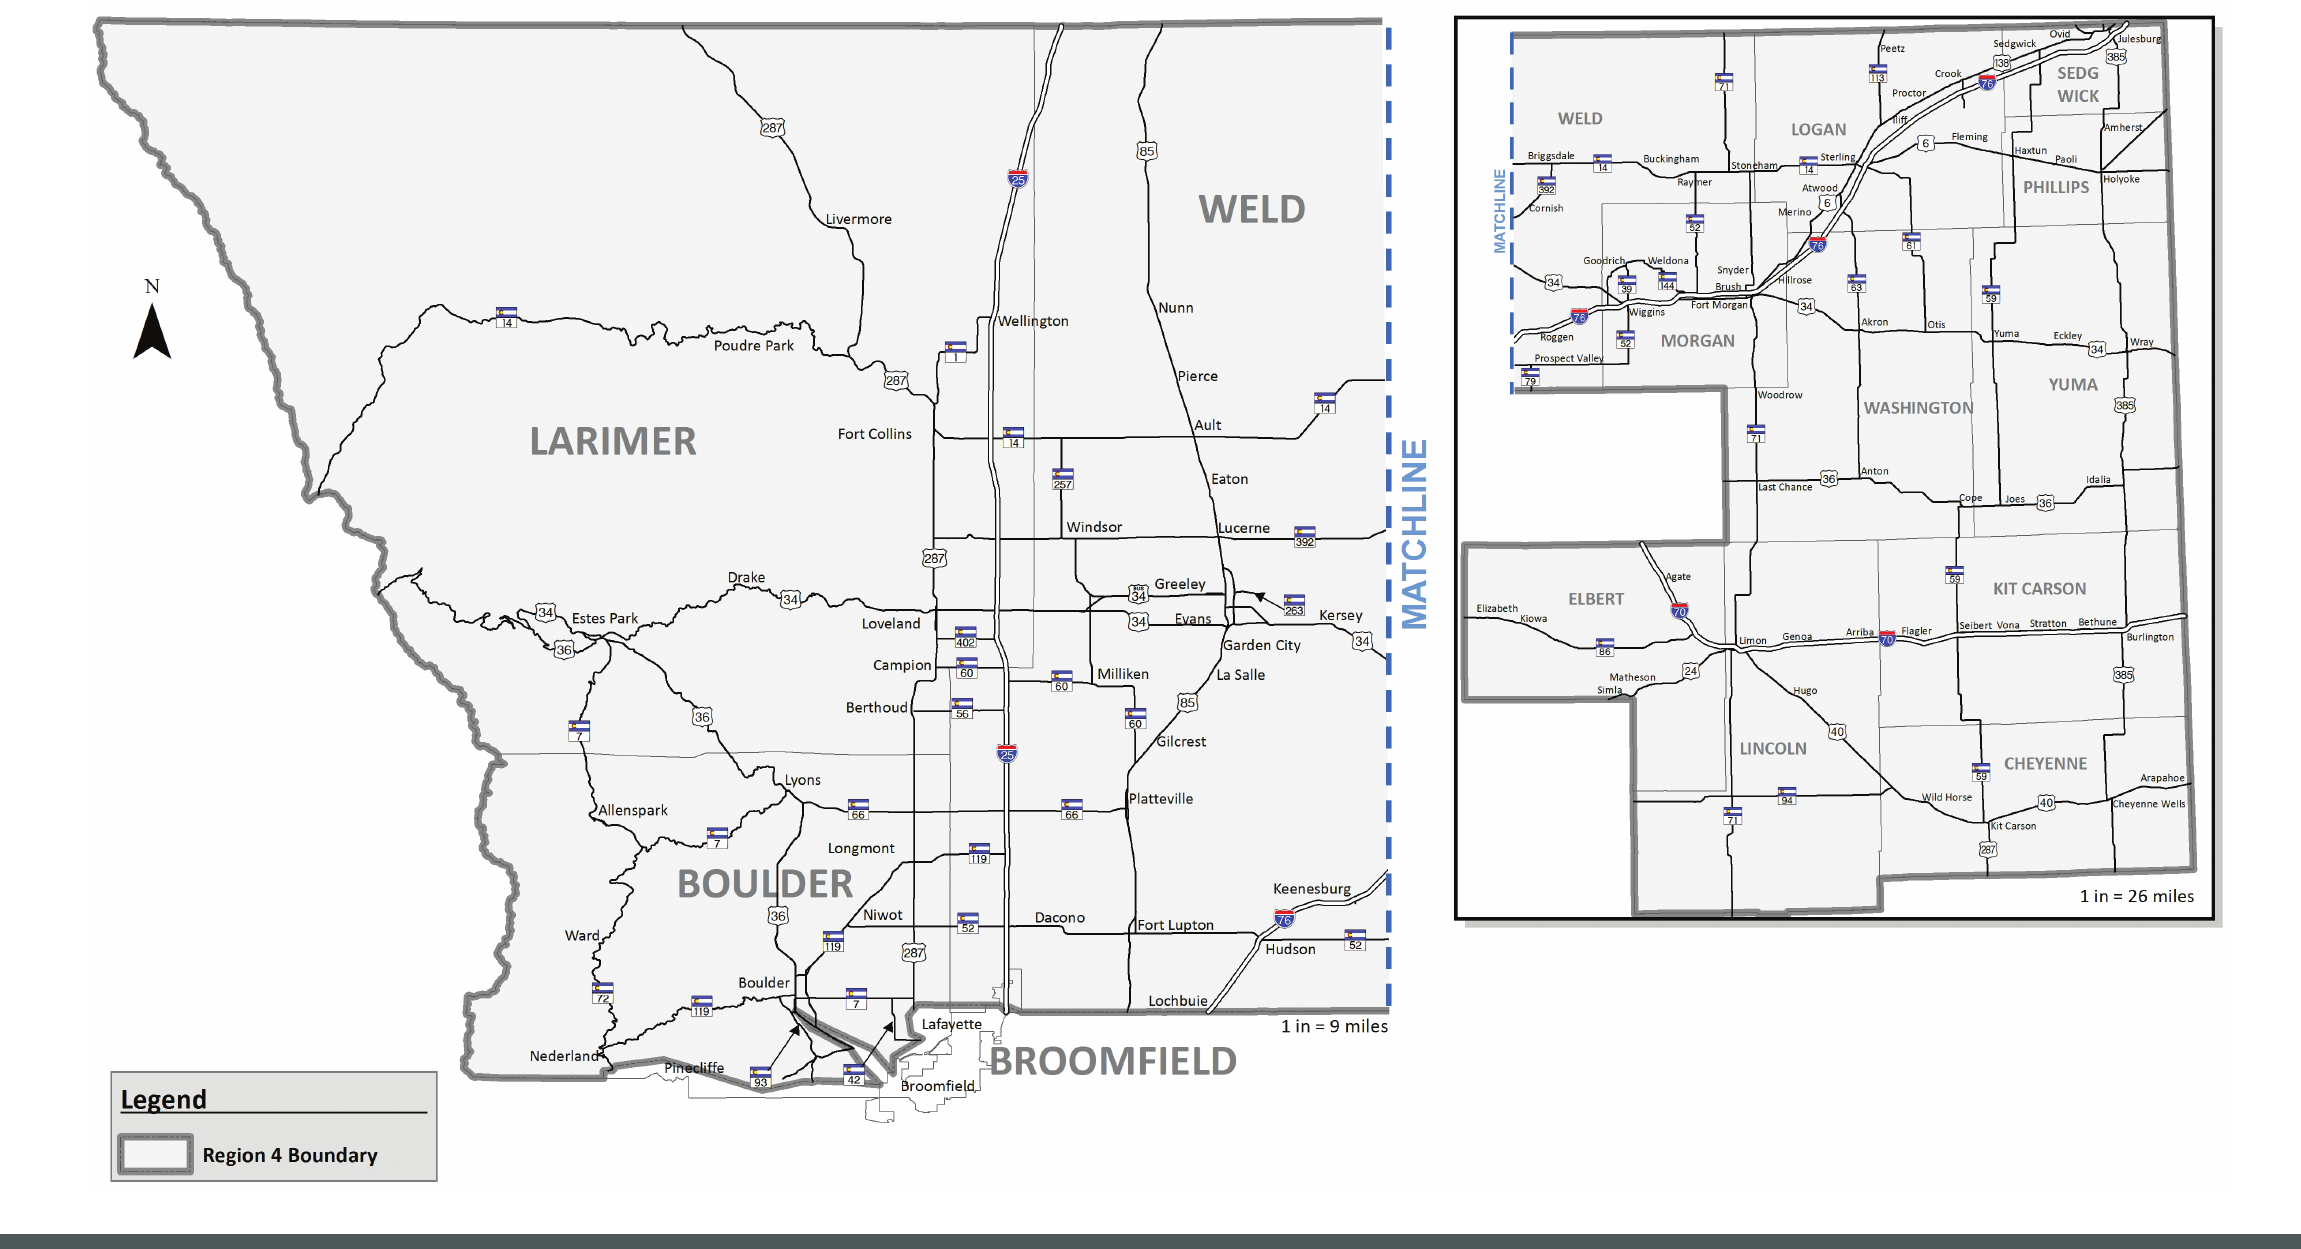
Figure 1
Map of CDOT Region 4
CDOT NPS TO21 R4 LCS Completion 17-009-21 04/15/20

Within the proper appendix, locate the State Highway number, direction and milepoint of the closure.
The lane closu
re schedule will be shown in the corresponding row.
Only along roadways with 3 or more travel lanes in a single direction
2-Lane Closure
Number of Closed Lanes?
1-Lane Closure
Day of Week?
Season?
APPENDIX C APPENDIX D APPENDIX D APPENDIX EAPPENDIX C
Season?
Weekend
Weekday
(Monday-Friday)
Spring/Summer
(April-October)
Fall/Winter
(November-March)
Spring/Summer
(April-October)
Fall/Winter
(November-March)
Figure 2
Lane Closure Scheduling
Decision Tree
CDOT NPS TO21 R4 LCS Completion 17-009-21 05/08/20

Region 4 Lane Closure Strategy, 4
th
Ed.
4
Page 4
Additional highway segment breaks were added to this edition of the LCS to reflect changes to
the roadway geometry and AADT since the last edition.
Reanalysis of traffic volumes was limited to select highways chosen based on AADT and highway
geometry changes with input from CDOT Region 4 stakeholders. The highways chosen for
reanalysis included portions of SH 1, SH 7, SH 14, I-25, US 34, US 36, SH 39, US 40, SH 42,
SH 52, SH 56, SH 60, SH 66, SH 72, US 85, SH 86, SH 93, SH 94, SH 113, SH 119, US 138,
SH 144, SH 157, SH 170, SH 257, US 287, US 385, SH 392, and SH 402.
An additional section was added to this report (Section VI) documenting changes made to the
allowable hours beyond the recommendations provided by the traffic volume analysis.
C. Strategy Parameters
The following parameters are guidelines for the scope and application of this LCS. Appendix A
provides use specifications with respect to special events, emergency situations, and strategy updates.
This LCS is to be used in conjunction with State of Colorado Statutes 42-04-106 and
24-33.5-226 in the implementation of lane closures.
The allowable lane closure hours outlined in this LCS are intended for application during typical
“non-event” traffic conditions. Closures during special events will be governed by the
specification outlined in
Appendix A.
Appendix A also outlines closure notification procedures.
Closures between 11 AM and 10 PM on Fridays and Sundays for all of I-25 and the portion of
State Highway (SH) 119 between Boulder (SH 157) and Longmont (US 287) should have specific
approval from the Region 4 Traffic Operations Engineer or Traffic Engineer.
Closures will not be allowed between 11 AM and 10 PM on Fridays and Sundays during the
Spring/Summer season along the following state highway canyon segments:
SH Description
Beginning
Milepoint #
Ending
Milepoint #
SH 119A Boulder Canyon 22.75 40.93
US 36B Lyons to Estes Park 0.00 20.36
SH 7A St. Vrain Canyon 0.00 33.08
US 34A Big Thompson Canyon 64.23 88.68
SH 14B Poudre Canyon 64.82 121.71
Temporary lane closures necessitated by public safety emergencies supersede the schedules
outlined in this LCS.
Freeway lane closure hours are to be applied to mainline freeway segments only. The freeway
allowed hours are not applicable to interchange ramps or frontage roads.
The allowable lane closure hours on two-lane and three-lane roadways were developed to
account specifically for the presence of trucks in the traffic flow. Allowable lane closure hours
on multi-lane roadways were generally account for the presence of trucks.
The LCS is based on Year 2018 Average Annual Daily Traffic (AADT) volume information from
CDOT’s Online Transportation Information System (OTIS).

Region 4 Lane Closure Strategy, 4
th
Ed.
5
Page 5
The LCS covers weekday and weekend traffic conditions and accounts for temporal variations in
traffic volumes that occur during a typical 24-hour time period.
Local noise ordinances must be considered before implementing lane closures through
municipalities. Known noise ordinances for cities within Region 4 are included in
Appendix B.
When analysis determined that lane closures would be allowed or restricted for only one hour
(generally during mid-day hours), schedules were adjusted to remove any such closures.
Lane closure schedules were developed separately for two seasonal categories: Spring/Summer
and Fall/Winter.
Table 1 depicts the months included in each scheduling category.
Table
1 . Analysis Seasons and Months
Season Months Included
Spring/Summer April, May, June, July, August, September, October
Fall/Winter November, December, January, February, March
D. Technical Report
This report summarizes the underlying methodology and assumptions used to develop the Region 4
LCS. It also establishes guidelines for applying the LCS to situations across the Region. This report
includes allowed closure hours for every state highway facility in the Region except portions that are not
maintained by Region 4, such as US Highway (US) 34A from milepost (MP) 33.33 to MP 57.69 in Rocky
Mountain National Park and US 36B from MP 37.60 to MP 48.00, which is maintained by Region 1.
E. Analysis Methodology
Traffic Information
Region 4 is geographically diverse and covers state highways in the mountainous areas of the Front
Range, the Foothills Cities along the I-25 corridor north of Denver, and the plains north and east of
Greeley to the Wyoming, Nebraska, and Kansas state lines. Traffic data were compiled to provide
information specific to the diverse areas within Region 4.
Through CDOT’s OTIS database, AADT (a 365-day average) volume data are available for all state
highway segments in the Region. AADT information for Year 2018 was used for this 4
th
Edition of the
LCS. CDOT also maintains a system of 28 Automatic Traffic Recorders (ATRs) throughout Region 4 to
monitor traffic continuously. Hourly volumes are available by direction for every day of the year. ATRs
were used to gather data covering the full calendar Year 2018 for the purposes of this LCS.
Data from each of the 28 ATR locations were analyzed to evaluate variation in daily traffic levels over
the course of the calendar year. The data indicated that the months of May through September were
generally uniform relative to the other months of the year for most of the ATR locations. With
consultation from the Region 4 Traffic Section, it was determined that these months would be
categorized as the Spring/Summer Lane Closure season, and the months of April, May and October
were added. The remaining months were categorized as the Fall/Winter season. Day of week variations
were evaluated within these seasonal categories in a similar fashion, and it was determined that the days
of Monday through Thursday would represent the weekday condition. Fridays were not included in the
weekday data compilation because hourly patterns differ from other weekdays, particularly after noon.
The higher of Saturday or Sunday daily traffic would represent the weekend.

Region 4 Lane Closure Strategy, 4
th
Ed.
6
Page 6
Based on these categorizations, four factors were developed for each ATR location. Factors are
multiplied by the AADT volume to calculate the Average Daily Traffic (ADT) volume for a specific
season and day of week. For example, the AADT along US 85 north of Nunn (ATR #215) could be
multiplied by 1.07 to calculate the Summer weekday ADT. This indicates that Summer weekdays carry 7
percent more traffic than the annual average. Table 2 summarizes factors for each ATR location.
Analyses of highways with no ATR location used nearby ATR locations to represent traffic conditions.
Table
2 . ATR Day- of- Week Factors
Highway ATR MP
Spring/Summer Fall/Winter
WD WE WD WE
US 6J 1 439.5 1.10 0.81 1.02 0.70
SH 14C 508 137.9 1.08 0.84 1.07 0.79
SH 14C 7 152.4 1.10 0.78 1.05 0.69
014C 660 234.0 1.13 0.82 1.02 0.71
025A 103 230.5 1.06 0.95 0.96 0.83
025A 16 256.2 1.06 0.99 0.94 0.85
025A 127 272.3 1.09 1.04 0.91 0.80
034A 205 64.9 0.97 1.25 0.49 0.48
034A 245 99.3 1.09 0.85 1.03 0.81
034B 206 257.0 1.17 0.92 0.97 0.70
036B 244 1.5 1.13 1.72 0.76 0.99
036B 4 44.4 1.09 0.86 1.00 0.76
036D 101702 128.3 1.04 1.01 0.90 0.84
040H 13 388.6 1.10 0.92 1.01 0.83
063A 102801 53.1 1.05 0.90 0.99 0.80
070A 14 365.3 1.04 1.18 0.80 0.91
070A 109 438.8 1.06 1.23 0.80 0.91
071D 213 173.3 1.05 0.95 0.92 0.77
076A 10 39.2 1.03 1.14 0.81 0.85
076A 115 128.8 1.04 1.22 0.75 0.82
085C 103694 244.9 1.08 0.86 0.98 0.75
085L 103712 266.9 1.11 0.75 1.02 0.68
085L 215 293.4 1.07 0.88 1.00 0.78
119A 312 21.3 1.04 1.26 0.79 0.83
257A 247 5.4 1.10 0.63 1.08 0.60
287C 256 319.1 1.10 0.86 1.01 0.74
287C 8 352.9 1.04 1.29 0.74 0.81
385C 221 189.4 1.13 0.91 0.98 0.78
Notes: ATR = Automatic Traffic Recorder; MP = Milepost; WD = Weekday; WE = Weekend

Region 4 Lane Closure Strategy, 4
th
Ed.
7
Page 7
Additionally, hourly traffic volume information is available for at least one location on all state highways
in Region 4. This information is primarily weekday counts taken during summer months (May through
September). Some hourly distributions from previous LCS editions were carried over from the
1
st
Edition of the Region 4 LCS. These distributions are now over 10 years old and may not be reflective
of current traffic conditions, especially the timing of peak periods. As a result, hourly volumes were
compiled for all segments that were reanalyzed in this edition in order to determine new hourly
distributions.
Analytical Procedure
Two analytical procedures were developed to evaluate traffic characteristics throughout the system and
to develop appropriate lane closure schedules. Freeways and multi-lane arterials have one set of capacity
and operational characteristics since both directions can operate simultaneously with one lane closed.
Closures are not allowed when and where the average delay per vehicle caused by the closure exceeds
10 minutes. The delay calculations were performed using a spreadsheet implementation of arrival /
departure curves. This process is further described in Section III and Section IV.
The two-lane and three-lane analysis process is based on the length of the closure and capacities for
various closure lengths outlined in the Workzone Traffic Analysis Guide (Oregon Department of
Transportation, February 2005) of the expected capacity of the single lane that is open to traffic. This
process is further described in Section V.
The lane closure tables in Appendix C, Appendix D, and Appendix E present in detail the allowable
closure hours along all roadway segment types in Region 4. The schedules have been developed for each
segment of state highway. Segments have been divided at locations where the roadway narrows or
widens or where traffic volumes change significantly.

VARIANCE PROCESS and
CLOSURE PROCEDURES

Region 4 Lane Closure Strategy, 4
th
Ed.
8
Page 8
II. Lane Closure Scheduling and Variance Procedures
A. Lane Closures for Maintenance Work
Maintenance work efforts along state highways often require lane closures. For such efforts, Figure 3
outlines the procedure for implementing a lane closure.
B. Lane Closures for Design Projects
Allowed lane closure hours are typically outlined in the specifications for CDOT design projects. The
procedure for using the LCS to identify these hours is outlined in Figure 4. The procedure also
includes steps for modifying the closure hours if needed.
Unique circumstances may warrant modification(s) to the basic closure schedule. These unique
circumstances might include, but are not limited to, the following:
Temporary lane closures necessitated by public safety emergencies supersede the hours
outlined in this LCS.
Nighttime temperatures, noise restrictions (based on adjacent land use or town ordinances),
materials supply limitations, etc.
Nature of construction activity, for example, blasting may only be done during daylight hours.
Seasonal or special events
Potential restrictions for oversize vehicles.
A work week is typically considered to be from Sunday at 9 PM to Friday at noon.
C. Lane Closure Variances – During Construction
Upon implementing closure hours, it may be determined that an adjustment in the lane closure schedule
is needed during construction. Figure 5 outlines the procedure for changing the closure hours during
construction. Lane closures may require variances for a variety of reasons. Typical reasons for variance
requests include:
Chip Seals: Due to the short time frame for implementation, the need for higher daytime
temperatures, and the need for higher daytime traffic volumes to compact the product.
Construction/Maintenance Activities: Due to particular techniques and/or projects that
may require more continuous hours of lane closure than are possible given the restricted hours.
Alternate Routes: Due to the availability of multiple alternate routes and/or detours that can
potentially lower traffic volumes and allow for expanded lane closure schedules.
Night-work Restrictions: Due to municipal noise ordinances that restrict night work and/or
the operation of material plants at night.
D. Variance Requests
Variance requests must be submitted to the Region 4 Traffic Section and should, at a minimum, include:
The location and limits of the state highway lane closure.
A reiteration of the restricted hours in the Lane Closure Strategy.
A presentation of the requested change to the restricted hours, specifying the new hours by the
season, day-of-week, and starting and ending time.

Region 4 Lane Closure Strategy, 4
th
Ed.
9
Page 9
A concise statement as to the reason why a variance is being requested.
A technical basis supporting the new allowed hours. Technical information may include:
• Recent traffic counts that show a different daily volume or hourly traffic pattern from the
data used for the Lane Closure Strategy
• Presentation of a traffic control strategy that would make use of alternate traffic routing or
traffic control measures which would soften the impact of the lane closure during the new
allowed hours.
• Cost efficiencies that would result from implementing the new lane closure hours.
The variance request shall take the form of a letter or a memorandum addressed to the CDOT
Region 4 Traffic Operations Engineer. The request may be delivered as a hard copy or as an email
attachment.

NO
Will work effort
Will work effort
r
equi
equir
e closu
e closure
of a lane along a
of a lane along a
State High
State Highw
ay?
ay?
YES
NO
Variances require approval from the Region Traffic Operations
Engineer or Traffic Engineer.
Can
Can w
ork effort
ork effort
be handled within
be handled within
the all
the allow
able
able
closu
closur
e hours?
e hours?
YES
Identify
Work Effort
Consult Lane Closure
Strategy to Identify
allowable lane
closure hours
Proceed with maintenance work effort
Send email notice to
Region 4 Traffic &
Safety that allowable
hours will be followed
Contact
Region 4 Traffic
& Safety
for approval
Figure 3
CDOT Access Permit Projects
and Maintenance Work
Lane Closure Procedure
(Not applicable to emergency roadway maintenance situations)
CDOT NPS TO21 R4 LCS Completion 17-009-21 03/27/20
CDOT NPS TO12 LCS Completion 17-009-12 12/06/18

NO
Will the construction
Will the construction
effort
effort r
equi
equir
e closu
e closur
e of a lane
e of a lane
along a State High
along a State Highw
ay?
ay?
YES
NO
Is a
Is a v
ariance
ariance
desi
desir
ed to inc
ed to incr
ease
ease
all
allow
able
able
closu
closur
e times?
e times?
NO
YES
Region 4
Region 4
Traffic &
Traffic &
Safety
Safety
approve?
approve?
YES
Variances require approval from the Region Traffic
Operations Engineer or Traffic Engineer.
Complete Preliminary Design
& Submit F.I.R. Plan Set
Consult Lane Closure
Strategy to Identify Allowable
Lane Closure Hours
Hold F.I.R. Meeting &
Compile F.I.R. Comments
Consult Lane Closure
Strategy to Identify
allowable lane closure hours
Incorporate F.I.R. Comments
& Develop F.O.R. Plan Set
Finalize Construction
Documents
Identify allowable lane
closure hours in
Project Specifications
Enter Design
Variance
Procedure
(below)
Indicate desired
schedule to
Region 4 Traffic
& Safety
Representative
Adjust schedule
to reflect
requested hours
(monitor queues and delays
upon implementing)
Modify desired
schedule
Figure 4
CDOT Projects
During Design
Lane Closure Procedure
Variance Procedure -
During Design
CDOT NPS TO21 R4 LCS Completion 17-009-21 03/27/20

Is a variance
desired to increase
allowable
closure times?
Region 4
Traffic &
Safety
approve?
Does
exceed 1 mile
or
exceed 30 minutes?
NO
YES
NO
YES NO
YES
Is
additional
closure
time
desired?
NO
YES
Variances along freeways require approval from the
Region Traffic Operations Engineer or Traffic Engineer.
Variances along other state highways require approval from
the Region 4 Traffic and Local Agency Resident Engineer.
1
3
Initiate lane closure
during times allowed by
Lane Closure Strategy
Modify
desired
schedule
Continue to
operate with
allowable hours
per Lane Closure
Strategy
Indicate desired schedule
to Region 4 Traffic &
Safety
Implement desired lane closure hours. During
closure, conduct the following measurements
using a pilot car every 1/2 hour:
Re-open lanes and
revert to allowable
times per Lane
Closure Strategy
Adjust schedule
to reflect
requested hours
and continue to
monitor queue
and delay
File report with Region 4
Traffic & Safety
documenting hours
proposed and results
of measurements
Figure 5
Variance Procedure - During Construction
Distance (in miles) from back end of queued
vehicles to beginning of lane closure
Time spent in the queue (in minutes)
Calculate delay =
-{[60 * ]÷[posted speed]}
CDOT NPS TO21 R4 LCS Completion 17-009-21 05/08/20
1
2
3
2 1

Region 4 Lane Closure Strategy, 4
th
Ed.
13
Page 13
III. Freeway Analysis
Significant portions of Interstates 25, 70, and 76 form freeway segments within Region 4. All freeways
are four or more lanes wide and are divided highways with controlled access and grade separated
interchanges only. The freeway analysis methodology was developed to address closure conditions
unique to these roadways.
A. Data Collection and Synthesis
Traffic data for I-25, I-70, and I-76 were gathered from ATR information as well as individual spot counts
from the CDOT OTIS database. As shown in Table 2, CDOT maintains three ATR locations on I-25,
two locations on I-70, and two on I-76. ATR data was used to develop seasonal and day-of-week factors,
while spot counts provided segment AADT, truck volumes, and hourly distributions. All these tools
were used to calculate hourly traffic volumes for each freeway segment.
B. Analysis Methodology
Delay Threshold
The approach used to determine appropriate lane closure schedules for freeway segments consisted of
comparing traffic demand with roadway capacity. The closure of a lane on a freeway segment reduces
roadway capacity and can create a bottleneck for traffic. To determine when a lane closure along a
freeway segment would be appropriate, it is necessary to determine times of day at which a lane closure
would reduce the roadway capacity to a point where demand would exceed capacity, creating a
bottleneck and causing delay to vehicles. Times during which the implementation of a lane closure
induced an average vehicle delay in excess of 10 minutes for the duration of the bottleneck are
eliminated as potential closure times. For these analyses, delay was defined as the increase in travel time
encountered during a lane closure compared to the estimated travel time during free-flow conditions.
The average delay value of 10 minutes per vehicle was selected as a suitable delay threshold based on a
review of prevalent practices around the country and internal discussions within CDOT. An average
delay value of 10 minutes per vehicle provides an appropriate balance between delays to the traveling
public and the cost of construction and maintenance.
Lane closures implemented in accordance with the allowable hours included in this strategy are
anticipated to cause delay for drivers. The effects of this delay, however, would be softened by the
availability of alternate routes and detours to get around the closed portion of roadway. By including
delay tolerances in these calculations, the restricted hours in the LCS account for the presence of
alternate routes and detours.
Capacity Values
The closure of a lane along a freeway segment causes a reduction in roadway capacity. In order to
determine when a lane closure along a mainline freeway segment would be appropriate, it is necessary
to determine times of day at which a lane closure would reduce the roadway capacity to a point where
closure delay exceeds 10 minutes. A lane closure would not be allowed during such times. When
adequate capacity to accommodate demand exists even with the closure of a lane, a lane closure is
allowed.
Typical freeway lane capacity varies between approximately 1,800 vehicles per hour per lane (vphpl) and
2,300 vphpl. Mainline freeway traffic volumes recorded in the Denver area have indicated that lane
capacity can be as high as 2,500 vphpl. The introduction of a lane closure to a mainline freeway segment

Region 4 Lane Closure Strategy, 4
th
Ed.
14
Page 14
would be expected to reduce this typical capacity by distracting drivers and shifting lane alignments,
among other factors. Research conducted by Krammes and Lopez (Transportation Research Record
1442, 1994 pp. 49-56) cited in the Highway Capacity Manual 2010 (HCM 2010) (2010 Edition,
Transportation Research Board, p. 10-26) indicates that the per-lane capacity of a freeway facility is
reduced when a lane closure is initiated. In the research, several freeway lane closure locations were
studied to evaluate the capacity under closed conditions. It was found that, on average, the capacity of a
mainline freeway segment with a lane closed is 1,600 vphpl.
Studies by the California Department of Transportation (CalTrans) and CDOT Region 2 indicate that
freeway capacity during a lane closure depends upon the type of work being completed. Paving and
milling operations have a much lower capacity than other types of construction activities. To develop
conservative allowed closure hours for this Strategy, a lane closure scenario was analyzed for freeways
based on a paving operation. The lane closure capacity of a mainline freeway facility is 1,100 vphpl when
performing paving or milling operations. A delay threshold of 10 minutes was used for freeway
segments. If the average delay with a lane closure exceeded this threshold a lane closure would not be
allowed during that time period. The hourly traffic volumes along each section of mainline freeway were
compared by direction with the estimated lane-closed capacity to determine an appropriate schedule for
lane closures.
Sequential freeway segments with identical characteristics, such as number of lanes, grade, and direction,
should all have the same capacity, even though they may serve different traffic volumes. In these
instances, the capacity of all the sequential segments is dictated by the segment that has the highest
counted hourly volume.
Freeway Analysis
A spreadsheet implementation of arrival / departure curves was formulated to automate the calculation
of average delay induced by a lane closure along each multi-lane highway section. The spreadsheet
enables the user to choose lane closure schedules with average delay values less than 10 based on
calculated hourly traffic volumes. Initial closure schedules were selected that have the fewest restricted
hours while providing the smallest average delay during closure. Additional adjustments were made to
these schedules to provide at least two consecutive hours of closure or restriction. This allows
meaningful construction/maintenance activity to be completed or excess vehicle queues to clear.
Transportation Engineering literature documents the use of arrival and departure curves to calculate
vehicle delays and queues. The methodology outlined in the book Fundamentals of Traffic Engineering
(May 1990, pp. 346-349) uses a plot depicting cumulative vehicle arrivals at and departures from a given
location over the course of 24 hours. For this analysis, the 24-hour traffic count information was used to
plot cumulative arrivals, and the roadway vehicle capacities discussed previously were used to formulate
cumulative departure curves.
Figure 6 provides a sample plot of arrivals and departures. This plot corresponds to a particular
direction of a state highway segment between the hours of 8:00 AM and 2:00 PM on a typical weekday.
The curves become separated when the demand/arrival rate, represented by the blue curve, exceeds
capacity, creating over-saturated conditions. The departure rate, represented by the red curve, is
reduced to the capacity of the partially closed highway between 9:00 AM and 12:00 PM. The curves
reconnect when capacity is sufficient to meet the demand. This can occur if the vehicle arrival rate
decreases (demand is reduced) or if the capacity of the highway increases (the closed lane is reopened).
In the sample plot shown on Figure 6, this occurs at 1:00 PM.

Region 4 Lane Closure Strategy, 4
th
Ed.
15
Page 15
At any point, the delay of an individual vehicle can be identified graphically as the horizontal distance
between the arrival (blue) and departure (red) curves. As shown on Figure 6, the number of vehicles
that experience delay is represented by the vertical distance between the curves. The shaded area
between the curves is the total delay in vehicle-hours. The average delay can be calculated by dividing
this area by the number of vehicles serviced during the period of over-saturation. The delay is averaged
for the total time during which over-saturated conditions persist as a result of the lane closure. An
average delay is calculated for each over-saturated period. If this average delay remains below 10
minutes, the closure is allowed. As shown on Figure 6, the calculated delay resulting from the sample
case is 6 minutes per vehicle.
C. Freeway A nalysis Results
The lane closure schedule tables in Appendix C, Appendix D, and Appendix E present, in detail,
allowable closure hours for all freeway segments in Region 4. Freeway segments have been divided at
interchanges where significant AADT changes occur or where lane geometry changes.

Figure 6
Sample Arrival/Departure Curves
CDOT NPS TO21 R4 LCS Completion 17-009-21 03/24/20CDOT NPS TO21 R4 LCS Completion 17-009-21 03/27/20
Example State Highway Arrivals and Departures
22400
23000
23600
24200
24800
25400
26000
7:00 PM 8:00 PM 9:00 PM 10:00 PM
End of Hour
Cumulative # Vehicles
Arrivals
Departures
Average Delay =
Shaded Area / No. of Vehicles Delayed =
3.0 minutes / vehicle
Maximum
Vehicle Delay (hr.)
Shaded Area = Total Delay
(veh.-hrs.)
Maximum
Queue Length (veh.)

Region 4 Lane Closure Strategy, 4
th
Ed.
17
Page 17
IV. Multi-Lane Highway Analysis
The multi-lane analysis methodology was developed to create lane closure schedules for state highway
segments within the Region that consist of three or more lanes. Roads maintained by CDOT Region 4
include approximately 540 miles of multi-lane arterial segments. US Highways 6, 34, 36, 85, and 287, and
385 sections and State Highways 1, 7, 14, 52, 66, 71, 86, 93, 119, 138, 157, 170, 257, and 392 include
multi-lane arterial sections.
A. Data Collection and Synthesis
Traffic data for multi-lane arterial facilities in Region 4 were gathered from ATR information as well as
individual spot counts from the CDOT OTIS database. The ATR data was used to develop seasonal and
day-of-week factors, while spot counts provided segment AADT, truck volumes, and hourly
distributions. All these tools were used to calculate hourly traffic volumes for each multi-lane arterial
highway segment.
Some segments did not have ATR locations to determine seasonal and day-of-week factors. Data from a
nearby ATR was used as a representative.
Weekend hourly counts were only provided at ATR locations. Segments without ATRs were assigned
to nearby ATRs to determine a weekend hourly distribution.
B. Analysis Methodology
Delay Threshold
As with the Freeway Analysis procedure, the closure of a lane on a multi-lane highway segment reduces
roadway capacity and can create a bottleneck for traffic. To determine when a lane closure along a
multi-lane highway segment would be appropriate, it is necessary to determine times of day at which a
lane closure would reduce the roadway capacity to a point where demand would exceed capacity,
creating a bottleneck and causing delay to vehicles. Times during which the implementation of a lane
closure induced an average vehicle delay in excess of 10 minutes for the duration of the bottleneck are
eliminated as potential closure times. For these analyses, delay was defined as the increase in travel time
encountered during a lane closure compared to the estimated travel time during free-flow conditions.
The average delay value of 10 minutes per vehicle was selected as a suitable delay threshold based on a
review of prevalent practices around the country and internal discussions within CDOT. An average
delay value of 10 minutes per vehicle provides an appropriate balance between delays to the traveling
public and the cost of construction and maintenance.
Lane closures implemented in accordance with the allowable hours included in this strategy are
anticipated to cause delay for drivers. The effects of this delay, however, would be softened by the
availability of alternate routes and detours to get around the closed portion of roadway. By including
delay tolerances in these calculations, the restricted hours in the LCS account for the presence of
alternate routes and detours.
Capacity Values
To calculate the delay caused by a closure-induced bottleneck, it is necessary to determine a capacity
value for each multi-lane highway section or group of sections being analyzed. Many factors influence the
per-lane capacity of a multi-lane highway, including the composition of vehicular traffic and the green
time allocated to the highway at signalized intersections.

Region 4 Lane Closure Strategy, 4
th
Ed.
18
Page 18
According to the HCM, the “ideal saturation flow rate” for an arterial facility is 1,900 passenger cars per
hour per lane (pcphpl). Research conducted by the Denver Regional Council of Governments on
saturation flow rates throughout the Denver metropolitan area concludes that 1,900 pcphpl is an
appropriate value for multi-lane highways under typical operating conditions and can also be used for
multi-lane highways in other parts of the state. This ideal flow rate is reduced to account for factors
such as the presence of heavy vehicles in the traffic stream and signalized intersections. Accounting for
these factors, the HCM estimates that the capacity of a typical arterial facility is 850 vphpl (vehicles per
hour per lane). Therefore, an estimated capacity of 850 vphpl was used as a baseline capacity assumption
for the development of this LCS.
This capacity, however, was adjusted upward in some cases to account for locations where the state
highway facility is given a greater than typical allocation of green time. Such a condition is reflected in the
traffic count information when the counted traffic volume at a given location exceeds 850 vphpl. At
locations where the actual counted traffic volume exceeded 850 vphpl, the capacity value was adjusted
upward to reflect the counted traffic volume.
Sequential multi-lane highway segments with identical characteristics, such as number of lanes, grade,
and direction, should all have the same capacity, even though they may serve different traffic volumes. In
these instances, the capacity of all the sequential segments is dictated by the segment that has the
highest counted hourly volume.
Four- Plus- Lane Highway Analysis
As with the freeway closure analyses, a spreadsheet implementation of arrival / departure curves was
formulated to automate the calculation of average delay induced by a lane closure along each arterial
section. The spreadsheet enables the user to choose lane closure schedules with average delay values
less than 10 based on calculated hourly traffic volumes. Initial closure schedules were selected that have
the fewest restricted hours while providing the smallest average delay during closure. Additional
adjustments were made to these schedules to provide at least two hours consecutive hours of closure
or restriction. This allows meaningful construction/maintenance activity to be completed or excess
vehicle queues to clear.
Three- Lane Highway Analysis
A lane closure along a three-lane roadway segment creates a two-lane operating condition. This
condition was analyzed along each three-lane segment in Region 5 to develop restricted closure hours
along three-lane segments. A capacity was estimated for each based on a two-lane highway analysis
methodology summarized in the HCM – approximately 3,200 passenger cars per hour. The capacity was
established as the traffic volume threshold between Level of Service (LOS) E and LOS F and was
reduced to account for driver rubbernecking passing the work zone to 70 percent of the base capacity,
or about 2,200 passenger cars per hour. Rather than using delay thresholds, closures on three-lane
facilities are allowed simply when the combined hourly volume in both directions is less than the
reduced capacity of the highway segment.
C. Multi- Lane Analysis Results
The lane closure schedule tables in Appendix C, Appendix D, and Appendix E present, in detail,
allowable closure hours for all multi-lane highway segments in Region 4. Highway segments have been
divided at intersections with significant AADT changes or locations where lane geometry changes.

Region 4 Lane Closure Strategy, 4
th
Ed.
19
Page 19
V. Two-Lane Highway Analysis
A. Data Collection and Synthesis
As with freeways and multi-lane highways, traffic data for two-lane roadways in Region 4 were gathered
from ATR information as well as individual spot counts from the CDOT OTIS database. ATR data was
used to develop seasonal and day-of-week factors, while spot counts provided segment AADT, truck
volumes, and hourly distributions. All these tools were used to calculate hourly traffic volumes for each
two-lane highway segment.
Some two-lane highways did not have ATR locations available along them to determine seasonal and
day-of-week factors. Data from a nearby ATR was used to represent conditions at such locations.
Weekend hourly counts were only provided at ATR locations. Segments without ATRs were assigned
to nearby ATRs to determine a weekend hourly distribution.
B. Capacity Analysis
Patterns of Operations
Lane closures on two-lane facilities are unique in that only one lane is available to handle traffic. This
generally means flaggers must be used at each end of the closure to alternate the direction of traffic. The
capacity of the detour is related to the length of the closure. A longer detour will have less capacity
because traffic in each direction takes longer to clear the work zone. Based on discussions with Region 4
Traffic Staff, it was confirmed that three typical work zone lengths would be analyzed: less than 0.5-mile,
1.0- mile, and 3.0-mile.
Capacity Values
The two-lane analysis is based on capacities for various closure lengths outlined in the Workzone Traffic
Analysis Guide (Oregon Department of Transportation, February 2005). This document identifies hourly
capacities of one-lane, bi-directional sections with flagger control. Capacities are calibrated for closure
lengths 3.0 miles, 1.0 mile, and 0.5 mile. A conversation with ODOT Staff responsible for developing the
capacities indicated that a capacity for 0.5-mile closures was developed after the document was
published. Table 3 summarizes capacity values adapted from the Oregon DOT information for use in
the LCS.
Table
3 . Closure Capacity Values for Two- Lane Highways
Calibrated Closure
Length
Applicable
Closure Lengths
Hourly Capacity
(Passenger-Car-Equivalents per Hour)
3.0 miles
†
> 1.0 mile 400 PCE/hr
1.0 mile > 0.5 mile to 1.0 mile 750 PCE/hr
0.5 mile ≤ 0.5 mile 900 PCE/hr
†
Value not provided by Oregon DOT information; based on a linear extrapolation from provided capacities.
The ODOT capacity values were developed based on a series of technical calculations supported by
field observations conducted at construction sites. These values have a significant basis in actual field
experience in combination with technical calculations. Comprehensive field evaluations have not been
performed for such closures in Colorado, but Region 4 Traffic Section Staff indicated that field

Region 4 Lane Closure Strategy, 4
th
Ed.
20
Page 20
experience with flagging operations on Colorado projects supported capacity values similar to the
ODOT values.
Providing the capacity values in Passenger Car Equivalents (PCE) allowed the specific inclusion of truck
percentages in lane closure schedule calculations. Based on information in the HCM, a PCE of 1.5 or 2.5
was assigned to each 2-lane highway in Region 4. The higher PCE of 2.5 was assigned to segments
carrying and AADT of more than 5,000 vehicles per day and/or at least 10 percent trucks, which
comprises the majority of 2-lane segments within the west portion of Region 4.
The PCE of 1.5 was assigned to 2-lane highways carrying below 5,000 vehicles per day and less than 10
percent trucks. Oregon DOT guidance states that higher PCE values are appropriate for roadways
carrying higher truck percentages and/or roadways on hilly terrain.
C. Analysis Methodology
To identify allowable lane closure hours on two-lane highways, hourly PCE volumes were determined
for each highway segment and compared to the hourly capacity for each closure length category. A
spreadsheet implementation of 0.5-mile, 1.0-mile, and 3.0-mile closure capacities was formulated to
automate the calculation of hourly capacities. The spreadsheet enables the user to input an hourly
distribution of traffic and compare the resulting hourly volumes to the allowable capacity. Each hour is
then evaluated (yes or no) whether it is appropriate for closure. This procedure was followed for both
weekday and weekend volumes in Spring/Summer and Fall/Winter seasons. The result of the calculations
can indicate that specific times should be restricted from lane closures or that no restrictions are
applicable.
D. Two-Lane Analysis Results
The lane closure schedule tables in Appendix C, Appendix D, and Appendix E present, in detail,
allowable closure hours for all two-lane highway segments in Region 4. Highway segments have been
divided at locations where significant AADT changes occur or where lane geometry changes.
Sections were divided where lane geometry changes or daily traffic volumes change significantly. It is
important to note that some sections are shorter than the closure lengths of 0.5, 1.0, and 3.0 miles.
When proposed lane closures will overlap such sections, it is recommended that the segment with the
fewest hours available for closure be implemented.

Region 4 Lane Closure Strategy, 4
th
Ed.
21
Page 21
VI. Adjustments to Allowable Lane Closure Hours
Per the request of Region 4 Staff and based on review comments received from CDOT and local agency
representatives, some allowed closure hours were manually adjusted to reflect particular conditions and
ensure consistency. Adjustments made included allowing or disallowing closures during particular time
periods or closure lengths. These adjustments included:
All lane closures along I-25 south of the Mountain Vista Drive Interchange should be allowed at
night only, beginning no earlier than 9 PM and ending no later than 5 AM.
Closures along the Diagonal Highway (SH 119 between Boulder and Longmont) and SH 157
should only be allowed during non-peak hours.
All lane closures along US 287 through Old Town Fort Collins (Laurel Ave to Mountain Ave)
should be allowed at night only, beginning no earlier than 9 PM and ending no later than 5 AM.
All state highways in Estes Park should only be closed at night during the Spring/Summer season.
All state highways within Greeley, Loveland, Longmont, and Boulder should only be closed
during non-peak hours during the Spring/Summer season.

APPENDIX A
STRATEGY USE SPECIFICATIONS

Region 4 Lane Closure Strategy, 4
th
Ed.
Page A- 1
APPENDIX A. LANE CLOSURE STRATEGY
USE SPECIFICATIONS
Closure Implementation Process
The following steps should be followed to analyze, communicate, and document a proposed lane
closure:
Step 1: Review closure tabulation (Appendix C, Appendix D, and Appendix E) to determine the
appropriate allowable closure hours.
Step 2: Analyze a specific closure that is necessary to determine if there are any unique circumstances
that will warrant modification(s) to the basic closure schedule. These circumstances may include, but are
not limited to:
Temporary lane closures necessitated by public safety emergencies which supersede the
allowable hours identified in this LCS
Night-time temperatures, noise restrictions (based on adjacent land use or city/town ordinances
included in
Appendix B), material supply limitations, etc.
Nature of required construction (i.e., blasting work may be completed only during daylight
hours)
Special or seasonal events
Potential restrictions for oversize vehicles
Any variances from the basic closure schedule will first require approval from the Region Traffic
Operations Engineer. Closures over multiple highway segments within a single project should be
reviewed and a uniform closure time should be implemented. All modifications to the basic closure
schedule must be documented.
Step 3: Notify the Region Traffic Operations Engineer or Traffic Engineer of the closure and any
requests for variance.
Based on the extent and duration of the proposed closure, additional notifications should be considered.
Information may be distributed to:
CDOT Public Relations Office
Statewide Traffic Operations Center (TOC) for possible display on permanent Variable Message
Signs (VMS) located upstream of the closure
Local media outlets (including newspapers, radio and television stations, etc.)
Emergency response agencies (State Patrol, Sheriff’s Office, Fire, Paramedics)
Step 4: Place closure documentation in the project file.

Region 4 Lane Closure Strategy, 4
th
Ed.
Page A- 2
Special Events
The occurrence of special events will affect traffic conditions along state highway facilities. The lane
allowable lane closure schedules outlined in this LCS are not intended to apply to special event traffic
control. When the schedule for a special event is known, construction- or maintenance-related lane
closures should not be scheduled from two hours before the event until one hour after the event.
Variance Requests
Figure 3 and Figure 4 document the process for requesting a variance from the hours allowed in this
LCS.
Emergency Situations
This LCS is intended for application to planned lane closures, not lane closures necessitated by public
safety emergencies. Temporary lane closures required in emergency situations are permitted at all
times.
Updates to the Strategy
To account for future changes in traffic volumes and patterns, the LCS should be updated every three
years. This 4
th
Edition of the LCS is based on Year 2018 traffic volumes and was completed in 2020.
Therefore, the next update will occur in 2023.

APPENDIX B
LOCAL NOISE ORDINANCES

R
egion 4 Lane Closure Strategy, 4
th
Ed.
Appendix B
APPENDIX B. LOCAL NOISE ORDINANCES
CITY OF BOULDER
NOISE INFORMATION

5/12/2020 Boulder, CO Municipal Code
(a)
(1)
(2)
(3)
(b)
(1)
5-9-3. - Exceeding Decibel Sound Levels Prohibited.
No person shall:
Operate any type of vehicle, machine, or device;
Carry on any activity; or
Promote or facilitate the carrying on of any
activity, which makes sound in excess of the level
specified in this section.
Sound from any source, other than a moving vehicular
source located within the public right of way, shall not
exceed any of the following limits for its appropriate
zone:
The sound limits prescribed by this section are set
forth in the following table for the zoning district
within the following use classifications in
Section
9-5-2, "Zoning Districts," B.R.C. 1981:
Zoning District of
the Property on
Which the Sound
is Received
Maximum
Number of
Decibels
Permitted from 7
a.m. until 11 p.m.
of the Same Day
Maximum
Number of
Decibels
Permitted from
11 p.m. until 7
a.m. of the
Following Day
Boulder-1

5/12/2020 Boulder, CO Municipal Code
(2)
(A)
(B)
(C)
(3)
(A)
Residential 55 dBA 50 dBA
Mixed use and
other
65 dBA 60 dBA
Industrial 80 dBA 75 dBA
Sound from construction work for which a
building permit has been issued:
During the hours of 7 a.m. to 5 p.m., sound
for work of any type shall be deemed
received in an industrial zoning district;
During the hours of 5 p.m. until 9 p.m.,
sound from light construction work received
in a residential zone shall be deemed
received in a commercial zoning district; and
Under no circumstances shall amplified
sound be considered as construction work
activity.
Sound from a source regulated by this subsection:
Sound from a source on private property
shall be measured at or inside the property
Boulder-2

5/12/2020 Boulder, CO Municipal Code
(B)
(C)
(c)
(d)
(1)
line of property other than that on which the
sound source is located;
Sound from a source on public property may
be measured on that receiving property so
long as the measurement is taken at least
twenty-five feet from the source, or it may be
measured at or inside the property line of
receiving property other than the public
property on which the sound source is
located;
For the purposes of this paragraph, a
leasehold shall be deemed a property of the
lessee, and its boundary, other than a
boundary with adjacent property owned by
the lessee, shall be deemed a property line.
All sound measurements shall be made on a sound
level meter that meets ANSI specification S1.4-1974 for
Type I or Type II equipment. The manufacturer's
published indication of compliance with such
specifications is prima facie evidence of compliance
with this subsection.
It shall be a defense to a charge of violating this section
that:
The sound was made by an authorized emergency
vehicle when responding to an emergency or as
Boulder-3

5/12/2020 Boulder, CO Municipal Code
(2)
(3)
(4)
(5)
(6)
(7)
otherwise authorized by law or acting in time of
emergency or by an emergency warning device
operated by a government;
The sound was made by the sounding of the horn
of any vehicle as a danger warning signal or by the
sounding of any warning device as required by
law;
The sound was made within the terms of a
fireworks display or temporary street closure
permit issued by the city manager, or was made
by the rendering of military honors at a funeral by
a military funeral honors detail;
The sound was made by an animal;
The sound was made within the terms and
conditions of a sound level variance granted by
the city manager;
The sound was made on property belonging to or
leased or managed by a federal, state, or county
governmental body other than the city and made
by an activity of the governmental body or by
others pursuant to a contract, lease, or permit
granted by such governmental body;
The sound was made by a police alarm device, if
the police alarm shuts off automatically after no
longer than ten minutes, by a fire alarm, or by an
[24]
Boulder-4

5/12/2020 Boulder, CO Municipal Code
(8)
(9)
(e)
alarm system installed in a motor vehicle, if the car
alarm shuts off automatically after no longer than
five minutes;
The sound was made by snow removal equipment
equipped with a standard muffling system in good
repair while removing snow; or
The sound was made between the hours of 7 a.m.
and 9 p.m. by a lawn mower or gardening
equipment equipped with a standard muffling
system in good repair.
This section shall not be construed to conflict with the
right of any person to maintain an action in equity to
abate a noise nuisance under the laws of the state.
Ordinance Nos. 7522 (2007); 7831 (2012); 7965 (2014)
Footnotes:
--- (24) ---
Animal noises are covered in chapter 6-1, "Animals," B.R.C. 1981.
Boulder-5
CITY OF BROOMFIELD
NOISE INFORMATION

5/12/2020 Broomfield, CO Municipal Code
(A)
(B)
(C)
(D)
(E)
(F)
9-36-010 - Denitions.
In this chapter, unless the context otherwise requires, the following words and
phrases have the meanings indicated:
Continuous noise
means a steady, fluctuating, or impulsive noise
which exists, essentially without interruption, for a period of ten
minutes or more.
dB(A)
is the standard notation for the sound pressure level as
measured with a sound level meter using the A-weighting network.
Decibel
or
dB
means a unit for measuring the volume of a sound,
equal to twenty times the logarithm to the base ten of the ratio of
the pressure of the sound measured to the reference pressure,
which is twenty micropascals (twenty micronewtons per square
meter).
Domestic power equipment
means any power equipment rated five
horsepower or less used for home or building repair or grounds
maintenance including, but not limited to, lawn mowers, garden
tools, snow blowers, and chain saws.
Impulsive noise
means a noise of short duration usually less than
one second, with an abrupt onset and rapid decay.
Industrial use
means any industrial use that must be permitted as a
use by special review in an I-2 or I-3 zone district. Industrial use
includes cement, concrete, lime, or gypsum manufacturing;
chemical plants; fertilizer manufacturing, manufacturing, assembly,
packaging, processing, storage, and distribution of raw vegetable
and animal products; manufacturing or storage of hazardous
materials, the development or operation of oil wells or gas wells,
recycling centers, temporary outdoor storage of rubbish, refuse,
waste, junk vehicles, or workshops.
Broomfield-1

5/12/2020 Broomfield, CO Municipal Code
(G)
(H)
(I)
(J)
(A)
(B)
(1)
(2)
(3)
Muffler
means an apparatus consisting of a series of chambers or baff
designed for the purpose of transmitting gases while reducing sound e
from such apparatus.
Periodic noise
means a noise recurring at fixed intervals for a
period of ten minutes or more.
Public place
means any street, parking lot, city park, or sidewalk
adjoining a city park; any private property open to or used by the
general public for travel or parking; or any place used by persons
other than the owner or owner's agent without a special permit.
Sound
means an oscillation in pressure, stress, particle
displacement, and particle velocity which induce auditory sensation.
(Ord. 862 §1, 1989;
Ord. No. 2117 , § 3, 1-14-20)
9-36-020 - Noise prohibited.
It shall be unlawful for any person to make, or cause to be made, any
continuous, impulsive, or periodic noise within the city which:
Is of such unusual or exceptional character, intensity, or duration
that it disturbs, injures, or endangers the comfort, repose, health,
peace, or safety of any person or causes damage to any property;
or
Exceeds the levels shown on schedule 9-36A below:
These levels are based on the district in which the sound is
measured or perceived, regardless of the district in which the
sound originates.
Sound shall be measured at least twenty-five feet from the
source.
In any event, measurements may not be taken from property
Broomfield-2

5/12/2020 Broomfield, CO Municipal Code
(C)
(D)
(A)
(B)
other than public places without permission of person in
possession or control of such property.
In an I-1, I PUD, or I-1 PUD zone district, is measured or perceived
beyond the boundaries of the lot on which the sound originates.
In an I-2, I-2 PUD, or GA zone district, is measured or perceived
beyond the boundaries of the district.
SCHEDULE 9-36A
NOISE LIMITS
District Time Period Maximum
Permissible
Levels
E-1, E-2, R-1, R-3,
R-5, PUD, R-PUD
7:00 a.m. until 10:00 p.m. of the
same day
55 dB(A)
10:00 p.m. until 7:00 a.m. of the
following day
40 dB(A)
A-1, B-1, B-2, A-
PUD, B-PUD, B-1
PUD, B-2 PUD
7:00 a.m. until 10:00 p.m. of the
same day
65 dB(A)
10:00 p.m. until 7:00 a.m. of the
following day
60 dB(A)
(Ord. 862 §1, 1989)
9-36-030 - Exceptions.
The maximum dB(A) specified in schedule 9-36A shall not apply to sound
from:
Any bell or chime from any building clock, school, or church;
Any siren, whistle, or bell lawfully used by emergency vehicles or
any other alarm system used in case of fire, collision, civil defense,
Broomfield-3

5/12/2020 Broomfield, CO Municipal Code
(C)
(D)
(E)
(F)
(G)
(H)
(I)
police activity, or other imminent danger; provided, however, that
burglar alarms not terminating within twenty minutes after being
activated shall not be excepted;
Aircraft which are operated in accordance with federal laws or
regulations;
City-authorized or sponsored events including, but not limited to,
parades and fireworks displays;
Any domestic power equipment operated upon any residential,
commercial, industrial, or public premises between 7:00 a.m. and
10:00 p.m., provided that such equipment does not exceed eighty
dB(A);
Any temporary construction, meaning minor remodeling and
additions to existing homes, maintenance, or repair activities
between 7:00 a.m. and 10:00 p.m., provided that the noise from
such activities does not exceed eighty-eight dB(A);
Activities directly connected with the abatement of an emergency;
Golf course greens maintenance activities involving motorized
machinery between the hours of 5:00 a.m. and 7:00 a.m., from May
1 through and including September 30, provided that noise from
such motorized machinery does not exceed seventy-four dB(A); and
Residential construction, not including minor remodeling or
additions to existing homes, within 500 feet of occupied residences,
which shall be performed only from 7:00 a.m. until 7:00 p.m.
Monday through Friday, and 9:00 a.m. to 6:00 p.m. Saturdays,
Sundays, and holidays, unless otherwise provided in the city council
resolution approving the project.
(Ord. 862 §1, 1989; Ord. 1249 §1, 1997; Ord. 1794 §1, 2005)
Broomfield-4

5/12/2020 Broomfield, CO Municipal Code
9-36-040 - Trash compaction and collection.
The operation of compactor trucks, and the loading and unloading of trash
shall be subject to the maximum level of eighty-eight dB(A). No person shall
engage in any trash, rubbish, or garbage collection activity within a residential
district between the hours of 10:00 p.m. and 7:00 a.m. of the following day.
(Ord. 862 §1, 1989)
9-36-050 - Exhaust; muers.
No person shall discharge the exhaust of any steam engine, internal
combustion engine, air compressor equipment, motor boat, motor vehicle, or
other power device which is not equipped with a properly maintained exhaust
system with a muffler or spark arrestor. It is unlawful for any person to operate a
muffler or exhaust system using a cut-out, bypass, or other similar device.
(Ord. 862 §1, 1989)
9-36-070 - Use of sirens and red lights restricted.
It is unlawful for any person to carry or use upon any vehicle other than
police, fire department, or emergency vehicles, any gong, siren, whistle, or red
light similar to that used on police, fire department, or emergency vehicles.
(Ord. 862 §1, 1989)
Broomfield-5
TOWN OF ESTES PARK
NOISE INFORMATION

5/12/2020 Estes Park, CO Municipal Code
Chapter 8.06 - Noises
Footnotes:
--- (1) ---
Editor's note— Ord. No.
24-17 §1(Exh. A), adopted Oct. 24, 2017, amended Ch. 8.06, §§8.06.010
—8.06.070 in its entirety to read as herein set out. Former Ch. 8.06, pertained to similar subject
matter, and derived from Ord. No.
15-16 §1(Exh. A), adopted May 24, 2016.
8.06.010 - Denitions.
The following words, terms and phrases, when used in this Chapter, shall have the
meanings ascribed to them in this Section, except where the context clearly indicates a
different meaning:
Amplified outdoor sound
means sound modified or amplified by the use of
sound equipment on any premises not fully enclosed by permanent walls and a
roof.
Domestic power equipment
means any power equipment rated five (5)
horsepower or less used for home or building repair or grounds maintenance,
including but not limited to lawn mowers, garden tools, snow blowers and chain
saws.
Muffler
means an apparatus consisting of a series of chambers or baffle plates
designated for the purpose of transmitting gases while reducing sound emanating
from such apparatus.
Sound equipment
means a loudspeaker, public address system, amplification
system, or other sound producing device.
Unreasonable noise
shall mean any excessive or unusually loud noise or sound
with intensity or duration that disturbs the peace, health, comfort, repose or quiet
of a reasonable person of normal sensitivities.
Estes Park-1

5/12/2020 Estes Park, CO Municipal Code
(a)
(b)
(1)
(2)
(3)
(4)
(c)
(1)
Vehicle
means any machine propelled by power other than human power,
designed to travel along the ground by use of wheels, treads, runners or slides to
transport persons or property or pull machinery and includes, without limitation,
automobile, airplane, truck, trailer, motorcycle, motor scooter, tractor, buggy and
wagon.
(Ord. No.
24-17 §1(Exh. A), 10-24-2017; Ord. No. 19-18 §1(Exh. A), 11-27-2018)
8.06.020 - Noise prohibited.
No person shall make, continue or cause to be made or continued any
unreasonable noise; and no person shall knowingly permit such noise
upon any premises owned or possessed by such person or under such
person's control. For purposes of this Section, Law Enforcement or Code
Enforcement personnel are empowered to make a prima facie
determination as to whether a noise is unreasonable.
In determining whether noise is unreasonable, the following may be
considered:
The time of day;
The size of any gathering of persons creating or contributing to the
noise;
The presence or absence of sound equipment; and
Any other factors tending to show the magnitude and/or disruptive
effect of the noise.
With regard to vehicles, the determination of unreasonable noise, in
addition to the previously stated factors shall include, but not be limited
to:
The continuous or repeated sounding of any horn, alarm or signal
device of a vehicle, except where an actual emergency or danger
exists. For the purposes of this subsection, "continuous" shall mean
continuing for an unnecessary or unreasonable period of time.
Estes Park-2

5/12/2020 Estes Park, CO Municipal Code
(2)
(1)
(2)
(3)
(4)
(5)
(6)
The operation of any vehicle in a manner which causes unreasonable n
of unnecessary rapid acceleration, deceleration, revving the engine or
(Ord. No.
24-17 §1(Exh. A), 10-24-2017; Ord. No. 19-18 §1(Exh. A), 11-27-2018)
8.06.030 - Restrictions on amplied outdoor sound.
It shall be unlawful for any person to make, cause to be made or to permit
amplified outdoor sound upon any premises possessed or controlled by such person
where such sound occur between the hours of 10:00 p.m., through 10:00 a.m., of the
next day except that on Friday and Saturday nights amplified outdoor sound is
permitted until 11:00 p.m.
(Ord. No.
24-17 §1(Exh. A), 10-24-2017; Ord. No. 19-18 §1(Exh. A), 11-27-2018)
8.06.040 - Exceptions.
The prohibitions set forth in Subsection
8.06.020(1) shall not apply to sound from:
Any bell or chime from any building, clock, school or church;
Any siren, whistle, or bell lawfully used by emergency vehicles or
any other alarm system used in case of fire, collision, civil defense,
police activity or other imminent danger;
Aircraft which are operated in accordance with federal laws or
regulations;
Town authorized or sponsored events including, but not limited to,
parades, fireworks displays, concerts, and events at Stanley Park,
Bond Park, or Performance Park;
Any domestic power equipment, except as provided within this
subsection, operated upon any residential, commercial, industrial
or public place between 7:00 a.m. and 9:00 p.m.;
Any construction, maintenance, or repair activities between 7:00
a.m. and 9:00 p.m.;
Estes Park-3

5/12/2020 Estes Park, CO Municipal Code
(7)
(8)
(9)
Activities directly connected with the abatement of an emergency;
Noise from snow blowers, snow throwers and snow plows when
operated with a muffler for the purpose of snow removal;
Noise generated from golf course maintenance equipment.
(Ord. No.
24-17 §1(Exh. A), 10-24-2017; Ord. No. 19-18 §1(Exh. A), 11-27-2018)
8.06.050 - Exhaust, muers.
No person shall discharge the exhaust of any steam engine, internal combustion
engine, air compressor equipment, motor boat, or other power device which is not
equipped with a properly maintained exhaust system with a muffler or a spark arrestor.
It is unlawful for any person to operate a muffler or exhaust using a cutout, bypass or
other similar device.
(Ord. No.
24-17 §1(Exh. A), 10-24-2017; Ord. No. 19-18 §1(Exh. A), 11-27-2018)
Estes Park-4
CITY OF FORT COLLINS
NOISE INFORMATION

5/12/2020 Fort Collins, CO Municipal Code
ARTICLE II. - NOISE
Sec. 20-21. - Denitions.
The following words and terms, and phrases, when used
in this Article, shall have the following meanings ascribed
to them in this Section:
Ambient sound level
shall mean the total sound pressure
level in the area of interest including the noise source of
interest.
A-weighting
shall mean the electronic filtering in sound
level meters that models human hearing frequency
sensitivity.
Background sound level
shall mean the total sound
pressure level in the area of interest excluding the noise
source of interest.
Code Compliance Inspector
shall mean an employee of
the City trained in the measurement of sound and
empowered to issue a summons for violations of
§ 20-23
and to issue variances pursuant to
§ 20-27.
Construction
shall mean any site preparation, assembly,
erection, repair, alteration or similar action, or demolition
of buildings or structures.
Fort Collins-1

5/12/2020 Fort Collins, CO Municipal Code
(1)
dB(A)
shall mean the A-weighted unit of sound pressure
level.
Decibel [dB]
shall mean the unit of measurement for
sound pressure level at a specified location.
Emergency work
shall mean any work or action necessary
to deliver essential services including, but not limited to,
repairing water, gas, electric, telephone, sewer facilities,
or public transportation facilities, removing fallen trees on
public rights-of-way, or abating life-threatening
conditions.
Impulsive sound
shall mean a sound having a duration of
less than one (1) second with an abrupt onset and rapid
decay.
Motor vehicle
shall mean any vehicle that is propelled or
drawn on land by an engine or motor.
Muffler
shall mean a sound-dissipative device or system
for attenuating the sound of escaping gases of an internal
combustion engine.
Multi-use property
shall mean any distinct parcel of land
that is used for more than one (1) category of activity.
Examples include, but are not limited to:
A commercial, residential, industrial or public
Fort Collins-2

5/12/2020 Fort Collins, CO Municipal Code
(2)
service property having boilers, incinerators,
elevators, automatic garage doors, air
conditioners, laundry rooms, utility provisions, or
health and recreational facilities, or other similar
devices or areas, either in the interior or on the
exterior of the building, which may be a source of
elevated sound levels at another category on the
same distinct parcel of land; or
A commercial building which has a residential use
located above, behind, below or adjacent to the
commercial use.
Noise disturbance
shall mean any sound originating from
or received within the City limits that (a) endangers the
safety or health of any person, (b) disturbs a reasonable
person of normal sensitivities, or (c) endangers personal
or real property.
Person
shall mean any individual, corporation, company,
association, society, firm, partnership, joint stock
company, the City or any political subdivision, agency or
instrumentality of the City.
Public right-of-way
shall mean any street, avenue,
boulevard, road, highway, sidewalk, alley or similar place
which is leased, owned or controlled by a governmental
entity.
Fort Collins-3

5/12/2020 Fort Collins, CO Municipal Code
Public space
shall mean any real property or structures
thereon that is owned, leased or controlled by a
governmental entity.
Pure tone
shall mean any sound that can be judged as a
single pitch or set of single pitches by the Code
Compliance Inspector.
Real property line
shall mean either (a) the line, including
its vertical extension, that separates one (1) parcel of real
property from another, or (b) the vertical and horizontal
boundaries of a dwelling unit that is contained within a
multi-use building.
Sound level
shall mean the instantaneous sound pressure
level measured in decibels with a sound level meter set
for A-weighting on slow or fast integration speed.
Sound level meter
shall mean an instrument used to
measure sound pressure levels conforming to standards
as specified in ANSI Standard S1.4-1983 or the latest
version thereof.
Sound pressure level
shall mean twenty (20) multiplied by
the logarithm, to the base ten (10), of the measured
sound pressure divided by the sound pressure associated
with the threshold of human hearing, in units of decibels.
Fort Collins-4

5/12/2020 Fort Collins, CO Municipal Code
(a)
(Code 1972, § 78-9; Ord. No. 154, 2001, 11-6-01; Ord. No. 071, 2004, §
1, 5-18-04; Ord. No. 084, 2008, § 3, 8-19-08)
Cross reference— Definitions and rules of construction generally,
§ 1-
2.
Sec. 20-22. - Reserved.
Footnotes:
--- (1) ---
Editor's note— Section 1 of Ord. No. 084, 2008, adopted 8-19-08,
renumbered former § 20-22, Unreasonable noise, as § 17-129.
Sec. 20-23. - Maximum permissible noise levels.
A noise measured or registered in the manner provided
in
§ 20-24 from any source at a level which is in excess
of the dB(A) established for the time period and zoning
districts listed in this Section is hereby declared to be a
noise disturbance and is unlawful. When a noise source
can be identified and its noise measured in more than
one (1) zoning district, the limits of the most restrictive
zoning district shall apply.
Zoning Districts
Maximum Noise [dB (A)]
Areas zoned:
Low Density Residential (R-
L)
Fort Collins-5

5/12/2020 Fort Collins, CO Municipal Code
Urban Estate (U-E)
Foothills Residential (R-F)
High Density Mixed-Use
Neighborhood (H-M-N)
Low Density Mixed-Use
Neighborhood (L-M-N)
Medium Density Mixed-Use
Neighborhood (M-M-N)
Neighborhood Conservation
Low Density (N-C-L)
Neighborhood Conservation
Medium Density (N-C-M)
Neighborhood Conservation
Buer (N-C-B)
Public Open Lands (P-O-L)
River Conservation (R-C)
Transition (T)
7:00 a.m. to 8:00 p.m. 55
8:00 p.m. to 7:00 a.m. 50
Areas zoned:
Downtown Old City Center
(D)
Downtown Canyon Avenue
(D-C-A)
Downtown Civic Center (D-
C-C)
River Downtown
Redevelopment Commercial
(R-D-R)
Fort Collins-6

5/12/2020 Fort Collins, CO Municipal Code
(b)
(c)
Community Commercial (C-
C)
Community Commercial
North College (C-C-N)
Community Commercial
River (C-C-R)
Commercial North College
(C-N)
Neighborhood Commercial
(N-C)
Limited Commercial (C-L)
Harmony Corridor (H-C)
7:00 a.m. to 8:00 p.m. 60
8:00 p.m. to 7:00 a.m. 55
Areas zoned:
Employment (E)
7:00 a.m. to 8:00 p.m. 70
8:00 p.m. to 7:00 a.m. 65
Areas zoned:
Industrial (I)
7:00 a.m. to 8:00 p.m. 80
8:00 p.m. to 7:00 a.m. 75
If the noise source in question is a pure tone, the limits
set forth above shall be reduced by five (5) dB(A).
In multi-use buildings, when noise originates in one (1)
unit and is received in another unit within the same
building, the maximum dB(A) for such noise shall be the
Fort Collins-7

5/12/2020 Fort Collins, CO Municipal Code
(1)
(2)
(3)
same as the maximum dB(A) for the zoning district in
which the building is located.
(Code 1972, § 78-2; Ord. No. 9, 1998, 2-3-98; Ord. No. 154, 2001, 11-6-
01)
Cross reference— Zoning, annexations and development of land,
Article 4 of the Land Use Code — Zone Districts.
Sec. 20-24. - Classication and measurement of noise.
For the purposes of classifying any noise disturbance and
determining whether it is in violation of
§ 20-23, the
following test measurements and requirements shall be
applied; provided, however, that a violation of
§ 17-129
may occur without the following measurements being
made:
Noise shall be measured at a distance of at least
twenty-five (25) feet from a noise source located
within the public right-of-way, and if the noise
source is located on private property or public
property other than the public right-of-way, the
noise shall be measured at or within the property
boundary of the receiving land use.
The noise shall be measured on a sound level
meter.
No outdoor measurement shall be taken without a
Fort Collins-8

5/12/2020 Fort Collins, CO Municipal Code
(1)
(2)
(3)
(4)
(5)
wind screen recommended by the sound level
meter manufacturer, or during periods when wind
speeds, including gusts, exceed fifteen (15) miles
per hour.
(Code 1972, § 78-3; Ord. No. 154, 2001, 11-6-01; Ord. No. 084, 2008, §
4, 8-19-08)
Sec. 20-25. - Exceptions.
The provisions of this Article shall not apply to:
Noise from emergency signaling devices;
Noise from agricultural activities;
The operation of aircraft or other activities which
are subject to federal law with respect to noise
control, and the generation of sound in situations
within the jurisdiction of the Federal Occupational
Safety and Health Administration;
Noise from domestic power tools and lawn and
garden equipment operated between 7:00 a.m.
and 8:00 p.m., provided that such tools or
equipment generate less than eighty-five (85)
dB(A) at or within any real property line of a
residential property;
Sound from church bells and chimes when a part
of a religious observance or service;
Fort Collins-9

5/12/2020 Fort Collins, CO Municipal Code
(6)
(7)
(8)
(9)
(10)
Any tools or equipment used in construction,
drilling, earthmoving, excavating, or demolition,
provided that all motorized equipment used in
such activity is equipped with functioning mufflers,
and further provided that such work takes place
between 7:00 a.m. and 8:00 p.m.;
Noise from snow blowers, snow throwers and
snow plows when operated with a muffler for the
purpose of snow removal;
The City for noise emanating from any public
right-of-way;
Noise generated from golf course maintenance
equipment;
Noise generated by tools or equipment during
emergency operations or activities that are
reasonably necessary for the public health, safety
or welfare.
(Code 1972, § 78-4; Ord. No. 26, 1990, 4-3-90; Ord. No. 93, 1999, 6-15-
99; Ord. No. 154, 2001, 11-6-01)
Sec. 20-26. - Extraterritorial noise source.
If noise measured at a location within the City limits
exceeds the maximum permissible noise levels contained
in
§ 20-23 for the zoning district in which the noise is
Fort Collins-10

5/12/2020 Fort Collins, CO Municipal Code
(1)
(2)
(a)
measured, and the source of the noise is located in an
unincorporated area of the County, the City shall have
jurisdiction to prosecute such noise violation provided
that:
The complainant has first sought enforcement of
any applicable county noise law or regulation and
the County has declined to initiate any court
proceedings to enforce said law or regulation, or
thirty (30) days have elapsed from the date of
filing the complaint with the County and no such
proceedings have been initiated; or
The person charged with a violation of the
County's law or regulation has been acquitted of
such charge, or such charge has been dismissed,
and the elements constituting a violation of the
County law or regulation are substantially
different than the elements constituting a
violation of
§ 20-23.
(Ord. No. 154, 2001, 11-6-01)
Sec. 20-27. - Variances.
Any person who owns or operates any stationary noise
source may apply to the Code Compliance Inspector for
a variance from one (1) or more of the provisions of this
Fort Collins-11

5/12/2020 Fort Collins, CO Municipal Code
(1)
(2)
(3)
(4)
(5)
(6)
(b)
(c)
Article. Applications for a variance shall supply
information including, but not limited to:
The nature and location of the noise source for
which such application is made;
The reason for which the variance is requested,
including the hardship that will result to the
applicant, his/her client or the public if the permit
of variance is not granted;
The level of noise that will occur during the period
of the variance;
The section or sections of this Article for which the
variance shall apply;
A description of interim noise control measures to
be taken for the applicant to minimize noise and
the impacts occurring therefrom; and
A specific schedule of the noise control measures
that shall be taken to bring the source into
compliance with this Article within a reasonable
time.
Failure to supply the information required by the Code
Compliance Inspector shall be cause for rejection of the
application.
The Code Compliance Inspector may charge the
applicant a fee, in accordance with
§ 7.5-1 of this Code,
Fort Collins-12

5/12/2020 Fort Collins, CO Municipal Code
(d)
(e)
(1)
(2)
(f)
(g)
(1)
to cover expenses resulting from the processing of the
variance application.
The Code Compliance Inspector may, at his or her
discretion, limit the duration of the variance, which shall
be no longer than one (1) year. Any person granted a
variance and requesting an extension of time shall
apply for a new variance under the provisions of this
Section.
No variance shall be approved unless the applicant
presents adequate proof that:
Noise levels occurring during the period of the
variance will not constitute a danger to public
health; and
Compliance with this Article would impose an
unreasonable hardship on the applicant without
equal or greater benefits to the public.
Under no circumstances shall the noise level of an
activity for which a variance is granted for a period of
time in excess of eight (8) hours exceed ninety (90)
decibels.
In determining whether to grant a variance, the Code
Compliance Inspector shall consider:
The character and degree of injury to, or
interference with, the public health and welfare
Fort Collins-13

5/12/2020 Fort Collins, CO Municipal Code
(2)
(3)
(h)
(1)
(2)
(3)
(i)
(a)
and the reasonable use of property that is caused
or threatened to be caused;
The social and economic value of the activity for
which the variance is sought; and
The ability of the applicant to apply the best
practical noise control measures.
A variance may be revoked by the Code Compliance
Inspector if there is:
Violation of one (1) or more terms or conditions of
the variance;
Material misrepresentation of fact in the variance
application; or
Material change in any of the circumstances relied
on by the Code Compliance Inspector in granting
the variance.
Variance decisions may be appealed to the City
Manager by the applicant or any affected person.
(Code 1972, § 78-5; Ord. No. 154, 2001, 11-6-01)
Sec. 20-28. - Motor vehicle maximum sound levels.
No person shall operate or cause to be operated a
public or private motor vehicle or motorcycle on a
public right-of-way at any time in such a manner that
Fort Collins-14

5/12/2020 Fort Collins, CO Municipal Code
the sound level emitted by the motor vehicle or
motorcycle exceeds the levels set forth below:
Vehicles class
(GVWR)
Speed
limit
where
posted
35 mph
or less or
speed
limits
regulated
under
the Fort
Collins
Trac
Code
[sound
pressure
level
dB(A)]
Speed
limit
where
posted
greater
than 35
mph
[sound
pressure
level
dB(A)]
Fort Collins-15

5/12/2020 Fort Collins, CO Municipal Code
Motor vehicles
with a
manufacturer's
gross vehicle
weight rating
(GVWR) of
10,000 pounds
(4,536 kg) or
more, or by
any
combination of
vehicles towed
by such motor
vehicle
86 90
Fort Collins-16

5/12/2020 Fort Collins, CO Municipal Code
(b)
Any other
motor vehicle
or any
combination of
vehicles towed
by any motor
vehicle, to
include but not
to be limited to
automobiles,
vans, light
trucks or any
motorcycle
with a gross
vehicle weight
rating (GVWR)
less than
10,000 pounds
(4,536 kg)
80 84
No person shall operate or cause to be operated any
motor vehicle or motorcycle off a public right-of-way in
such a manner that the sound level emitted exceeds
the limits set forth in
§ 20-23. This Section shall apply to
all motor vehicles, whether or not duly licensed and
registered, including but not limited to commercial or
Fort Collins-17

5/12/2020 Fort Collins, CO Municipal Code
(c)
(d)
(e)
(a)
(b)
noncommercial racing vehicles, motorcycles, go-carts,
snowmobiles, amphibious crafts, campers and dune
buggies.
Noise shall be measured at a distance of at least
twenty-five (25) feet from the lane being monitored.
The noise shall be measured on a sound level meter.
No outdoor measurement shall be taken without a wind
screen recommended by the sound level meter
manufacturer, or during periods when wind speeds,
including gusts, exceed fifteen (15) miles per hour.
(Code 1972, § 78-7; Ord. No. 154, 2001, 11-6-01; Ord. No. 16, 2003, §
10, 2-18-03)
Cross reference— Vehicles and traffic,
ch. 28; fort collins traffic code.
Sec. 20-29. - Violations and penalties.
Any person who violates any provision of this Article,
upon conviction, shall be subject to the penalty in
§ 1-
15.
Violation of any provision of this Article shall be cause
for a summons to be issued by authorized enforcement
officials according to adopted procedures.
(Code 1972, § 78-8(A), (B); Ord. No. 154, 2001, 11-6-01)
Cross reference— General penalty,
§ 1-15.
Fort Collins-18
CITY OF GREELEY
NOISE INFORMATION

5/12/2020 Greeley, CO Municipal Code
Article II - Noise
Chapter 9.20 - Denitions
9.20.010 - Applicability.
The definitions set out at this Chapter shall apply in the
interpretation and enforcement of this Article II, except as otherwise
provided in this Article II.
(Prior code §15-130(part))
9.20.020 - Reserved.
9.20.030 - Commercial purpose.
Commercial purpose
means and includes the use, operation or
maintenance of any sound amplifying equipment for the purpose of
advertising any business, any goods or any services or for the purpose
of attracting the attention of the public to, advertising for or soliciting
the patronage of customers to or for, any performance, show,
entertainment, exhibition or event or for the purpose of
demonstrating such sound equipment.
(Prior code §15-130(2))
Greeley-1

5/12/2020 Greeley, CO Municipal Code
9.20.040 - Commercial district.
Commercial district
means any parcel of land zoned with any
commercial classification pursuant to the Zoning and Land Use
Chapter of this Code.
(Ord. 23, 2012 §1; Ord. 04, 2008 §2; Prior code §15-130(3))
9.20.050 - Construction activities.
Construction activities
means any and all activity incidental to the
erection, demolition, assembling, altering and installing or equipping
of buildings, structures, roads or appurtenances thereto, including
land clearing, grading, excavating and filling.
(Prior code §15-130(4))
9.20.060 - Device.
Device
means any mechanism which is intended to produce or
which actually produces sound when operated or handled.
(Prior code §15-130(5))
9.20.070 - Dynamic braking device.
Dynamic braking device
means a device, used primarily on trucks,
for the conversion of the motor from an internal combustion engine to
an air compressor for the purpose of braking.
Greeley-2

5/12/2020 Greeley, CO Municipal Code
(Prior code §15-130(6))
9.20.080 - Emergency work.
Emergency work
means work made necessary to restore property
to a safe condition following a public calamity or work required to
protect persons or property from an imminent exposure to danger or
potential danger.
(Prior code §15-130(7))
9.20.090 - Industrial district.
Industrial district
means any parcel of land zoned with any
industrial classification pursuant to the Zoning and Land Use Chapter
of this Code.
(Ord. 23, 2012 §1; Prior code §15-130(8))
9.20.100 - Motor vehicles.
Motor vehicles
means any vehicle such as, but not limited to, a
passenger vehicle, truck, truck-trailer, trailer or semitrailer propelled
or drawn by mechanical power and shall include motorcycles,
snowmobiles, minibikes, go-carts and any other vehicle which is self-
propelled.
(Prior code §15-130(9))
Greeley-3

5/12/2020 Greeley, CO Municipal Code
9.20.110 - Muer.
Muffler
means an apparatus consisting of a series of chambers or
baffle plates designed for the purpose of transmitting gases while
reducing sound emanating from such apparatus.
(Prior code §15-130(10))
9.20.120 - Noncommercial purpose.
Noncommercial purpose
means the use, operation or
maintenance of any sound amplifying equipment for other than a
commercial purpose.
Noncommercial purpose
means and includes,
but shall not be limited to, philanthropic, political, patriotic and
charitable purposes.
(Prior code §15-130(11))
9.20.125 - Noise.
Noise
means any sound including but not limited to sounds that
are shrill, impulsive, continuous, rhythmic, or periodic, or that create
vibrations.
(
Ord. No. 3, 2015, § 1(Exh. A), 1-20-2015 )
9.20.130 - Plainly audible.
Greeley-4

5/12/2020 Greeley, CO Municipal Code
Plainly audible
means any sound that can be detected and clearly
comprehended by a person using their own unaided hearing faculties.
(
Ord. No. 3, 2015, § 1(Exh. A), 1-20-2015; Prior code §15-130(12))
9.20.140 - Residential district.
Residential district
means any parcel of land zoned with any
residential classification, or any parcel of land zoned with a residential
PUD classification pursuant to the Zoning and Land Use Chapter of
this Code.
(Ord. 23, 2012 §1; Prior code §15-130(13))
9.20.150 - Sound amplifying equipment.
Sound amplifying equipment
means any machine or device for the
amplification of a human voice, music or any other sound, or by which
the human voice, music or any other sound is amplified.
(Prior code §15-130(14))
9.20.160 - Reserved.
9.20.170 - Technical terminology; denitions by reference.
Greeley-5

5/12/2020 Greeley, CO Municipal Code
(a)
(b)
All technical terminology used in this Article II, unless the context
otherwise requires, shall be defined in accordance with American
National Standards Institute (ANSI) publication S1.1-1960, revised
1971, or successor publications of ANSI or its successor bodies.
(Prior code §15-130(16))
Chapter 9.24 - Limitations Generally
9.24.010 - Unlawful noise generally; designated.
The making or creating of any noise emitted at levels
that annoy, disturb, injure or endanger the comfort,
repose, health, peace or safety of a reasonable person
of normal sensitivities, is unlawful. Noises described in
Chapter 9.28 and Sections
9.32.060 and 9.32.070 of this
Code are presumptively unlawful.
Stationary or moving rail vehicles shall comply with the
provisions of this Article II except as provided for in the
United States Noise Control Act of 1972 (Public Law 92-
574).
(
Ord. No. 3, 2015, § 1(Exh. A), 1-20-2015; Ord. 23, 2012 §1; Ord. 7, 2006
§1; Prior code §15-131)
9.24.020 - Reserved.
Greeley-6

5/12/2020 Greeley, CO Municipal Code
(1)
(2)
(3)
(4)
9.24.030 - Reserved.
9.24.040 - Exemptions designated; special permit conditions.
Nothing in Article II of this Title shall be construed to apply to or
restrict any activity conducted by any person for the safety or
protection of life or property in an emergency situation, nor shall the
provisions of the division apply to:
Authorized emergency vehicles, as defined in
Section 20-25.2(b) of the Traffic Code, adopted in
Section 11.04.030 of this Code, when such
emergency vehicles are responding to, but not
returning from, an emergency call, unless the
return is of an emergency nature;
Any bell or chimes from any church, clock or
school;
Authorized construction activity of the City, as
approved by the Director of Public Works or his or
her designees for emergency construction or
necessary street repair; or
The use of heavy equipment for the removal of
snow from private parking lots within twenty-four
(24) hours of the termination of the snowfall.
(Ord. 23, 2012 §1)
Greeley-7

5/12/2020 Greeley, CO Municipal Code
(a)
(b)
(c)
(d)
9.24.050 - Penalties; repeated oenses.
Any person found guilty after trial or plea of: guilt;
Alford; nolo contendere; or deferred sentence plea to
any provision of
Section 9.24.010 shall be fined not less
than one thousand dollars ($1,000.00), plus any
additional penalties assessed pursuant to
Chapter 1.32
of this Code, except as provided in Subsection (b)
below.
A fine may be reduced to two hundred fifty dollars
($250.00) if the guilty party agrees to attend City-
sponsored training related to neighborhood conduct
and perform fifteen (15) hours of community service
within the City, as so approved by the Municipal Court,
within three (3) months following his or her sentencing.
A repeat offense that occurs within three hundred sixty-
five (365) days from the date of a finding of guilt
pursuant to this Section shall cause the full amount of
the penalty as may be modified under Subsection (b)
above to be immediately reinstated in full.
For purposes of assessing penalties for repeated
offenses pursuant to this Section,
violation
includes
each violation at any property or for a tenant,
Greeley-8

5/12/2020 Greeley, CO Municipal Code
regardless of property location within the City; and
violation
is limited to a violation of the same Municipal
Code Section number.
(Ord. 7, 2006 §1; Ord. 56, 1994 §1; Ord. 73, 1981 §2; prior code §15-
136)
Chapter 9.28 - Unlawful Noises
9.28.010 - Horns or other signaling devices sounding; exception.
The sounding of any horn or audible signaling device on any truck,
automobile, motorcycle or other vehicle on any street or public place
of the City, except as a danger warning signal as provided in the Traffic
Code of the City, is unlawful.
(Prior code §15-133(a)(1))
9.28.020 - Reserved.
9.28.030 - Length of sounding.
The sounding of a horn or audible signaling device for any
unnecessary and unreasonable period of time is unlawful.
(Prior code §15-133(a)(3))
Greeley-9

5/12/2020 Greeley, CO Municipal Code
(a)
(b)
(c)
(d)
9.28.040 - Sound-reproduction devices, machines or vehicles; hours and
audibility standard.
Using, operating or permitting the use or operation of
any radio receiving set, musical instrument, television
set, phonograph or other machine or device for the
production or reproduction of sound between the
hours of 10:00 p.m. and the following 7:00 a.m. in such
a manner as to be plainly audible at the property
boundary of the source or plainly audible through party
walls within a building is unlawful.
Using, operating or permitting the use or operation of
any radio receiving set, musical instrument, television
set, phonograph or other machine or device for the
production or reproduction of sound at any time in
such a manner as to be plainly audible at fifty (50) feet
from such device when operated within a vehicle is
unlawful.
It is unlawful for a person to knowingly create loud and
excessive noise during the operation of a motor vehicle,
which includes but is not limited to squealing the tires
of a motor vehicle while it is stationary or in motion,
rapid acceleration, producing smoke from tire slippage
or leaving visible tire acceleration marks on the surface
of the roadway or ground.
A violation of this Section is a misdemeanor infraction
Greeley-10

5/12/2020 Greeley, CO Municipal Code
and shall be punishable under
Chapter 1.32 of this
Code.
(Ord. 09, 2011 §1; Ord. 27, 2010 §1; Ord. 69, 2001 §1; Ord. 17, 1998 §1;
prior code §15-133(a)(4))
9.28.050 - Public entertainment places; violating OSHA standards.
Operating or permitting to be operated in an enclosed place of
public entertainment any loudspeaker or other source of amplified
sound in such a manner as to violate the permissible noise exposure
of the U.S. Occupational Safety and Health Act (OSHA) for any
individual in the enclosed place of public entertainment is unlawful.
(Prior code §15-133(a)(5))
9.28.060 - Use of dynamic braking devices; exception.
Operating any motor vehicle with a dynamic braking device
engaged, except for the aversion of imminent danger, is unlawful.
(Prior code §15-133(a)(6))
9.28.070 - Hours of operation for refuse collecting and compacting vehicles.
It shall be unlawful to operate any refuse compacting or collecting
vehicle for the purpose of collection or compaction of refuse or
recyclable materials in a residential district, or within three hundred
(300) feet of any residential district in the City, between the hours of
Greeley-11

5/12/2020 Greeley, CO Municipal Code
10:00 p.m. and 7:00 a.m., except such vehicles may begin operation at
K—12th grade school sites at 6:00 a.m. during the period of time when
such schools are in session.
(Ord. 23, 2012 §1; Ord. 49, 1996 §1; Ord. 37, 1995 §1; prior code §15-
133(a)(7))
9.28.080 - Motor vehicles beyond ten thousand pounds.
Operating or permitting the operating of any motor of a motor
vehicle in excess of ten thousand (10,000) pounds, manufacturer's
gross vehicle weight or any attached auxiliary equipment, for a
consecutive period longer than ten (10) minutes, while such vehicle is
standing on a public right-of-way in a residential district or is on
private property in a residential district and is not within a completely
enclosed structure, is unlawful.
(Prior code §15-133(a)(8))
Chapter 9.32 - Sound-Amplifying Equipment
9.32.010 - Residential districts; certain installation, use or operation
prohibited; permits.
Greeley-12

5/12/2020 Greeley, CO Municipal Code
It is unlawful for any person to install, use or operate a
loudspeaker or sound-amplifying equipment in a fixed or movable
position, or attached to or mounted upon any motor vehicle, within a
residential district for the purpose of giving instructions, directions,
talks, addresses or lectures, or for transmitting music or sound to any
persons or assemblages of persons; provided, however, that a permit
as described in Sections
9.32.030, 9.32.040 and 9.32.050 may be
applied for, for activities such as but not limited to concerts, speeches
or lectures held in public parks of the City.
(Prior code §15-134(a))
9.32.020 - Commercial or industrial districts; permit required.
It is unlawful for any person to install, use or operate a
loudspeaker or sound-amplifying equipment in a fixed or movable
position, or attached to or mounted upon any motor vehicle, within a
commercial or industrial district for the purpose of giving instructions,
directions, talks, addresses or lectures, or for transmitting music or
sound to any persons or assemblages of persons, without first
obtaining a permit pursuant to Sections
9.32.030, 9.32.040 and
9.32.050.
(Prior code §15-134(b))
9.32.030 - Permit application.
Greeley-13

5/12/2020 Greeley, CO Municipal Code
(1)
(2)
(3)
(4)
(5)
(a)
An application for a permit shall be directed to the Chief of Police
and shall provide the following information:
The name, address and telephone number of both
the owner and user of the sound-amplifying
equipment;
The license number of a vehicle which is to be
used;
The general description of the sound-amplifying
equipment which is to be used;
Whether the sound-amplifying equipment will be
used for commercial or noncommercial purposes;
and
The dates and times upon which and the streets
over which the equipment is proposed to be
operated.
(Ord. 23, 2012 §1; Prior code §15-135(a))
9.32.040 - Issuance.
A permit shall be issued unless the Chief of Police or his
or her designee finds that the conditions of motor
vehicle movement or pedestrian movement are such
that the use of the equipment would constitute an
unreasonable interference with traffic safety or that the
Greeley-14

5/12/2020 Greeley, CO Municipal Code
(b)
applicant for the permit cannot or will not comply with
the provisions of
Section 9.32.050 below, and no
variance has been granted.
The Chief of Police or his or her designee may grant a
variance to the requirements set forth in
Section
9.32.050 below upon finding that such variance serves
the public interest. In making such a determination, the
Chief of Police or his or her designee shall consider the
needs of the community, the reason for the variance
request and the impact to surrounding areas.
(Ord. 23, 2012 §1; Prior code §15-135(b))
9.32.050 - Hours of operation.
Unless a variance is granted authorizing additional or different
hours of operation, commercial and noncommercial sound-amplifying
equipment shall be operated only between the hours of 7:00 a.m. and
10:00 p.m. of each day; except that the operation of sound-amplifying
equipment for commercial purposes on Sundays and legal holidays is
permitted only between the hours of 10:00 a.m. and 4:00 p.m.
(Ord. 23, 2012 §1; Prior code §15-135(c))
9.32.060 - Unlawful acts; hours; sound level; proximity to public sessions;
penalties; repeat oenses.
Greeley-15

5/12/2020 Greeley, CO Municipal Code
(1)
(2)
(3)
(4)
(5)
A person commits a violation of this Section if he or she uses or
operates sound-amplifying equipment:
Out of doors, except between 7:00 a.m. and 10:00
p.m.
Indoors, if the projection of the sound is plainly
audible to persons out of doors and at or beyond
the property line from which the sound is being
emitted.
At a sound level higher than necessary to
accomplish the purposes for which a permit from
the Chief of Police was granted.
Within five hundred feet (500) of any place where
a public council, board or court is in session.
That produces any noise emitted at levels which
annoys, disturbs, injures or endangers the
comfort, repose, health, peace or safety of [a]
reasonable person of normal sensitivities.
(
Ord. No. 3, 2015, § 1(Exh. A), 1-20-2015; Ord. 41, 2006 §1; Ord. 7, 2006
§1; Prior code §15-133(b))
9.32.070 - Defense; sound-amplifying equipment dened.
Greeley-16

5/12/2020 Greeley, CO Municipal Code
(a)
(b)
It is an affirmative defense to
Section 9.32.060 above that the
defendant has been granted a permit from the Chief of Police and that
the use and operation of the sound-amplifying equipment has been
consistent with the use authorized by the permit.
Sound-amplifying
equipment,
as used in this Section and Section 9.32.060 above, means
any machine or device for the amplification of the human voice, music
or any other sound, but shall not be construed as including such
equipment when used in a normal and reasonable manner in or about
a residence, business establishment or vehicle if the equipment is
designed and intended to be heard only by the occupants thereof.
(Ord. 23, 2012 §1; Prior code §15-133(c))
9.32.080 - Penalties; repeated oenses.
Any person found guilty after trial or plea of: guilt;
Alford; nolo contendere; or deferred sentence plea to
any provision of
Section 9.32.060 above shall be fined
not less than one thousand dollars ($1,000.00), plus any
additional penalties assessed pursuant to
Chapter 1.32
of this Code, except as provided in Subsection (b)
below.
Up to seven hundred fifty dollars ($750.00) of the fine
may be suspended if the guilty party agrees to attend
City-sponsored training related to neighborhood
conduct and perform fifteen (15) hours of community
Greeley-17

5/12/2020 Greeley, CO Municipal Code
(c)
(d)
service within the City, as so approved by the Municipal
Court, within three (3) months following his or her
sentencing.
A repeat offense within three hundred sixty-five (365)
days from the date of a finding of guilt pursuant to this
Section shall cause the full amount of the penalty as
may be modified under Subsection (b) above to be
immediately reinstated in full.
For purposes of assessing penalties for repeated
offenses pursuant to this Section,
violation
includes
each violation at any property or for a tenant,
regardless of property location within the City; and
violation
is limited to a violation of the same Municipal
Code Section number.
(Ord. 41, 2006 §2; Ord. 7, 2006 §1)
Greeley-18
CITY OF LONGMONT
NOISE INFORMATION

5/12/2020 Longmont, CO Code of Ordinances
A.
B.
C.
D.
10.20.100. - Unreasonable noises prohibited—Prima facie unreasonable noises.
Notwithstanding
section 10.20.110, it is unlawful to intentionally, knowingly or recklessly
make, permit or assist another to make unreasonable noise in a public place or near a
private residence that a person has no right to occupy, which, under all of the circumstances
presented, would cause a person of ordinary sensitivities significant annoyance and
irritation. The following noises and circumstances shall be deemed as prima facie
unreasonable in the context, however, of the above standards:
Amplified sound as defined at
section 13.37.020 of this Code audible 25
feet from the source of said sound or within a private residence that the
person responsible for the sound has no right to occupy; or
Nonlicensed motor vehicle engines, nonvehicular engines and electric
and pneumatic tools operated between 10:00 p.m. and 7:00 a.m. and
audible 25 feet from the source of the sound or within a private
residence that the person responsible for the sound has no right to
occupy; or
Repair or adjustment of a motor vehicle or other types of machinery or
equipment between 10:00 p.m. and 7:00 a.m. which is audible 25 feet
from the source of the sound or within a private residence that the
person responsible for the sound has no right to occupy; or
A gathering of persons engaged in loud and continuing activities
continuing for a minimum of 15 minutes between 10:00 p.m. and 7:00
a.m. and audible 25 feet from the source of the sound or within a private
residence that the person responsible for the sound has no right to
occupy.
Except that amplified sound of 80 decibels or less as measured from the perimeter of the
area covered by a use of public places permit for a special event issued pursuant to
chapter
13.37 of this Code and city operations such as mowing and maintenance shall not constitute
an unreasonable noise.
(Code 1993, § 10.20.100; Ord. No. O-92-51, § 1; Ord. No. O-2012-89, § 2, 12-18-2012)
10.20.110. - Maximum permissible sound pressure levels—Denitions—Exceptions.
Longmont-1

5/12/2020 Longmont, CO Code of Ordinances
A.
B.
Notwithstanding section 10.20.100, and except under conditions of emergency o
necessity, or for motor vehicle noise as regulated by section 225 of the Model Tra
is unlawful to make, cause to be made or assist another to make noise measured
distance at least 25 feet from a noise source as set forth in the table immediately
between 10:00 p.m. and 7:00 a.m., unless the prohibited noise pressure level is c
entirely within the confines of private property which the person making or assis
noise has a right to occupy. Such noise shall be measured pursuant to the "A" we
sound pressure level measured with a sound level meter using the "A" weighting
The standard unit notation is dB(A).
TABLE
10.20.110 A
NIGHTTIME NOISE STANDARDS
Premises Receiving Sound Maximum Nighttime Sound Level db(A)
Zone
Residential 50 dB(A)
Commercial 55 dB(A)
Industrial 75 dB(A)
Notwithstanding
section 10.20.100, and except under conditions of emergency
or manifest necessity, it is unlawful to make, cause to be made or assist
another to make noise measured at a distance at least 25 feet from a noise
source as set forth in the table immediately below between 7:00 a.m. and
10:00 p.m., unless the prohibited noise pressure level is contained entirely
within the confines of private property which the person making or assisting
such noise has a right to occupy. Such noise shall be measured pursuant to
the "A" weighted sound pressure level measured with a sound level meter
using the "A" weighting network. The standard unit notation is dB(A).
TABLE
10.20.110 B
DAYTIME NOISE STANDARDS
Premises Receiving Sound Maximum Daytime Sound Level db(A)
Zone
Residential 55 dB(A)
Commercial 65 dB(A)
Longmont-2

5/12/2020 Longmont, CO Code of Ordinances
C.
D.
1.
2.
3.
i.
ii.
iii.
4.
Industrial 75 dB(A)
Residential dwelling units located in the same building as, or on the same lot
as a nonresidential use shall be considered "commercial" premises for the
purposes of Table
10.20.110 B, i.e., a maximum 65 dB(A) shall apply.
Additional noise standards and exemptions for specific operations and
activities:
Refuse collection/loading.
No person shall engage in waste disposal
services or refuse loading and collection or operate any compacting
equipment or similar mechanical device in any manner so as to create
any noise exceeding the standards stated above when measured at a
distance of 50 feet from the equipment when inside of or within 500 feet
of a residential zone. No refuse loading or collection shall take place
between the hours of 7:00 p.m. and 7:00 a.m.
Truck/rail loading.
Except for truck loading at retail grocery stores, no
truck or rail loading or unloading is allowed within 250 feet of a
residential lot between the hours of 10:00 p.m. and 7:00 a.m.
Homeowners' outdoor equipment.
No person shall operate engine or motor-powered lawn or
maintenance tools intended for use in residential areas such as
power mowers, leaf blowers, garden tools, riding tractors, power
saws, edgers, and similar equipment that would create a noise that
exceeds the fixed source standards stated above, except between
the hours of 7:00 a.m. and 10:00 p.m.
Where applicable, homeowners' outdoor equipment shall have
mufflers that are kept in good working condition.
Snow blowers and snowplows are exempted from the time
requirements of this section when necessary to remove ice and
snow.
Construction activities.
No activity incidental to the erection, demolition,
assembling, altering, installing or equipping of buildings, structures,
roads or appurtenances thereof, including land clearing, grading,
Longmont-3

5/12/2020 Longmont, CO Code of Ordinances
5.
i.
ii.
E.
F.
1.
2.
3.
4.
a.
b.
excavating and filling shall occur between the hours of 7:00 p.m. and
7:00 a.m. Monday through Saturday or before 9:00 a.m. on Sundays,
within a residential area or within 500 feet of a school, except for
temporary conditions approved by the economic development director.
Exemptions.
The following operations and activities are exempted from
the limitations of this section:
Warning or alarm devices that have the purpose of signaling unsafe
or dangerous situations or calling for police.
Noises resulting from authorized public activities such as parades,
fireworks displays, sports activities and events, musical
productions, and other activities to the extent they are approved
and limited by the city.
When the noise source can be measured from more than one zone, the
permissible sound level of the more restrictive zone applies.
As used in this section:
"Commercial" means any area of offices, clinics, automobile service
stations, shopping, financial, restaurant, entertainment and similar
facilities and institutions.
"Condition of emergency" means a sudden, unexpected or unforeseen
occurrence or condition involving a real threat to human life or safety, or
requiring immediate response to protect or preserve property.
"Industrial" means an area in which commodities are manufactured,
processed or fabricated, and shall conditionally include railroad rights-of-
way.
"Manifest necessity" means that compliance with the sound pressure
levels will cause undue hardship and:
The activity, operation or sound source will be strictly limited to the
least amount of time required, and even with the application of the
best available control technology cannot be done in a manner that
would comply with this section; and
No reasonable alternative is available to comply with this section by
restricting noncompliant sound pressure sources to times between
Longmont-4

5/12/2020 Longmont, CO Code of Ordinances
5.
G.
7:00 a.m. and 10:00 p.m.
"Residential" means any area of single or multifamily dwellings, transient
lodging facilities, hospitals, nursing homes and similar facilities and
institutions.
Any person responsible for noise limitations may petition the city manager or
designee for a temporary hardship permit setting forth the basis of the undue
hardship in writing, the anticipated duration of the condition creating
hardship and any other relevant matters in the issues set forth below. A
temporary hardship permit shall be granted if it is found that the activity,
operation or noise source will be of temporary duration, and that compliance
with the sound pressure standards of this section cannot reasonably be
obtained. No temporary permit may be issued for a period exceeding 90 days,
and the city manager or designee reviewing the application shall set any
conditions, limitations or requirements necessary to minimize adverse effects
upon the impacted area of the noise. An aggrieved party may appeal the
decision of the city manager to the city council within seven days of the order
of approval or denial of the hardship permit request. An aggrieved party may
appeal the decision of the city council pursuant to Rule 106(a)(4) of the
Colorado Rules of Civil Procedure.
(Code 1993, § 10.20.110; Ord. No. O-2003-52, § 1; Ord. No. O-92-51, § 1; Ord. No. O-2012-89, §
3, 12-18-2012)
Longmont-5
CITY OF LOVELAND
NOISE INFORMATION

5/12/2020 Loveland, CO Code of Ordinances
A.
B.
C.
CHAPTER 7.32. - SOUND LIMITATIONS
Footnotes:
--- (2) ---
Prior ordinance history: prior code §§ 33.1, 33.6, as amended by Ords. 998,
1237, 1250 and 1396.
7.32.010 - Prohibitions.
It is unlawful to make or cause to be made, or create or
cause to be created, any noise, the sound levels of
which, when measured at a distance of 25 feet or more
from any property line, are in excess of the limits set
out in
Section 7.32.040.
It is unlawful to make or cause to be made, or create or
cause to be created, any periodic, impulsive or shrill
noises which, when measured as in Subsection A above,
are in excess of a sound level of 5 db(A) less than the
limits set out in
Section 7.32.040.
It is unlawful to make, continue or cause to be made or
continued any unreasonable noise; and no person shall
knowingly permit such noise upon any premises or in
or upon any vehicle owned or possessed by such
person or under such person's control or operation. For
Loveland-1

5/12/2020 Loveland, CO Code of Ordinances
1.
2.
purposes of this Section 7.32.010.C, peace officers are
empowered to make a prima facie determination as to
whether a noise is unreasonable.
With regard to the operation of motor vehicles, and
without limiting the generality of the Section,
unreasonable noise shall include, but not be limited to:
The continuous or repeated sounding of any horn
or signal device of a motor vehicle, except as a
danger signal. For the purposes of this Subsection,
continuous shall mean continuing for an
unnecessary or unreasonable period of time.
The operation of any motor vehicle in a manner
which causes excessive noise as a result of
unnecessary rapid acceleration, deceleration,
revving the engine or tire squeal.
(Ord. 1988 § 1 (part), 1981)
7.32.020 - Denitions.
As used in this chapter the following words shall be defined as set
out below:
Adjacent.
When a noise source can be measured for more than
one zone, the permissible sound level of the more restricted zone shall
govern.
Loveland-2

5/12/2020 Loveland, CO Code of Ordinances
Commercial
means an area containing offices, clinics and facilities
needed to serve them; local shopping and service establishments
located within walking distances of the residents served; tourist-
oriented areas containing hotels, motels and gasoline stations,
integrated regional shopping areas, a business strip along a main
street containing offices, retail businesses and commercial enterprises,
commercial business district or a commercially dominated area with
multiple unit dwellings.
db(A)
means sound levels in decibels measured on the "A" scale of
a standard sound level meter having characteristics defined by the
American National Standards Institute ("ANSI"), Publication S1.4-1983
or successor publications of ANSI, or its successor bodies.
Decibel
means a unit used to express the magnitude of a change
in sound level. The difference in decibels between two sound pressure
levels is 20 times the common logarithm of their ratio. In sound
pressure measurements sound levels are defined as 20 times the
common logarithm of the ratio of that sound pressure level to a
reference level of 2 x 10 - 5N/m2 (Newtons/meter squared). As an
example of the formula, a three decibel change is a 100 percent
increase or decrease in the sound level, and a ten decibel change is a
1,000 percent increase or decrease in the sound level.
Industrial
means an area in which noise restrictions on industry
are necessary to protect the value of adjacent properties or for other
economic activity, but shall not include agricultural operations.
Loveland-3

5/12/2020 Loveland, CO Code of Ordinances
Property
means real and personal property, but not including
motor vehicles or motorized bicycles or motorcycles.
Residential
means an area of single or multifamily dwellings where
businesses may or may not be conducted in such dwellings. This zone
includes areas where multiple unit dwellings, high-rise apartment
districts, hospitals, nursing homes and similar institutional facilities
and redevelopment districts are located. A residential zone may
include areas containing accommodations for transients, such as
residential hotels and motels, and residential areas with limited office
development, but it may not include retail shopping facilities.
Unreasonable noise
means any sound of such level and duration
as to be or tend to be injurious to human health or welfare, or which
would unreasonably interfere with the enjoyment of life or property
throughout the city or in any portions thereof, but excludes all aspects
of the employer-employee relationship concerning health and safety
hazards within the confines of a place of employment.
(Ord. 1988 § 1 (part), 1981)
7.32.040 - Noise limitation.
Except as provided in Sections
7.32.060 and 7.32.070, no noise
shall exceed the levels set out below when measured pursuant to
Section 7.32.050; provided however, that a violation of Subsection
Loveland-4

5/12/2020 Loveland, CO Code of Ordinances
7.32.010.C may occur without exceeding these levels and without a
measurement:
ZONE 7:00 a.m. to 9:00
p.m.
9:00 p.m. to 7:00
a.m.
Residential 55 db(A) 50 db(A)
Commercial 60 db(A) 55 db(A)
Industrial 75 db(A) 70 db(A)
(Ord. 4998 § 1 (part), 2005; Ord. 1988 § 1 (part), 1981)
7.32.050 - Sound measurement.
A noise shall be measured on the "A" scale of a standard sound
level meter having characteristics defined by the American National
Standards Institute "ANSI", Publication S1.4-1983, or successor
publications of ANSI , or its successor bodies. Measurements with
sound level meters shall be made when the wind velocity at the time
and place of such measurement is not more than five miles per hour.
In all sound level measurements, consideration shall be given to the
Loveland-5

5/12/2020 Loveland, CO Code of Ordinances
A.
B.
C.
D.
effect of the ambient noise level created by the encompassing noise of
the environment from all sources at the time and place of such sound
level measurement.
(Ord. 1988 § 1 (part), 1981)
7.32.060 - Exceptions.
In the hours between 7:00 a.m. and the next 9:00 p.m.
the noise levels permitted in
Section 7.32.040 may be
increased by ten db(A) for a period of not exceeding 15
minutes in any one hour.
All sound emanating from any aircraft, church, warning
or emergency signal device used or authorized by any
government agency, or program incident to the
recognition or celebration of Veteran's Day, shall not be
subject to the provisions of this chapter.
The provisions of this chapter shall not apply to any
authorized emergency vehicle (as defined by the Model
Traffic Code, as amended and adopted by the city and
the Colorado Revised Statutes) when responding to an
emergency call.
The provisions of this chapter shall not apply to those
activities of temporary duration permitted by law for
which a license or permit has been granted by the city,
Loveland-6

5/12/2020 Loveland, CO Code of Ordinances
E.
F.
including but not limited to parades and firework
displays.
All railroad rights-of-way are considered as industrial
zones for the purposes of this chapter and the
operation of trains are subject to the maximum
permissible noise levels specified for the industrial zone
as indicated in
Section 7.32.040.
Construction projects shall be subject to the maximum
noise level specified for industrial zones as indicated in
Section 7.32.040 for the period of the construction
project, provided that the proper construction permit
has been issued by the city.
(Ord. 1988 § 1 (part), 1981)
7.32.070 - Temporary permits.
Temporary permits to exceed sound limitations of this chapter
may be issued by the city manager. All temporary permits shall contain
the following provisions: the duration of the permit, the sound source
temporarily permitted, the hours of the day and days of the week such
permit is effective, and any other limitations that may be imposed by
the city manager.
(Ord. 1988 § 1 (part), 1981)
Loveland-7

APPENDIX C
SPRING/SUMMER SCHEDULES

Region 4 Lane Closure Strategy, 4
th
Ed.
Appendix C
APPENDIX C. SPRING/SUMMER ALLOWABLE
CLOSURE HOURS

CDOT Region 4 Appendix C - Spring/Summer Single-Lane Closure Allowed Hours Lane Closure Strategy - 4th Ed.
0.0 - 0.5 mile
Lane Closure
0.5 - 1.0 mile
Lane Closure
> 1.0 mile
Lane Closure
0.0 - 0.5 mile
Lane Closure
0.5 - 1.0 mile
Lane Closure
> 1.0 mile
Lane Closure
001A 0.00 0.35 US 287 IN FORT COLLINS LARIMER CR 50 E 9100 2 Both Anytime Anytime 8 PM to 6 AM Anytime Anytime 8 PM to 8 AM
001A 0.35 3.71 LARIMER CR 50 E LARIMER CR 58 7400 2 Both Anytime Anytime 7 PM to 6 AM Anytime Anytime 7 PM to 9 AM
001A 3.71 9.41 LARIMER CR 58 1ST ST WELLINGTON 4700 2 Both Anytime Anytime Anytime Anytime Anytime Anytime
001A 9.41 10.05 1ST ST WELLINGTON I-25 (WELLINGTON INTERCHANGE) 10000 3 Both Anytime Anytime Anytime Anytime Anytime Anytime
006I 343.72 346.70 I-76 MORGAN CR 3 INTERCHANGE EASTBOUND I-76 ON RAMP WIGGINS 3800 2 Both Anytime Anytime
9 PM to 11 AM
1 PM to 3 PM
Anytime Anytime Anytime
006J 371.69 376.22 I-76 INTERCHANGE BRUSH MORGAN CR W HILLROSE 1700 4 Both Anytime Anytime Anytime Anytime Anytime Anytime
006J 376.22 397.96 MORGAN CR W HILLROSE 5TH ST ATWOOD 1700 2 Both Anytime Anytime Anytime Anytime Anytime Anytime
006J 397.96 403.86 5TH ST ATWOOD FRONT ST STERLING 5100 4 Both Anytime Anytime Anytime Anytime Anytime Anytime
006J 403.86 404.15 FRONT ST STERLING DIVISION AVE STERLING 3300 2 Both Anytime Anytime Anytime Anytime Anytime Anytime
006J 404.15 404.64 DIVISION AVE STERLING (BEGIN EB 1-WAY) SH 138 STERLING (END EB 1-WAY) 5400 3 EB Anytime Anytime Anytime Anytime Anytime Anytime
006J 404.64 407.18 CHESTNUT ST STERLING LEAVE STERLING URBAN LIMIT 12000 4 Both Anytime Anytime Anytime Anytime Anytime Anytime
006J 407.18 436.50 LEAVE STERLING URBAN LIMIT SH 59 HAXTUN 2600 2 Both Anytime Anytime Anytime Anytime Anytime Anytime
006J 436.50 444.76 SH 59 HAXTUN PHILLIPS CR 21 PAOLI 1800 4 Both Anytime Anytime Anytime Anytime Anytime Anytime
006J 444.76 453.81 PHILLIPS CR 21 PAOLI SHERMAN AVE HOLYOKE 1600 2 Both Anytime Anytime Anytime Anytime Anytime Anytime
006J 453.81 453.94 SHERMAN AVE HOLYOKE BELFORD AVE HOLYOKE 3300 3 Both Anytime Anytime Anytime Anytime Anytime Anytime
006J 453.94 454.32 S BELFORD AVE HOLYOKE MORLAN AVE HOLYOKE 5100 4 Both Anytime Anytime Anytime Anytime Anytime Anytime
006J 454.32 454.62 MORLAN AVE HOLYOKE WORLEY AVE HOLYOKE 4400 3 Both Anytime Anytime Anytime Anytime Anytime Anytime
006J 454.62 467.28 WORLEY AVE HOLYOKE NEBRASKA STATE LINE 2000 2 Both Anytime Anytime Anytime Anytime Anytime Anytime
006Z 0.00 0.09 N 3RD ST & W CHESTNUT ST STERLING N 4TH ST & W CHESTNUT ST STERLING 6300 3 Both Anytime Anytime Anytime Anytime Anytime Anytime
006Z 0.09 0.60 CHESTNUT ST STERLING (BEGIN WB 1-WAY) DIVISION AVE STERLING (END WB 1-WAY) 5900 3 WB Anytime Anytime Anytime Anytime Anytime Anytime
007A 0.00 0.58 US 36 ESTES PARK GRAVES AVE ESTES PARK EB 9 PM to 5 AM 9 PM to 5 AM 9 PM to 5 AM 9 PM to 5 AM 9 PM to 5 AM 9 PM to 5 AM
007A 0.58 0.00 GRAVES AVE ESTES PARK US 36 ESTES PARK WB 9 PM to 5 AM 9 PM to 5 AM 9 PM to 5 AM 9 PM to 5 AM 9 PM to 5 AM 9 PM to 5 AM
007A 0.58 1.65 GRAVES AVE ESTES PARK PEAK VIEW DR ESTES PARK 9300 3 Both 9 PM to 5 AM 9 PM to 5 AM 9 PM to 5 AM 9 PM to 5 AM 9 PM to 5 AM 9 PM to 5 AM
007A 1.65 3.48 PEAK VIEW DR ESTES PARK MARY'S LAKE RD S/O ESTES PARK 6500 2 Both 9 PM to 5 AM 9 PM to 5 AM 9 PM to 5 AM 9 PM to 5 AM 9 PM to 5 AM 9 PM to 5 AM
007A 3.48 3.88 MARY'S LAKE RD S/O ESTES PARK FISH CREEK WAY LARIMER COUNTY 3800 2 Both 9 PM to 5 AM 9 PM to 5 AM 9 PM to 5 AM 9 PM to 5 AM 9 PM to 5 AM 9 PM to 5 AM
007A 3.88 33.00 FISH CREEK WAY LARIMER COUNTY BROADWAY ST LYONS WB 3400 2 Both Anytime Anytime 9 PM to 10 AM Anytime 9 PM to 10 AM 9 PM to 8 AM
007B 49.51 50.53 BROADWAY BOULDER 26TH ST BOULDER 25000 4 Both
9 PM to 5 AM
9 AM to 11 AM
9 PM to 5 AM
9 AM to 11 AM
9 PM to 5 AM
9 AM to 11 AM
9 PM to Noon 9 PM to Noon 9 PM to Noon
007B 50.53 50.64 26TH ST BOULDER US 36 (28TH ST) BOULDER EB
9 PM to 5 AM
9 AM to Noon
9 PM to 5 AM
9 AM to Noon
9 PM to 5 AM
9 AM to Noon
9 PM to Noon 9 PM to Noon 9 PM to Noon
007B 50.64 50.53 US 36 (28TH ST) BOULDER 26TH ST BOULDER WB
9 PM to 5 AM
9 AM to 11 AM
9 PM to 5 AM
9 AM to 11 AM
9 PM to 5 AM
9 AM to 11 AM
5 PM to 4 PM 5 PM to 4 PM 5 PM to 4 PM
007C 52.49 54.33 US 36 (28TH ST) BOULDER 55TH ST BOULDER EB 9 PM to 5 AM 9 PM to 5 AM 9 PM to 5 AM Anytime Anytime Anytime
007C 54.33 52.49 55TH ST BOULDER US 36 (28TH ST) BOULDER WB 9 PM to 5 AM 9 PM to 5 AM 9 PM to 5 AM Anytime Anytime Anytime
007C 54.33 55.25 55TH ST BOULDER 63RD ST BOULDER COUNTY EB 9 PM to 5 AM 9 PM to 5 AM 9 PM to 5 AM 5 PM to 3 PM 5 PM to 3 PM 5 PM to 3 PM
007C 55.25 54.33 63RD ST BOULDER COUNTY 55TH ST BOULDER WB 9 PM to 5 AM 9 PM to 5 AM 9 PM to 5 AM Anytime Anytime Anytime
Spring/Summer: April – October, Fall/Winter: November – March
State
Highway
Number
Beginning of
Section MP#
End of
Section
MP #
Beginning of Section - Description End of Section - Description
8800 4
35000 6
528000
Dir.
Spring/Summer Weekday Allowed Hours: Spring/Summer Weekend Allowed Hours:
# of
Lanes
2018 Volume
(AADT)
22000 4
Page C-1

CDOT Region 4 Appendix C - Spring/Summer Single-Lane Closure Allowed Hours Lane Closure Strategy - 4th Ed.
0.0 - 0.5 mile
Lane Closure
0.5 - 1.0 mile
Lane Closure
> 1.0 mile
Lane Closure
0.0 - 0.5 mile
Lane Closure
0.5 - 1.0 mile
Lane Closure
> 1.0 mile
Lane Closure
Spring/Summer: April – October, Fall/Winter: November – March
State
Highway
Number
Beginning of
Section MP#
End of
Section
MP #
Beginning of Section - Description End of Section - Description Dir.
Spring/Summer Weekday Allowed Hours: Spring/Summer Weekend Allowed Hours:
# of
Lanes
2018 Volume
(AADT)
007C 55.25 56.77 63RD ST BOULDER COUNTY 75TH ST BOULDER COUNTY 21000 3 Both 9 PM to 5 AM 9 PM to 5 AM 9 PM to 5 AM Anytime Anytime Anytime
007C 56.77 59.46 75TH ST BOULDER COUNTY 95TH ST LAFAYETTE 21000 2 Both 9 PM to 5 AM 9 PM to 5 AM 10 PM to 5 AM 7 PM to 9 AM 8 PM to 8 AM 11 PM to 7 AM
007C 59.46 60.68 95TH ST LAFAYETTE US 287 LAFAYETTE 16000 2 Both 9 PM to 5 AM 9 PM to 5 AM 10 PM to 5 AM 6 PM to 10 AM 7 PM to 9 AM 10 PM to 7 AM
007E 0.00 1.59 BUS. LOOP ALLENS PARK SKI RD ALLENS PARK 770 2 Both Anytime Anytime Anytime Anytime Anytime Anytime
011A 0.00 1.35 SH 138 SEDGWICK COLORADO NEBRASKA STATE LINE 480 2 Both Anytime Anytime Anytime Anytime Anytime Anytime
014B 64.82 121.69 WEST END OF CAMERON PASS US 287 LARIMER COUNTY 3000 2 Both Anytime Anytime Anytime 9 PM to 5 AM 9 PM to 5 AM 9 PM to 5 AM
014C 134.73 135.71 S COLLEGE AVE FORT COLLINS MULBERRY ST / RIVERSIDE AVE FORT COLLINS EB
9 PM to 5 AM
9 AM to 3 PM
9 PM to 5 AM
9 AM to 3 PM
9 PM to 5 AM
9 AM to 3 PM
Anytime Anytime Anytime
014C 135.71 134.73 MULBERRY ST / RIVERSIDE AVE FORT COLLINS S COLLEGE AVE FORT COLLINS WB
9 PM to 5 AM
9 AM to 3 PM
9 PM to 5 AM
9 AM to 3 PM
9 PM to 5 AM
9 AM to 3 PM
Anytime Anytime Anytime
014C 135.71 136.05 MULBERRY ST / RIVERSIDE AVE FORT COLLINS LEMAY ST FORT COLLINS EB
9 PM to 5 AM
9 AM to 3 PM
9 PM to 5 AM
9 AM to 3 PM
9 PM to 5 AM
9 AM to 3 PM
6 PM to Noon 6 PM to Noon 6 PM to Noon
014C 136.05 135.71 LEMAY ST FORT COLLINS MULBERRY ST / RIVERSIDE AVE FORT COLLINS WB
9 PM to 5 AM
9 AM to 3 PM
9 PM to 5 AM
9 AM to 3 PM
9 PM to 5 AM
9 AM to 3 PM
6 PM to 11 AM 6 PM to 11 AM 6 PM to 11 AM
014C 136.05 137.62 LEMAY ST FORT COLLINS S SUMMIT VIEW DR FORT COLLINS EB
9 PM to 5 AM
9 AM to 3 PM
9 PM to 5 AM
9 AM to 3 PM
9 PM to 5 AM
9 AM to 3 PM
7 PM to 10 AM 7 PM to 10 AM 7 PM to 10 AM
014C 137.62 136.05 S SUMMIT VIEW DR FORT COLLINS LEMAY ST FORT COLLINS WB
9 PM to 5 AM
10 AM to 3 PM
9 PM to 5 AM
10 AM to 3 PM
9 PM to 5 AM
10 AM to 3 PM
7 PM to 9 AM 7 PM to 9 AM 7 PM to 9 AM
014C 137.62 138.75 S SUMMIT VIEW DR FORT COLLINS SW FRONTAGE RD FORT COLLINS EB
9 PM to 5 AM
9 AM to 3 PM
9 PM to 5 AM
9 AM to 3 PM
9 PM to 5 AM
9 AM to 3 PM
6 PM to 11 AM 6 PM to 11 AM 6 PM to 11 AM
014C 138.75 137.62 SW FRONTAGE RD FORT COLLINS S SUMMIT VIEW DR FORT COLLINS WB
9 PM to 5 AM
9 AM to 3 PM
9 PM to 5 AM
9 AM to 3 PM
9 PM to 5 AM
9 AM to 3 PM
6 PM to 10 AM 6 PM to 10 AM 6 PM to 10 AM
014C 138.75 138.97 SW FRONTAGE RD FORT COLLINS I-25 INTERCHANGE FORT COLLINS EB
9 PM to 5 AM
9 AM to 3 PM
9 PM to 5 AM
9 AM to 3 PM
9 PM to 5 AM
9 AM to 3 PM
7 PM to 10 AM 7 PM to 10 AM 7 PM to 10 AM
014C 138.97 138.75 I-25 INTERCHANGE FORT COLLINS SW FRONTAGE RD FORT COLLINS WB
9 PM to 5 AM
10 AM to 3 PM
9 PM to 5 AM
10 AM to 3 PM
9 PM to 5 AM
10 AM to 3 PM
7 PM to 9 AM 7 PM to 9 AM 7 PM to 9 AM
014C 138.97 139.46 I-25 INTERCHANGE FORT COLLINS CHANGE WIDTH e/o BOX ELDER CREEK EB
9 PM to 5 AM
9 AM to 3 PM
9 PM to 5 AM
9 AM to 3 PM
9 PM to 5 AM
9 AM to 3 PM
Anytime Anytime Anytime
014C 139.46 138.97 CHANGE WIDTH e/o BOX ELDER CREEK I-25 INTERCHANGE FORT COLLINS WB
9 PM to 5 AM
9 AM to 3 PM
9 PM to 5 AM
9 AM to 3 PM
9 PM to 5 AM
9 AM to 3 PM
Anytime Anytime Anytime
014C 139.46 142.18 CHANGE WIDTH e/o BOX ELDER CREEK WELD CR 1 11000 2 Both
9 PM to 5 AM
8 AM to 3 PM
9 PM to 5 AM
9 AM to 2 PM
9 PM to 5 AM Anytime Anytime 9 PM to 5 AM
014C 142.18 144.15 WELD CR 1 SH 257 WELD COUNTY 9700 2 Both 9 PM to 5 PM
9 PM to 5 AM
8 AM to 3 PM
9 PM to 5 AM Anytime Anytime 9 PM to 8 AM
014C 144.15 152.16 SH 257 WELD COUNTY WELD CR 33 8500 2 Both Anytime 9 PM to 5 PM 9 PM to 5 AM Anytime Anytime 9 PM to 9 AM
014C 152.16 153.37 WELD CR 33 SH 85 AULT 5800 2 Both Anytime Anytime 7 PM to 6 AM Anytime Anytime 4 PM to 11 AM
014C 153.37 222.20 SH 85 AULT LOGAN CR 11 4000 2 Both Anytime Anytime 6 PM to 4 PM Anytime Anytime Anytime
014C 222.20 229.23 LOGAN CR 11 LOGAN CR 25 1600 3 Both Anytime Anytime Anytime Anytime Anytime Anytime
014C 229.23 234.26 LOGAN CR 25 LOGAN CR 35 3800 2 Both Anytime Anytime 9 PM to 11 AM Anytime Anytime Anytime
014C 234.26 236.92 LOGAN CR 35 US 6 NE (3RD ST) RD SE (MAIN ST) -- END SH 14 17000 4 Both Anytime Anytime Anytime Anytime Anytime Anytime
023A 0.00 17.84 US 385 HOLYOKE COLORADO NEBRASKA STATE LINE 510 2 Both Anytime Anytime Anytime Anytime Anytime Anytime
024B 419.32 437.00 CR 12.00 W/O SEIBERT SH 57 (KANSAS AVE) IN STRATTON 760 2 Both Anytime Anytime Anytime Anytime Anytime Anytime
024C 437.55 454.87 SH 57 (CR 31) IN STRATTON US 385 IN BURLINGTON 2800 2 Both Anytime Anytime Anytime Anytime Anytime Anytime
024D 456.00 457.29 7TH ST IN BURLINGTON NORTH I-70 FRONTAGE ROAD IN BURLINGTON 4000 2 Both Anytime Anytime Anytime Anytime Anytime Anytime
024F 0.00 0.48 US 40 IN LIMON I-70 INTERCHANGE (#259) 6100 2 Both Anytime Anytime Anytime Anytime Anytime Anytime
024G 350.58 377.40 EL PASO / ELBERT COUNTY LINE N AVE - LIMON 4700 2 Both Anytime Anytime
9 PM to 5 AM
1 PM to 3 PM
Anytime Anytime 9 PM to 5 AM
024G 377.40 379.29 N AVE - LIMON LAKE CREEK 6400 2 Both Anytime Anytime Anytime Anytime Anytime Anytime
20000 4
4
4
22000
34000
41000
4
31000
40000
4
4
Page C-2

CDOT Region 4 Appendix C - Spring/Summer Single-Lane Closure Allowed Hours Lane Closure Strategy - 4th Ed.
0.0 - 0.5 mile
Lane Closure
0.5 - 1.0 mile
Lane Closure
> 1.0 mile
Lane Closure
0.0 - 0.5 mile
Lane Closure
0.5 - 1.0 mile
Lane Closure
> 1.0 mile
Lane Closure
Spring/Summer: April – October, Fall/Winter: November – March
State
Highway
Number
Beginning of
Section MP#
End of
Section
MP #
Beginning of Section - Description End of Section - Description Dir.
Spring/Summer Weekday Allowed Hours: Spring/Summer Weekend Allowed Hours:
# of
Lanes
2018 Volume
(AADT)
024G 379.29 380.46 LAKE CREEK I-70 INTERCHANGE (#363) 1900 2 Both Anytime Anytime Anytime Anytime Anytime Anytime
025A 229.11 235.15 SH 7/ BASELINE RD BROOMFIELD COUNTY SH 52 / DACONO / FT LUPTON NB 9 PM to 5 AM 9 PM to 5 AM 9 PM to 5 AM 9 PM to 5 AM 9 PM to 5 AM 9 PM to 5 AM
025A 235.15 229.11 SH 52 / DACONO / FT LUPTON SH 7/ BASELINE RD BROOMFIELD COUNTY SB 9 PM to 5 AM 9 PM to 5 AM 9 PM to 5 AM 9 PM to 5 AM 9 PM to 5 AM 9 PM to 5 AM
025A 235.15 243.15 SH 52 / DACONO / FT LUPTON SH 66 NB 9 PM to 5 AM 9 PM to 5 AM 9 PM to 5 AM 9 PM to 5 AM 9 PM to 5 AM 9 PM to 5 AM
025A 243.15 235.15 SH 66 SH 52 / DACONO / FT LUPTON SB 9 PM to 5 AM 9 PM to 5 AM 9 PM to 5 AM 9 PM to 5 AM 9 PM to 5 AM 9 PM to 5 AM
025A 243.15 247.00 SH 66 SOUTHBOUND PASSING LANE END NB 10 PM to 5 AM 10 PM to 5 AM 10 PM to 5 AM 10 PM to 5 AM 10 PM to 5 AM 10 PM to 5 AM
025A 247.00 243.15 SOUTHBOUND PASSING LANE END SH 66 SB 9 PM to 5 AM 9 PM to 5 AM 9 PM to 5 AM 9 PM to 5 AM 9 PM to 5 AM 9 PM to 5 AM
025A 247.00 250.00 SOUTHBOUND PASSING LANE END SOUTHBOUND PASSING LANE START NB 10 PM to 5 AM 10 PM to 5 AM 10 PM to 5 AM 10 PM to 5 AM 10 PM to 5 AM 10 PM to 5 AM
025A 250.00 247.00 SOUTHBOUND PASSING LANE START SOUTHBOUND PASSING LANE END SB 9 PM to 5 AM 9 PM to 5 AM 9 PM to 5 AM 9 PM to 5 AM 9 PM to 5 AM 9 PM to 5 AM
025A 250.00 265.41 SOUTHBOUND PASSING LANE START HARMONY ROAD INTERCHANGE NB 9 PM to 5 AM 9 PM to 5 AM 9 PM to 5 AM 10 PM to 5 AM 10 PM to 5 AM 10 PM to 5 AM
025A 265.41 250.00 HARMONY ROAD INTERCHANGE SOUTHBOUND PASSING LANE START SB 9 PM to 5 AM 9 PM to 5 AM 9 PM to 5 AM 9 PM to 5 AM 9 PM to 5 AM 9 PM to 5 AM
025A 265.41 271.37 HARMONY ROAD INTERCHANGE MTN VISTA DRIVE INTERCHANGE NB 9 PM to 5 AM 9 PM to 5 AM 9 PM to 5 AM 9 PM to 5 AM 9 PM to 5 AM 9 PM to 5 AM
025A 271.37 265.41 MTN VISTA DRIVE INTERCHANGE HARMONY ROAD INTERCHANGE SB 9 PM to 5 AM 9 PM to 5 AM 9 PM to 5 AM 9 PM to 5 AM 9 PM to 5 AM 9 PM to 5 AM
025A 271.37 277.94 MTN VISTA DRIVE INTERCHANGE SH 1 / WELLINGTON NB 6 PM to 4 PM 6 PM to 4 PM 6 PM to 4 PM 5 PM to Noon 5 PM to Noon 5 PM to Noon
025A 277.94 271.37 SH 1 / WELLINGTON MTN VISTA DRIVE INTERCHANGE SB
6 PM to 7 AM
9 AM to 4 PM
6 PM to 7 AM
9 AM to 4 PM
6 PM to 7 AM
9 AM to 4 PM
5 PM to 11 AM 5 PM to 11 AM 5 PM to 11 AM
025A 277.94 298.88 SH 1 / WELLINGTON WYOMING STATE LINE NB Anytime Anytime Anytime Anytime Anytime Anytime
025A 298.88 277.94 WYOMING STATE LINE SH 1 / WELLINGTON SB Anytime Anytime Anytime Anytime Anytime Anytime
034A 57.69 59.19 RMNP TOLLGATE FISH HATCHERY RD ESTES PARK 2800 2 Both 9 PM to 5 AM 9 PM to 5 AM 9 PM to 5 AM 9 PM to 5 AM 9 PM to 5 AM 9 PM to 5 AM
034A 59.19 60.97 FISH HATCHERY RD ESTES PARK BEGIN US 34 BUSINESS ESTES PARK 5100 2 Both 9 PM to 5 AM 9 PM to 5 AM 9 PM to 5 AM 9 PM to 5 AM 9 PM to 5 AM 9 PM to 5 AM
034A 60.97 61.93 BEGIN US 34 BUSINESS ESTES PARK BIG HORN DRIVE ESTES PARK 3900 2 Both 9 PM to 5 AM 9 PM to 5 AM 9 PM to 5 AM 9 PM to 5 AM 9 PM to 5 AM 9 PM to 5 AM
034A 61.93 62.51 BIG HORN DRIVE ESTES PARK E ELKHORN AVE ESTES PARK 6700 2 Both 9 PM to 5 AM 9 PM to 5 AM 9 PM to 5 AM 9 PM to 5 AM 9 PM to 5 AM 9 PM to 5 AM
034A 62.51 63.19 E ELKHORN AVE ESTES PARK SUMMIT DR ESTES PARK EB 9 PM to 5 AM 9 PM to 5 AM 9 PM to 5 AM 9 PM to 5 AM 9 PM to 5 AM 9 PM to 5 AM
034A 63.19 62.51 SUMMIT DR ESTES PARK E ELKHORN AVE ESTES PARK WB 9 PM to 5 AM 9 PM to 5 AM 9 PM to 5 AM 9 PM to 5 AM 9 PM to 5 AM 9 PM to 5 AM
034A 63.19 64.23 SUMMIT DR ESTES PARK CR 63E ESTES PARK 12000 3 Both 9 PM to 5 AM 9 PM to 5 AM 9 PM to 5 AM 9 PM to 5 AM 9 PM to 5 AM 9 PM to 5 AM
034A 64.23 75.58 CR 63E ESTES PARK DEVILS GULCH RD DRAKE 6600 2 Both 9 PM to 5 AM 9 PM to 5 AM 9 PM to 5 AM 9 PM to 5 AM 9 PM to 5 AM 9 PM to 5 AM
034A 75.58 83.50 DEVILS GULCH RD DRAKE START 4-LANE SECTION 5200 2 Both 9 PM to 5 AM 9 PM to 5 AM 9 PM to 5 AM 9 PM to 5 AM 9 PM to 5 AM 9 PM to 5 AM
034A 83.50 84.10 START 4-LANE SECTION END 4-LANE SECTION 5200 4 Both 9 PM to 5 AM 9 PM to 5 AM 9 PM to 5 AM 9 PM to 5 AM 9 PM to 5 AM 9 PM to 5 AM
034A 84.10 84.76 END 4-LANE SECTION LARIMER CR 29 5200 2 Both 9 PM to 5 AM 9 PM to 5 AM 9 PM to 5 AM 9 PM to 5 AM 9 PM to 5 AM 9 PM to 5 AM
034A 84.76 87.69 LARIMER CR 29 LARIMER CR 27 8800 2 Both 9 PM to 5 AM 9 PM to 5 AM 9 PM to 5 AM 9 PM to 5 AM 9 PM to 5 AM 9 PM to 5 AM
034A 87.69 88.68 LARIMER CR 27 MORNING DR LOVELAND 12000 2 Both 9 PM to 5 AM 9 PM to 5 AM 9 PM to 5 AM 6 PM to 9 AM 7 PM to 9 AM 9 PM to 7 AM
034A 88.68 89.39 MORNING DR LOVELAND NAMAQUA AVE LOVELAND EB 9 PM to 5 AM 9 PM to 5 AM 9 PM to 5 AM Anytime Anytime Anytime
034A 89.39 88.68 NAMAQUA AVE LOVELAND MORNING DR LOVELAND WB 9 PM to 5 AM 9 PM to 5 AM 9 PM to 5 AM Anytime Anytime Anytime
4
5
6
4
127000
84000
18000
104000
16000
6
84000 4
25000
34000
71000
87000 4
4
4
4
Page C-3
CDOT Region 4 Appendix C - Spring/Summer Single-Lane Closure Allowed Hours Lane Closure Strategy - 4th Ed.
0.0 - 0.5 mile
Lane Closure
0.5 - 1.0 mile
Lane Closure
> 1.0 mile
Lane Closure
0.0 - 0.5 mile
Lane Closure
0.5 - 1.0 mile
Lane Closure
> 1.0 mile
Lane Closure
Spring/Summer: April – October, Fall/Winter: November – March
State
Highway
Number
Beginning of
Section MP#
End of
Section
MP #
Beginning of Section - Description End of Section - Description Dir.
Spring/Summer Weekday Allowed Hours: Spring/Summer Weekend Allowed Hours:
# of
Lanes
2018 Volume
(AADT)
034A 89.39 90.28 NAMAQUA AVE LOVELAND VAN BUREN AVE LOVELAND EB 9 PM to 5 AM 9 PM to 5 AM 9 PM to 5 AM Anytime Anytime Anytime
034A 90.28 89.39 VAN BUREN AVE LOVELAND NAMAQUA AVE LOVELAND WB 9 PM to 5 AM 9 PM to 5 AM 9 PM to 5 AM Anytime Anytime Anytime
034A 90.28 96.03 VAN BUREN AVE LOVELAND WEST I-25 FRONTAGE ROAD EB 9 PM to 5 AM 9 PM to 5 AM 9 PM to 5 AM 9 PM to Noon 9 PM to Noon 9 PM to Noon
034A 96.03 90.28 WEST I-25 FRONTAGE ROAD VAN BUREN AVE LOVELAND WB 9 PM to 5 AM 9 PM to 5 AM 9 PM to 5 AM 7 PM to 9 AM 7 PM to 9 AM 7 PM to 9 AM
034A 96.03 98.84 WEST I-25 FRONTAGE ROAD LARIMER-WELD COUNTY LINE EB 9 PM to 5 AM 9 PM to 5 AM 9 PM to 5 AM 8 PM to Noon 8 PM to Noon 8 PM to Noon
034A 98.84 96.03 LARIMER-WELD COUNTY LINE WEST I-25 FRONTAGE ROAD WB 9 PM to 5 AM 9 PM to 5 AM 9 PM to 5 AM 7 PM to 9 AM 7 PM to 9 AM 7 PM to 9 AM
034A 98.84 102.48 LARIMER-WELD COUNTY LINE US 34D INTERCHANGE GREELEY EB 9 PM to 5 AM 9 PM to 5 AM 9 PM to 5 AM 8 PM to Noon 8 PM to Noon 8 PM to Noon
034A 102.48 98.84 US 34D INTERCHANGE GREELEY LARIMER-WELD COUNTY LINE WB 9 PM to 5 AM 9 PM to 5 AM 9 PM to 5 AM 6 PM to 10 AM 6 PM to 10 AM 6 PM to 10 AM
034A 102.48 102.80 US 34D INTERCHANGE GREELEY SH 257 (ENTER GREELEY) EB
9 PM to 5 AM
9 AM to 4 PM
9 PM to 5 AM
9 AM to 4 PM
9 PM to 5 AM
9 AM to 4 PM
Anytime Anytime Anytime
034A 102.80 102.48 SH 257 (ENTER GREELEY) US 34D INTERCHANGE GREELEY WB
9 PM to 5 AM
9 AM to 4 PM
9 PM to 5 AM
9 AM to 4 PM
9 PM to 5 AM
9 AM to 4 PM
Anytime Anytime Anytime
034A 102.80 107.61 SH 257 (ENTER GREELEY) 65TH AVE GREELEY EB
9 PM to 5 AM
9 AM to 4 PM
9 PM to 5 AM
9 AM to 4 PM
9 PM to 5 AM
9 AM to 4 PM
6 PM to 3 PM 6 PM to 3 PM 6 PM to 3 PM
034A 107.61 102.80 65TH AVE GREELEY SH 257 (ENTER GREELEY) WB
9 PM to 5 AM
9 AM to 4 PM
9 PM to 5 AM
9 AM to 4 PM
9 PM to 5 AM
9 AM to 4 PM
5 PM to Noon 5 PM to Noon 5 PM to Noon
034A 107.61 112.23 65TH AVE GREELEY 11TH AVE GREELEY EB 9 PM to 5 AM 9 PM to 5 AM 9 PM to 5 AM 7 PM to 1 PM 7 PM to 1 PM 7 PM to 1 PM
034A 112.23 107.61 11TH AVE GREELEY 65TH AVE GREELEY WB 9 PM to 5 AM 9 PM to 5 AM 9 PM to 5 AM 5 PM to 10 AM 5 PM to 10 AM 5 PM to 10 AM
034A 112.23 113.14 11TH AVE GREELEY EB SH 85 OVERPASS GREELEY EB 9 PM to 5 AM 9 PM to 5 AM 9 PM to 5 AM 7 PM to 2 PM 7 PM to 2 PM 7 PM to 2 PM
034A 113.14 112.23 EB SH 85 OVERPASS GREELEY 11TH AVE GREELEY WB 9 PM to 5 AM 9 PM to 5 AM 9 PM to 5 AM 5 PM to 11 AM 5 PM to 11 AM 5 PM to 11 AM
034A 113.14 135.61 EB SH 85 OVERPASS GREELEY MORGAN CR 386 EB
9 PM to 5 AM
9 AM to 4 PM
9 PM to 5 AM
9 AM to 4 PM
9 PM to 5 AM
9 AM to 4 PM
Anytime Anytime Anytime
034A 135.61 113.14 MORGAN CR 386 EB SH 85 OVERPASS GREELEY WB
9 PM to 5 AM
9 AM to 4 PM
9 PM to 5 AM
9 AM to 4 PM
9 PM to 5 AM
9 AM to 4 PM
Anytime Anytime Anytime
034A 135.61 149.63 MORGAN CR 386 SH 39 OVERPASS WIGGINS 5700 2 Both
9 PM to 5 AM
9 AM to 4 PM
9 PM to 5 AM
9 AM to 4 PM
9 PM to 5 AM
9 AM to 4 PM
Anytime Anytime 6 PM to 11 AM
034B 159.00 162.26 I-76 FORT MORGAN INTERCHANGE LANE ST FORT MORGAN 3600 2 Both Anytime Anytime Anytime Anytime Anytime Anytime
034B 162.26 168.47 LANE ST FORT MORGAN CR 24 FORT MORGAN 12000 4 Both Anytime Anytime Anytime Anytime Anytime Anytime
034B 168.47 172.74 CR 24 FORT MORGAN EDMUNDS ST BRUSH 6800 2 Both Anytime Anytime 9 PM to 5 AM Anytime Anytime 9 PM to 8 AM
034B 172.74 173.85 EDMUNDS ST BRUSH US 34 SPUR TO I-76 BRUSH 4300 4 Both Anytime Anytime Anytime Anytime Anytime Anytime
034B 173.85 195.84 US 34 SPUR TO I-76 BRUSH CUSTER AVE AKRON 3200 2 Both Anytime Anytime Anytime Anytime Anytime Anytime
034B 195.84 204.06 CUSTER AVE AKRON CR KK PLATNER WASHINGTON COUNTY 5700 4 Both Anytime Anytime Anytime Anytime Anytime Anytime
034B 204.06 222.77 CR KK PLATNER WASHINGTON COUNTY S DATE ST YUMA 2900 2 Both Anytime Anytime Anytime Anytime Anytime Anytime
034B 222.77 223.35 S DATE ST YUMA SH 59 YUMA 7100 4 Both Anytime Anytime Anytime Anytime Anytime Anytime
034B 223.35 223.84 SH 59 YUMA IDLEWILD YUMA 6000 2 Both Anytime Anytime 9 PM to 8 AM Anytime Anytime 11 AM to 10 AM
034B 223.84 248.06 IDLEWILD YUMA CR 35 WRAY 3100 2 Both Anytime Anytime Anytime Anytime Anytime Anytime
034B 248.06 250.48 CR 35 WRAY DOUGLAS ST WRAY 4800 2 Both Anytime Anytime 9 PM to 8 AM Anytime Anytime 11 AM to 10 AM
034B 250.48 259.51 DOUGLAS ST WRAY COLORADO NEBRASKA STATE LINE 3000 2 Both Anytime Anytime Anytime Anytime Anytime Anytime
034C 1.30 1.69 MAC GREGOR AVE ESTES PARK ST VRAIN AVENUE EB 9 PM to 5 AM 9 PM to 5 AM 9 PM to 5 AM 9 PM to 5 AM 9 PM to 5 AM 9 PM to 5 AM
034C 1.69 1.30 ST VRAIN AVENUE MAC GREGOR AVE ESTES PARK WB 9 PM to 5 AM 9 PM to 5 AM 9 PM to 5 AM 9 PM to 5 AM 9 PM to 5 AM 9 PM to 5 AM
4
4
4
4
4
4
4
4
4
4
43000
40000
14000
35000
28000
49000
52000
54000
25000
18000
Page C-4

CDOT Region 4 Appendix C - Spring/Summer Single-Lane Closure Allowed Hours Lane Closure Strategy - 4th Ed.
0.0 - 0.5 mile
Lane Closure
0.5 - 1.0 mile
Lane Closure
> 1.0 mile
Lane Closure
0.0 - 0.5 mile
Lane Closure
0.5 - 1.0 mile
Lane Closure
> 1.0 mile
Lane Closure
Spring/Summer: April – October, Fall/Winter: November – March
State
Highway
Number
Beginning of
Section MP#
End of
Section
MP #
Beginning of Section - Description End of Section - Description Dir.
Spring/Summer Weekday Allowed Hours: Spring/Summer Weekend Allowed Hours:
# of
Lanes
2018 Volume
(AADT)
034D 0.00 1.86 BEGIN GREELEY BUSINESS LOOP SH 257 WELD COUNTY EB 9 PM to 5 AM 9 PM to 5 AM 9 PM to 5 AM 5 PM to 9 AM 5 PM to 9 AM 5 PM to 9 AM
034D 1.86 0.00 SH 257 WELD COUNTY BEGIN GREELEY BUSINESS LOOP WB 9 PM to 5 AM 9 PM to 5 AM 9 PM to 5 AM 5 PM to 9 AM 5 PM to 9 AM 5 PM to 9 AM
034D 1.86 4.67 SH 257 WELD COUNTY 71ST AVE GREELEY EB 9 PM to 5 AM 9 PM to 5 AM 9 PM to 5 AM 5 PM to 9 AM 5 PM to 9 AM 5 PM to 9 AM
034D 4.67 1.86 71ST AVE GREELEY SH 257 WELD COUNTY WB 9 PM to 5 AM 9 PM to 5 AM 9 PM to 5 AM 5 PM to 9 AM 5 PM to 9 AM 5 PM to 9 AM
034D 4.67 8.25 71ST AVE GREELEY 28TH AVE GREELEY EB
9 PM to 5 AM
9 AM to 1 PM
9 PM to 5 AM
9 AM to 1 PM
9 PM to 5 AM
9 AM to 1 PM
5 PM to 9 AM 5 PM to 9 AM 5 PM to 9 AM
034D 8.25 4.67 28TH AVE GREELEY 71ST AVE GREELEY WB
9 PM to 5 AM
9 AM to 1 PM
9 PM to 5 AM
9 AM to 1 PM
9 PM to 5 AM
9 AM to 1 PM
5 PM to 9 AM 5 PM to 9 AM 5 PM to 9 AM
034D 8.25 8.77 28TH AVE GREELEY BEGIN 1-WAY EB GREELEY EB
9 PM to 5 AM
9 AM to 4 PM
9 PM to 5 AM
9 AM to 4 PM
9 PM to 5 AM
9 AM to 4 PM
5 PM to 9 AM 5 PM to 9 AM 5 PM to 9 AM
034D 8.77 8.25 BEGIN 1-WAY WB GREELEY 28TH AVE GREELEY WB
9 PM to 5 AM
9 AM to 4 PM
9 PM to 5 AM
9 AM to 4 PM
9 PM to 5 AM
9 AM to 4 PM
5 PM to 9 AM 5 PM to 9 AM 5 PM to 9 AM
034D 8.77 10.00 BEGIN 1-WAY EB (10TH ST) GREELEY 10TH AVE GREELEY 10000 3 EB 9 PM to 5 AM 9 PM to 5 AM 9 PM to 5 AM Anytime Anytime Anytime
034D 10.00 11.06 10TH AVE GREELEY US 85 BUSINESS LOOP EB 9 PM to 5 AM 9 PM to 5 AM 9 PM to 5 AM Anytime Anytime Anytime
034D 11.06 10.00 US 85 BUSINESS LOOP 10TH AVE GREELEY WB 9 PM to 5 AM 9 PM to 5 AM 9 PM to 5 AM Anytime Anytime Anytime
034D 11.06 14.71 US 85 BUSINESS LOOP US 34A 5300 2 Both 9 PM to 5 AM 9 PM to 5 AM 9 PM to 5 AM Anytime Anytime 5 PM to Noon
034E 0.00 0.93 US 34 I-76 BRUSH INTERCHANGE 3000 2 Both Anytime Anytime Anytime Anytime Anytime Anytime
034F 0.00 0.03 US 34 END OF CDOT MAINTENANCE 1700 2 Both 9 PM to 5 AM 9 PM to 5 AM 9 PM to 5 AM 5 PM to 9 AM 5 PM to 9 AM 5 PM to 9 AM
034Z 0.00 1.30 BEGIN 1-WAY WB (9TH ST) GREELEY WEST OF 23RD AVE GREELEY 11000 3 WB 9 PM to 5 AM 9 PM to 5 AM 9 PM to 5 AM Anytime Anytime Anytime
036A 3.09 4.96 RMNP TOLLGATE SH 66 SOUTHWEST 6400 2 Both 9 PM to 5 AM 9 PM to 5 AM 9 PM to 5 AM
3 PM to 11 AM
Noon to 2 PM
5 PM to 10 AM 9 PM to 8 AM
036A 4.96 6.38 SH 66 SOUTHWEST DAVIS ST ESTES PARK 12000 2 Both 9 PM to 5 AM 9 PM to 5 AM 9 PM to 5 AM 9 PM to 5 AM 9 PM to 5 AM 9 PM to 5 AM
036A 6.38 6.98 DAVIS ST ESTES PARK US 34 BUSINESS LOOP 11000 2 Both 9 PM to 5 AM 9 PM to 5 AM 9 PM to 5 AM 9 PM to 5 AM 9 PM to 5 AM 9 PM to 5 AM
036B 0.00 0.71 ELKHORN AVE ESTES PARK 4TH ST ESTES PARK EB 9 PM to 5 AM 9 PM to 5 AM 9 PM to 5 AM 9 PM to 2 PM 9 PM to 2 PM 9 PM to 2 PM
036B 0.71 0.00 4TH ST ESTES PARK ELKHORN AVE ESTES PARK WB 9 PM to 5 AM 9 PM to 5 AM 9 PM to 5 AM 9 PM to 9 AM 9 PM to 9 AM 9 PM to 9 AM
036B 0.71 20.30 SH 7 ESTES PARK BEGIN 1-WAY PAIR LYONS 9900 2 Both 9 PM to 5 AM 9 PM to 5 AM 9 PM to 5 AM 9 PM to 9 AM 9 PM to 9 AM 9 PM to 7 AM
036B 20.30 20.72 BEGIN 1-WAY PAIR LYONS END 1-WAY PAIR LYONS 7000 2 EB 9 PM to 5 AM 9 PM to 5 AM 9 PM to 5 AM 9 PM to 4 PM 9 PM to 4 PM 9 PM to 4 PM
036B 20.72 21.76 END 1-WAY PAIR LYONS JCT SH 66 BOULDER COUNTY EB 9 PM to 5 AM 9 PM to 5 AM 9 PM to 5 AM 9 PM to Noon 9 PM to Noon 9 PM to Noon
036B 21.76 20.72 JCT SH 66 BOULDER COUNTY END 1-WAY PAIR LYONS WB 9 PM to 5 AM 9 PM to 5 AM 9 PM to 5 AM 9 PM to 9 AM 9 PM to 9 AM 9 PM to 9 AM
036B 21.76 32.18 JCT SH 66 BOULDER COUNTY BROADWAY 14000 2 Both 9 PM to 5 AM 9 PM to 5 AM 9 PM to 5 AM 9 PM to 8 AM 9 PM to 8 AM 10 PM to 7 AM
036B 32.18 34.76 BROADWAY KALMIA PKWY BOULDER 24000 2 Both 9 PM to 5 AM 9 PM to 5 AM 10 PM to 5 AM 9 PM to 7 AM 10 PM to 7 AM 11 PM to 6 AM
036B 34.76 35.51 KALMIA PKWY BOULDER VALMONT RD BOULDER EB 9 PM to 5 AM 9 PM to 5 AM 9 PM to 5 AM 9 PM to Noon 9 PM to Noon 9 PM to Noon
036B 35.51 34.76 VALMONT RD BOULDER KALMIA PKWY BOULDER WB 9 PM to 5 AM 9 PM to 5 AM 9 PM to 5 AM 9 PM to 11 AM 9 PM to 11 AM 9 PM to 11 AM
036B 35.51 35.98 VALMONT RD BOULDER PEARL ST BOULDER EB 9 PM to 5 AM 9 PM to 5 AM 9 PM to 5 AM 9 PM to 11 AM 9 PM to 11 AM 9 PM to 11 AM
036B 35.98 35.51 PEARL ST BOULDER VALMONT RD BOULDER WB 9 PM to 5 AM 9 PM to 5 AM 9 PM to 5 AM 9 PM to 10 AM 9 PM to 10 AM 9 PM to 10 AM
036B 35.98 36.34 PEARL ST BOULDER SH 119 EB 9 PM to 5 AM 9 PM to 5 AM 9 PM to 5 AM 9 PM to 10 AM 9 PM to 10 AM 9 PM to 10 AM
036B 36.34 35.98 SH 119 PEARL ST BOULDER WB 9 PM to 5 AM 9 PM to 5 AM 9 PM to 5 AM 9 PM to 9 AM 9 PM to 9 AM 9 PM to 9 AM
4
4
4
4
30000
26000
22000
23000
17000
28000
32000
40000
4
4
4
4
16000
17000 4
4
Page C-5

CDOT Region 4 Appendix C - Spring/Summer Single-Lane Closure Allowed Hours Lane Closure Strategy - 4th Ed.
0.0 - 0.5 mile
Lane Closure
0.5 - 1.0 mile
Lane Closure
> 1.0 mile
Lane Closure
0.0 - 0.5 mile
Lane Closure
0.5 - 1.0 mile
Lane Closure
> 1.0 mile
Lane Closure
Spring/Summer: April – October, Fall/Winter: November – March
State
Highway
Number
Beginning of
Section MP#
End of
Section
MP #
Beginning of Section - Description End of Section - Description Dir.
Spring/Summer Weekday Allowed Hours: Spring/Summer Weekend Allowed Hours:
# of
Lanes
2018 Volume
(AADT)
036B 36.34 36.53 SH 119 SH 7 BOULDER COUNTY EAST EB 9 PM to 5 AM 9 PM to 5 AM 9 PM to 5 AM 9 PM to Noon 9 PM to Noon 9 PM to Noon
036B 36.53 36.34 SH 7 BOULDER COUNTY EAST SH 119 WB 9 PM to 5 AM 9 PM to 5 AM 9 PM to 5 AM 9 PM to 10 AM 9 PM to 10 AM 9 PM to 10 AM
036B 36.53 37.60 SH 7 BOULDER COUNTY EAST BASELINE ROAD INTERCHANGE BOULDER EB 9 PM to 5 AM 9 PM to 5 AM 9 PM to 5 AM 9 PM to Noon 9 PM to Noon 9 PM to Noon
036B 37.60 36.53 BASELINE ROAD INTERCHANGE BOULDER SH 7 BOULDER COUNTY EAST WB 9 PM to 5 AM 9 PM to 5 AM 9 PM to 5 AM 9 PM to 10 AM 9 PM to 10 AM 9 PM to 10 AM
036B 37.60 39.20 BASELINE ROAD INTERCHANGE BOULDER FOOTHILLS PARKWAY INTERCHANGE EB 6 PM to 6 AM 6 PM to 6 AM 6 PM to 6 AM 6 PM to 9 AM 6 PM to 9 AM 6 PM to 9 AM
036B 39.20 37.60 FOOTHILLS PARKWAY INTERCHANGE BASELINE ROAD INTERCHANGE BOULDER WB
7 PM to 6 AM
9 AM to Noon
7 PM to 6 AM
9 AM to Noon
7 PM to 6 AM
9 AM to Noon
7 PM to 11 AM 7 PM to 11 AM 7 PM to 11 AM
036B 39.20 48.04 FOOTHILLS PARKWAY INTERCHANGE BROOMFIELD INTERCHANGE EB 8 PM to 6 AM 8 PM to 6 AM 8 PM to 6 AM 8 PM to 7 AM 8 PM to 7 AM 8 PM to 7 AM
036B 48.04 39.20 BROOMFIELD INTERCHANGE FOOTHILLS PARKWAY INTERCHANGE WB 9 PM to 6 AM 9 PM to 6 AM 9 PM to 6 AM 9 PM to 9 AM 9 PM to 9 AM 9 PM to 9 AM
036D 129.57 135.58 ADAMS CR 72 SH 71 LAST CHANCE 630 2 Both Anytime Anytime Anytime Anytime Anytime Anytime
036D 135.58 224.38 SH 71 LAST CHANCE KANSAS STATE LINE 840 3 Both Anytime Anytime Anytime Anytime Anytime Anytime
036E 0.00 0.28 US 36/BASELINE RD BOULDER SH 93 EB Anytime Anytime Anytime Anytime Anytime Anytime
036E 0.28 0.00 SH 93 US 36/BASELINE RD BOULDER WB Anytime Anytime Anytime Anytime Anytime Anytime
036Z 0.00 0.30 BEGIN 1 WAY WB SECTION LYONS END 1 WAY WB SECTION LYONS 7000 2 WB 9 PM to 5 PM 9 PM to 5 PM 9 PM to 5 PM 9 PM to 9 AM 9 PM to 9 AM 9 PM to 9 AM
039A 0.00 1.34 US 6 & SH 52 MORGAN COUNTY MORGAN CR S 3900 2 Both Anytime Anytime
6 PM to Noon
1 PM to 3 PM
Anytime Anytime Anytime
039A 1.34 7.57 MORGAN CR S SH 7 E & W BEGIN SH 42 1100 2 Both Anytime Anytime Anytime Anytime Anytime Anytime
040F 361.00 363.00 I-70 FRONTAGE ROAD (NEAR I-70 MP 338) I-70 INTERCHANGE (#340) IN AGATE 120 2 Both Anytime Anytime Anytime Anytime Anytime Anytime
040G 381.27 382.18 I-70 FRONTAGE ROAD (I-70 MP 358) US 24 IN LIMON 210 2 Both Anytime Anytime Anytime Anytime Anytime Anytime
040H 385.34 399.09 I-70 INTERCHANGE (#363) IN LIMON RD NE (1ST AVE.) (SHELL STREET) 6300 2 Both Anytime Anytime 7 PM to 7 AM Anytime Anytime 7 PM to 8 AM
040H 399.51 444.89 RD NE AND SW (3RD AVE) (BARRON ST) RD N AND S (CO RD 9) 5900 2 Both Anytime Anytime 7 PM to 7 AM Anytime Anytime 7 PM to 8 AM
040H 446.05 486.87 RD S (ST 3) KANSAS STATE LINE 1900 2 Both Anytime Anytime Anytime Anytime Anytime Anytime
042A 0.00 1.96 SH 7 S BOULDER RD LOUISVILLE 20000 2 Both 9 PM to 5 AM 9 PM to 5 AM 9 PM to 5 AM 9 PM to 9 AM 9 PM to 9 AM 9 PM to 7 AM
042A 1.96 2.62 S BOULDER RD LOUISVILLE W PINE ST LOUISVILLE 18000 2 Both 9 PM to 5 AM 9 PM to 5 AM 9 PM to 5 AM 9 PM to 10 AM 9 PM to 9 AM 9 PM to 7 AM
042A 2.62 4.88 W PINE ST LOUISVILLE US 287 LAFAYETTE 12000 2 Both 9 PM to 5 AM 9 PM to 5 AM 9 PM to 5 AM 9 PM to 11 AM 9 PM to 11 AM 9 PM to 8 AM
052A 0.00 4.67 SH 119 (DIAGONAL HIGHWAY) US 287 11000 2 Both
9 PM to 5 AM
8 AM to 3 PM
9 PM to 5 AM
9 AM to 2 PM
7 PM to 5 AM Anytime 6 PM to 10 AM 9 PM to 8 AM
052A 4.67 11.17 US 287 I-25 DACONO INTERCHANGE 19000 2 Both 9 PM to 5 AM 9 PM to 5 AM 9 PM to 4 AM 8 PM to 9 AM 9 PM to 8 AM 11 PM to 6 AM
052A 11.17 13.83 I-25 DACONO INTERCHANGE GLEN CREIGHTON DR DACONO 19000 2 Both 9 PM to 5 AM 9 PM to 5 AM 10 PM to 4 AM 8 PM to 8 AM 9 PM to 8 AM 11 PM to 6 AM
052A 13.83 18.44 GLEN CREIGHTON DR DACONO WELD CR 23 12000 2 Both
9 PM to 5 AM
8 AM to 2 PM
9 PM to 5 AM 9 PM to 5 AM Anytime 6 PM to 11 AM 9 PM to 7 AM
052A 18.44 19.96 WELD CR 23 SH 85 FT LUPTON 11000 2 Both
9 PM to 5 AM
8 AM to 3 PM
9 PM to 5 AM
9 AM to 2 PM
9 PM to 5 AM Anytime 6 PM to 3 PM 9 PM to 8 AM
052A 19.96 20.67 SH 85 FT LUPTON HARRISON AVE FORT LUPTON 13000 2 Both
9 PM to 5 AM
8 AM to 3 PM
9 PM to 5 AM 9 PM to 5 AM 6 PM to 9 AM 7 PM to 8 AM 10 PM to 6 AM
052A 20.67 25.46 HARRISON AVE FORT LUPTON WELD CR 37 13000 2 Both
9 PM to 5 AM
8 AM to Noon
9 PM to 5 AM 9 PM to 5 AM 6 PM to 9 AM 8 PM to 8 AM 10 PM to 6 AM
052A 25.46 29.63 WELD CR 37 BEECH ST HUDSON 8800 2 Both Anytime
6 PM to 7 AM
9 AM to 4 PM
8 PM to 6 AM Anytime 6 PM to 10 AM 9 PM to 7 AM
052A 29.63 36.92 BEECH ST HUDSON WELD CR 59 3900 2 Both Anytime Anytime Anytime Anytime Anytime Anytime
052A 36.92 72.58 WELD CR 59 MORGAN CR Q WIGGINS 2100 2 Both Anytime Anytime Anytime Anytime Anytime Anytime
4
4
49000
4
4
46000
57000
94000
636000
Page C-6

CDOT Region 4 Appendix C - Spring/Summer Single-Lane Closure Allowed Hours Lane Closure Strategy - 4th Ed.
0.0 - 0.5 mile
Lane Closure
0.5 - 1.0 mile
Lane Closure
> 1.0 mile
Lane Closure
0.0 - 0.5 mile
Lane Closure
0.5 - 1.0 mile
Lane Closure
> 1.0 mile
Lane Closure
Spring/Summer: April – October, Fall/Winter: November – March
State
Highway
Number
Beginning of
Section MP#
End of
Section
MP #
Beginning of Section - Description End of Section - Description Dir.
Spring/Summer Weekday Allowed Hours: Spring/Summer Weekend Allowed Hours:
# of
Lanes
2018 Volume
(AADT)
052B 86.48 86.98 US 34 FORT MORGAN SH 144 FORT MORGAN 7300 4 Both Anytime Anytime Anytime Anytime Anytime Anytime
052B 86.98 87.16 SH 144 FORT MORGAN FORT MORGAN I-76 INTERCHANGE 13000 4 Both Anytime Anytime Anytime Anytime Anytime Anytime
052B 87.16 87.90 FORT MORGAN I-76 INTERCHANGE MORGAN CR T 5800 2 Both Anytime Anytime
6 PM to 7 AM
9 AM to Noon
Anytime Anytime 6 PM to 10 AM
052B 87.90 88.47 MORGAN CR T MORGAN CR T.5 4300 4 Both Anytime Anytime Anytime Anytime Anytime Anytime
052B 88.47 91.07 MORGAN CR T.5 MORGAN CR W 2200 2 Both Anytime Anytime Anytime Anytime Anytime Anytime
052B 91.07 111.54 MORGAN CR W SH 14 RAYMER 1200 2 Both Anytime Anytime Anytime Anytime Anytime Anytime
055A 0.00 5.66 SH 138 CROOK BEGIN LOGAN CR 81 1000 2 Both Anytime Anytime Anytime Anytime Anytime Anytime
056B 2.90 4.49 MEADOWLARK DRIVE 2ND ST BERTHOUD 8000 2 Both Anytime 6 PM to 4 PM 7 PM to 6 AM Anytime Anytime 7 PM to 9 AM
056B 4.49 9.53 2ND ST BERTHOUD I-25 BERTHOUD INTERCHANGE 7400 2 Both Anytime 6 PM to 4 PM 7 PM to 6 AM Anytime Anytime 7 PM to 10 AM
057A 0.00 0.53 I-70 STRATTON US 24 STRATTON 1400 2 Both Anytime Anytime Anytime Anytime Anytime Anytime
059A 0.00 67.14 KIT CARSON/WASHINGTON COUNTY LINE US 36 NEAR COPE 1200 2 Both Anytime Anytime Anytime Anytime Anytime Anytime
059B 74.47 173.31 US 36 WEST OF JOES SH 138 SEDGEWICK 3000 2 Both Anytime Anytime Anytime Anytime Anytime Anytime
060A 0.00 4.96 US 287 CAMPION LARIMER CR 7 4600 2 Both Anytime Anytime 6 PM to 4 PM Anytime Anytime Anytime
060B 6.00 9.86 I-25 INTERCHANGE JOHNSTOWN MILLIKEN ANGOVE AVE JOHNSTOWN 14000 2 Both
7 PM to 6 AM
9 AM to 2 PM
7 PM to 6 AM 9 PM to 5 AM 5 PM to Noon 7 PM to 10 AM 10 PM to 7 AM
060B 9.86 14.70 ANGOVE AVE JOHNSTOWN WELD CR 48 11000 2 Both
6 PM to 7 AM
9 AM to 4 PM
7 PM to 6 AM
8 AM to 2 PM
9 PM to 5 AM Anytime Anytime 8 PM to 8 AM
060B 14.70 20.20 WELD CR 48 US 85 S/O GILCREST 7000 2 Both Anytime 6 PM to 4 PM 7 PM to 6 AM Anytime Anytime 7 PM to 11 AM
061A 0.00 40.99 US 34 OTIS US 6 STERLING 3000 2 Both Anytime Anytime Anytime Anytime Anytime Anytime
063A 0.00 56.41 US 36 ANTON US 6 ATWOOD 1900 2 Both Anytime Anytime Anytime Anytime Anytime Anytime
066B 28.69 30.00 US 36 LYONS MP 30 11000 4 Both Anytime Anytime Anytime Anytime Anytime Anytime
066B 30.00 34.84 MP 30 JOTIPA DR LONGMONT 12000 2 Both 5 PM to 6 AM 9 PM to 5 AM 9 PM to 5 AM Anytime 6 PM to 11 AM 9 PM to 8 AM
066B 34.84 35.08 JOTIPA DR LONGMONT HOVER ST LONGMONT 15000 3 Both
9 PM to 5 AM
9 AM to 4 PM
9 PM to 5 AM
9 AM to 4 PM
9 PM to 5 AM
9 AM to 4 PM
Anytime Anytime Anytime
066B 35.08 36.51 HOVER ST LONGMONT HILLCREST ST / PRATT ST LONGMONT 29000 2 Both 9 PM to 5 AM 10 PM to 5 AM 11 PM to 5 AM 9 PM to 8 AM 10 PM to 7 AM 11 PM to 6 AM
066B 36.51 36.83 HILLCREST ST / PRATT ST LONGMONT ERFERT ST LONGMONT EB
9 PM to 5 AM
9 AM to 4 PM
9 PM to 5 AM
9 AM to 4 PM
9 PM to 5 AM
9 AM to 4 PM
Anytime Anytime Anytime
066B 36.83 36.51 ERFERT ST LONGMONT HILLCREST ST / PRATT ST LONGMONT WB
9 PM to 5 AM
9 AM to 4 PM
9 PM to 5 AM
9 AM to 4 PM
9 PM to 5 AM
9 AM to 4 PM
Anytime Anytime Anytime
066B 36.83 37.66 ERFERT ST LONGMONT N 115TH ST LONGMONT 19000 2 Both 9 PM to 5 AM 9 PM to 5 AM 10 PM to 5 AM 7 PM to 9 AM 8 PM to 8 AM 10 PM to 7 AM
066B 37.66 37.95 N 115TH ST LONGMONT PACE ST LONGMONT 19000 3 Both
9 PM to 5 AM
9 AM to 4 PM
9 PM to 5 AM
9 AM to 4 PM
9 PM to 5 AM
9 AM to 4 PM
Anytime Anytime Anytime
066B 37.95 38.92 PACE ST LONGMONT BOULDER WELD COUNTY LINE ROAD 21000 2 Both 9 PM to 5 AM 9 PM to 5 AM 10 PM to 5 AM 7 PM to 9 AM 8 PM to 8 AM 10 PM to 7 AM
066B 38.92 42.74 BOULDER WELD COUNTY LINE ROAD I-25 LONGMONT INTERCHANGE 20000 2 Both 9 PM to 5 AM 9 PM to 5 AM 10 PM to 5 AM 7 PM to 9 AM 8 PM to 8 AM 10 PM to 7 AM
066B 42.74 44.92 I-25 LONGMONT INTERCHANGE WELD CR 13 17000 2 Both 9 PM to 5 AM 9 PM to 5 AM 9 PM to 5 AM 7 PM to 9 AM 8 PM to 9 AM 10 PM to 7 AM
066B 44.92 51.39 WELD CR 13 US 85 PLATTEVILLE 11000 2 Both
6 PM to 6 AM
8 AM to 3 PM
7 PM to 6 AM
9 AM to 2 PM
9 PM to 5 AM Anytime 6 PM to 11 AM 9 PM to 8 AM
070A 332.02 340.40 STRASBURG LINCOLN / JOHN BOUNDARY EB Anytime Anytime Anytime Anytime Anytime Anytime
070A 340.40 332.00 LINCOLN / JOHN BOUNDARY STRASBURG WB Anytime Anytime Anytime Anytime Anytime Anytime
412000
23000 4
Page C-7

CDOT Region 4 Appendix C - Spring/Summer Single-Lane Closure Allowed Hours Lane Closure Strategy - 4th Ed.
0.0 - 0.5 mile
Lane Closure
0.5 - 1.0 mile
Lane Closure
> 1.0 mile
Lane Closure
0.0 - 0.5 mile
Lane Closure
0.5 - 1.0 mile
Lane Closure
> 1.0 mile
Lane Closure
Spring/Summer: April – October, Fall/Winter: November – March
State
Highway
Number
Beginning of
Section MP#
End of
Section
MP #
Beginning of Section - Description End of Section - Description Dir.
Spring/Summer Weekday Allowed Hours: Spring/Summer Weekend Allowed Hours:
# of
Lanes
2018 Volume
(AADT)
070A 340.40 361.70 LINCOLN / JOHN BOUNDARY LIMON EB Anytime Anytime Anytime Anytime Anytime Anytime
070A 361.70 340.40 LIMON LINCOLN / JOHN BOUNDARY WB Anytime Anytime Anytime Anytime Anytime Anytime
070A 361.70 405.07 LIMON SH 59 / SEIBERT EB Anytime Anytime Anytime Anytime Anytime Anytime
070A 405.07 361.70 SH 59 / SEIBERT LIMON WB Anytime Anytime Anytime Anytime Anytime Anytime
070A 405.07 449.59 SH 59 / SEIBERT KANSAS STATE LINE EB Anytime Anytime Anytime Anytime Anytime Anytime
070A 449.59 405.07 KANSAS STATE LINE SH 59 / SEIBERT WB Anytime Anytime Anytime Anytime Anytime Anytime
070O 0.00 0.35 US 40 AGATE I-70 AGATE 250 2 Both Anytime Anytime Anytime Anytime Anytime Anytime
070P 0.00 0.53 I-70 VONA US 24 VONA 200 2 Both Anytime Anytime Anytime Anytime Anytime Anytime
070Q 0.14 0.38 US 24 BURLINGTON I-70 BURLINGTON 1900 2 Both Anytime Anytime Anytime Anytime Anytime Anytime
071C 48.65 101.06 CROWLEY / LINCOLN COUNTY LINE SH 24 IN LIMON 2800 2 Both Anytime Anytime Anytime Anytime Anytime Anytime
071D 102.00 138.01 US 24 (3RD ST) IN LIMON US 36 IN LAST CHANCE 2100 2 Both Anytime Anytime Anytime Anytime Anytime Anytime
071D 138.01 174.36 US 36 IN LAST CHANCE US 34 BRUSH 2700 2 Both Anytime Anytime Anytime Anytime Anytime Anytime
071E 175.49 176.46 US 34 BRUSH I-76 BRUSH INTERCHANGE 5700 4 Both Anytime Anytime Anytime Anytime Anytime Anytime
071E 176.46 201.64 I-76 BRUSH INTERCHANGE SH 14 WELD COUNTY 1700 2 Both Anytime Anytime Anytime Anytime Anytime Anytime
071F 205.53 232.82 SH 14 WELD COUNTY NEBRASKA STATE LINE 1100 2 Both Anytime Anytime Anytime Anytime Anytime Anytime
072B 32.33 32.86 SH 119 NEDERLAND FOREST RD NEDERLAND 4700 2 Both Anytime Anytime 5 PM to 11 AM Anytime Anytime 5 PM to 10 AM
072B 32.86 54.00 FOREST RD NEDERLAND SH 7 RAYMOND 2400 2 Both Anytime Anytime Anytime Anytime Anytime Anytime
076A 25.15 89.66 LOCHBUIE INTERCHANGE SH 71 / BRUSH 25000 4 Both Anytime Anytime Anytime Anytime Anytime Anytime
076A 89.66 184.14 SH 71 / BRUSH NEBRASKA STATE LINE 15000 4 Both Anytime Anytime Anytime Anytime Anytime Anytime
076B 0.00 0.31 SH 76 INTERCHANGE KEENSBURG ELM ST KEENESBURG 4300 2 Both Anytime Anytime Anytime Anytime Anytime Anytime
079B 18.93 23.89 168TH AVENUE PROSPECT VALLEY, SH 52 1500 2 Both Anytime Anytime Anytime Anytime Anytime Anytime
085C 236.03 241.59 ADAMS / WELD COUNTY LINE SH 52 FT LUPTON NB
9 PM to 5 AM
9 AM to 2 PM
9 PM to 5 AM
9 AM to 2 PM
9 PM to 5 AM
9 AM to 2 PM
6 PM to 3 PM 6 PM to 3 PM 6 PM to 3 PM
085C 241.59 236.03 SH 52 FT LUPTON ADAMS / WELD COUNTY LINE SB
9 PM to 5 AM
9 AM to 2 PM
9 PM to 5 AM
9 AM to 2 PM
9 PM to 5 AM
9 AM to 2 PM
5 PM to Noon 5 PM to Noon 5 PM to Noon
085C 241.59 265.85 SH 52 FT LUPTON US 34 NB
9 PM to 5 AM
9 AM to 2 PM
9 PM to 5 AM
9 AM to 2 PM
9 PM to 5 AM
9 AM to 2 PM
6 PM to 4 PM 6 PM to 4 PM 6 PM to 4 PM
085C 265.85 241.59 US 34 SH 52 FT LUPTON SB
9 PM to 5 AM
9 AM to 2 PM
9 PM to 5 AM
9 AM to 2 PM
9 PM to 5 AM
9 AM to 2 PM
5 PM to 2 PM 5 PM to 2 PM 5 PM to 2 PM
085E 0.00 1.28 SH 52 FORT LUPTON BUSINESS LOOP US 85 4700 2 Both Anytime Anytime 6 PM to 4 PM Anytime Anytime Anytime
085F 0.00 1.38 SH 66 PLATEVILLE END US 85 PLATEVILLE BUS LOOP 1400 2 Both Anytime Anytime Anytime Anytime Anytime Anytime
085G 0.00 1.63 SH 85 BUSINESS LOOP GREELEY US 34 BUSINESS LOOP GREELEY 18000 4 Both 9 PM to 5 AM 9 PM to 5 AM 9 PM to 5 AM Anytime Anytime Anytime
085H 0.00 2.24 US 34 BUSINESS LOOP GREELEY END US 85 GREELEY BUS LOOP 14000 4 Both 9 PM to 5 AM 9 PM to 5 AM 9 PM to 5 AM Anytime Anytime Anytime
085L 265.85 266.65 US 34 22ND ST GREELEY NB
9 PM to 5 AM
9 AM to 3 PM
9 PM to 5 AM
9 AM to 3 PM
9 PM to 5 AM
9 AM to 3 PM
Anytime Anytime Anytime
085L 266.65 265.85 22ND ST GREELEY US 34 SB
9 PM to 5 AM
9 AM to 1 PM
9 PM to 5 AM
9 AM to 1 PM
9 PM to 5 AM
9 AM to 1 PM
Anytime Anytime Anytime
085L 266.65 268.23 22ND ST GREELEY 8TH STREET NB
9 PM to 5 AM
9 AM to 2 PM
9 PM to 5 AM
9 AM to 2 PM
9 PM to 5 AM
9 AM to 2 PM
Anytime Anytime Anytime
085L 268.23 266.65 8TH STREET 22ND ST GREELEY SB
9 PM to 5 AM
9 AM to 1 PM
9 PM to 5 AM
9 AM to 1 PM
9 PM to 5 AM
9 AM to 1 PM
Anytime Anytime Anytime
30000 5
30000 4
415000
30000 4
15000
10000
4
4
33000 4
Page C-8

CDOT Region 4 Appendix C - Spring/Summer Single-Lane Closure Allowed Hours Lane Closure Strategy - 4th Ed.
0.0 - 0.5 mile
Lane Closure
0.5 - 1.0 mile
Lane Closure
> 1.0 mile
Lane Closure
0.0 - 0.5 mile
Lane Closure
0.5 - 1.0 mile
Lane Closure
> 1.0 mile
Lane Closure
Spring/Summer: April – October, Fall/Winter: November – March
State
Highway
Number
Beginning of
Section MP#
End of
Section
MP #
Beginning of Section - Description End of Section - Description Dir.
Spring/Summer Weekday Allowed Hours: Spring/Summer Weekend Allowed Hours:
# of
Lanes
2018 Volume
(AADT)
085L 268.23 270.25 8TH ST GREELEY GREELEY BUS RTE OVERPASS NB
9 PM to 5 AM
9 AM to 3 PM
9 PM to 5 AM
9 AM to 3 PM
9 PM to 5 AM
9 AM to 3 PM
Anytime Anytime Anytime
085L 270.25 268.23 GREELEY BUS RTE OVERPASS 8TH ST GREELEY SB
9 PM to 5 AM
9 AM to 3 PM
9 PM to 5 AM
9 AM to 3 PM
9 PM to 5 AM
9 AM to 3 PM
Anytime Anytime Anytime
085L 270.25 272.48 GREELEY BUS RTE OVERPASS SH 392 LUCERNE NB
9 PM to 5 AM
9 AM to 3 PM
9 PM to 5 AM
9 AM to 3 PM
9 PM to 5 AM
9 AM to 3 PM
Anytime Anytime Anytime
085L 272.48 270.25 SH 392 LUCERNE GREELEY BUS RTE OVERPASS SB
9 PM to 5 AM
9 AM to 3 PM
9 PM to 5 AM
9 AM to 3 PM
9 PM to 5 AM
9 AM to 3 PM
Anytime Anytime Anytime
085L 272.48 280.28 SH 392 LUCERNE 1ST AVE AULT NB Anytime Anytime Anytime Anytime Anytime Anytime
085L 280.28 272.48 1ST AVE AULT SH 392 LUCERNE SB Anytime Anytime Anytime Anytime Anytime Anytime
085L 280.28 283.40 1ST AVE AULT S/O MAIN AVE PIERCE 4800 2 Both Anytime Anytime
6 PM to 6 AM
8 AM to 3 PM
Anytime Anytime 6 PM to 3 PM
085L 283.40 284.10 S/O MAIN AVE PIERCE N/O WELD CR 90 PIERCE NB Anytime Anytime Anytime Anytime Anytime Anytime
085L 284.10 283.40 N/O WELD CR 90 PIERCE S/O MAIN AVE PIERCE SB Anytime Anytime Anytime Anytime Anytime Anytime
085L 284.10 288.53 N/O WELD CR 90 PIERCE 4TH ST NUNN 4500 2 Both Anytime Anytime
6 AM to 6 PM
7 AM to 3 PM
Anytime Anytime Anytime
085L 288.53 309.54 4TH ST NUNN WYOMING STATE LINE 4100 2 Both Anytime Anytime 6 PM to 4 PM Anytime Anytime Anytime
086A 12.26 23.13 CREST OF 3.9% GRADE UTE AVE IN KIOWA 13000 2 Both
7 PM to 7 AM
9 AM to Noon
7 PM to 7 AM 9 PM to 6 AM 6 PM to 9 AM 7 PM to 8 AM 9 PM to 7 AM
086A 23.13 27.72 UTE AVE IN KIOWA ELBERT CR 61.6 EB Anytime Anytime Anytime Anytime Anytime Anytime
086A 27.72 23.13 ELBERT CR 61.6 UTE AVE IN KIOWA WB Anytime Anytime Anytime Anytime Anytime Anytime
086A 27.72 59.00 ELBERT CR 61.6 I-70 INTERCHANGE (#352) 1800 2 Both Anytime Anytime Anytime Anytime Anytime Anytime
093A 11.78 12.00 SH 128 E BOULDER COUNTY END SB PASSING LANE 19000 2 Both 9 PM to 5 AM 9 PM to 5 AM 10 PM to 5 AM 7 PM to 9 AM 8 PM to 9 AM 11 PM to 7 AM
093A 12.00 13.62 END SB PASSING LANE SH 170 MARSHALL 19000 3 Both
9 PM to 5 AM
9 AM to 4 PM
9 PM to 5 AM
9 AM to 4 PM
9 PM to 5 AM
9 AM to 4 PM
Anytime Anytime Anytime
093A 13.62 15.32 SH 170 MARSHALL GREENBRIER BLVD BOULDER NB
9 PM to 5 AM
9 AM to 4 PM
9 PM to 5 AM
9 AM to 4 PM
9 PM to 5 AM
9 AM to 4 PM
Anytime Anytime Anytime
093A 15.32 13.62 GREENBRIER BLVD BOULDER SH 170 MARSHALL SB
9 PM to 5 AM
9 AM to 4 PM
9 PM to 5 AM
9 AM to 4 PM
9 PM to 5 AM
9 AM to 4 PM
Anytime Anytime Anytime
093A 15.32 16.33 GREENBRIER BLVD BOULDER TABLE MESA DR BOULDER NB
9 PM to 5 AM
Noon to 3 PM
9 PM to 5 AM
Noon to 3 PM
9 PM to 5 AM
Noon to 3 PM
5 PM to 2 PM 5 PM to 2 PM 5 PM to 2 PM
093A 16.33 15.32 TABLE MESA DR BOULDER GREENBRIER BLVD BOULDER SB
9 PM to 5 AM
9 AM to 3 PM
9 PM to 5 AM
9 AM to 3 PM
9 PM to 5 AM
9 AM to 3 PM
1 PM to 11 AM 1 PM to 11 AM 1 PM to 11 AM
093A 16.33 17.42 TABLE MESA DR BOULDER US 36E / BASELINE RD BOULDER NB
9 PM to 5 AM
Noon to 4 PM
9 PM to 5 AM
Noon to 4 PM
9 PM to 5 AM
Noon to 4 PM
Anytime Anytime Anytime
093A 17.42 16.33 US 36E / BASELINE RD BOULDER TABLE MESA DR BOULDER SB
9 PM to 5 AM
Noon to 4 PM
9 PM to 5 AM
Noon to 4 PM
9 PM to 5 AM
Noon to 4 PM
Anytime Anytime Anytime
093A 17.42 17.78 US 36E / BASELINE RD BOULDER 20TH ST BOULDER NB
9 PM to 5 AM
9 AM to 3 PM
9 PM to 5 AM
9 AM to 3 PM
9 PM to 5 AM
9 AM to 3 PM
Anytime Anytime Anytime
093A 17.78 17.42 20TH ST BOULDER US 36E / BASELINE RD BOULDER SB
9 PM to 5 AM
9 AM to 3 PM
9 PM to 5 AM
9 AM to 3 PM
9 PM to 5 AM
9 AM to 3 PM
5 PM to 10 AM 5 PM to 10 AM 5 PM to 10 AM
093A 17.78 18.72 20TH ST BOULDER ARAPAHOE AVE BOULDER NB
9 PM to 5 AM
9 AM to 1 PM
9 PM to 5 AM
9 AM to 1 PM
9 PM to 5 AM
9 AM to 1 PM
5 PM to 2 PM 5 PM to 2 PM 5 PM to 2 PM
093A 18.72 17.78 ARAPAHOE AVE BOULDER 20TH ST BOULDER SB
9 PM to 5 AM
2 PM to 4 PM
9 PM to 5 AM
2 PM to 4 PM
9 PM to 5 AM
2 PM to 4 PM
2 PM to Noon 2 PM to Noon 2 PM to Noon
093A 18.72 18.85 ARAPAHOE AVE BOULDER SH 119 / SH 7 BOULDER NB
9 PM to 5 AM
10 AM to 1 PM
9 PM to 5 AM
10 AM to 1 PM
9 PM to 5 AM
10 AM to 1 PM
5 PM to 3 PM 5 PM to 3 PM 5 PM to 3 PM
093A 18.85 18.72 SH 119 / SH 7 BOULDER ARAPAHOE AVE BOULDER SB
9 PM to 5 AM
9 AM to 3 PM
9 PM to 5 AM
9 AM to 3 PM
9 PM to 5 AM
9 AM to 3 PM
Anytime Anytime Anytime
094A 35.01 86.00 EL PASO / LINCOLN COUNTY LINE US 40 AT AROYA 530 2 Both Anytime Anytime Anytime Anytime Anytime Anytime
113A 0.00 18.83 SH 138 ILIFF NEBRASKA STATE LINE 1600 2 Both Anytime Anytime Anytime Anytime Anytime Anytime
119A 22.10 36.47 GILPIN BOULDER COUNTY LINE BOULDER CR 122 7000 2 Both 9 PM to 5 AM 9 PM to 5 AM 9 PM to 5 AM 2 PM to Noon 4 PM to 11 AM 7 PM to 9 AM
119A 36.47 38.98 BOULDER CR 122 BOULDER CR 118 5900 2 Both 9 PM to 5 AM 9 PM to 5 AM 9 PM to 5 AM Anytime Anytime 7 PM to 7 AM
3000
5
4
4
17000
29000
36000
4
4
4
4
44600
12000
17000
17000
634000
27000 4
430000
Page C-9

CDOT Region 4 Appendix C - Spring/Summer Single-Lane Closure Allowed Hours Lane Closure Strategy - 4th Ed.
0.0 - 0.5 mile
Lane Closure
0.5 - 1.0 mile
Lane Closure
> 1.0 mile
Lane Closure
0.0 - 0.5 mile
Lane Closure
0.5 - 1.0 mile
Lane Closure
> 1.0 mile
Lane Closure
Spring/Summer: April – October, Fall/Winter: November – March
State
Highway
Number
Beginning of
Section MP#
End of
Section
MP #
Beginning of Section - Description End of Section - Description Dir.
Spring/Summer Weekday Allowed Hours: Spring/Summer Weekend Allowed Hours:
# of
Lanes
2018 Volume
(AADT)
119A 38.98 40.93 BOULDER CR 118 PEARL ST BOULDER 8100 2 Both 9 PM to 5 AM 9 PM to 5 AM 9 PM to 5 AM 6 PM to 4 PM 6 PM to 2 PM 9 PM to 7 AM
119A 40.93 41.89 PEARL ST BOULDER BROADWAY BOULDER 19000 4 Both 9 PM to 5 AM 9 PM to 5 AM 9 PM to 5 AM Anytime Anytime Anytime
119B 44.24 44.98 US 36 BOULDER FOOTHILLS PARKWAY INTERCHANGE EB 9 PM to 5 AM 9 PM to 5 AM 9 PM to 5 AM 9 PM to 2 PM 9 PM to 2 PM 9 PM to 2 PM
119B 44.98 44.24 FOOTHILLS PARKWAY INTERCHANGE US 36 BOULDER WB 9 PM to 5 AM 9 PM to 5 AM 9 PM to 5 AM 9 PM to Noon 9 PM to Noon 9 PM to Noon
119B 44.98 46.18 FOOTHILLS PARKWAY INTERCHANGE JAY ROAD BOULDER EB 9 PM to 5 AM 9 PM to 5 AM 9 PM to 5 AM 9 PM to 1 PM 9 PM to 1 PM 9 PM to 1 PM
119B 46.18 44.98 JAY ROAD BOULDER FOOTHILLS PARKWAY INTERCHANGE WB 9 PM to 5 AM 9 PM to 5 AM 9 PM to 5 AM 9 PM to Noon 9 PM to Noon 9 PM to Noon
119B 46.18 56.25 JAY ROAD BOULDER US 287 LONGMONT EB
9 PM to 5 AM
9 AM to 2 PM
9 PM to 5 AM
9 AM to 2 PM
9 PM to 5 AM
9 AM to 2 PM
9 PM to 9 AM 9 PM to 9 AM 9 PM to 9 AM
119B 56.25 46.18 US 287 LONGMONT JAY ROAD BOULDER WB
9 PM to 5 AM
Noon to 2 PM
9 PM to 5 AM
Noon to 2 PM
9 PM to 5 AM
Noon to 2 PM
9 PM to 9 AM 9 PM to 9 AM 9 PM to 9 AM
119B 56.25 57.32 US 287 LONGMONT S MARTIN ST LONGMONT EB
9 PM to 5 AM
9 AM to 4 PM
9 PM to 5 AM
9 AM to 4 PM
9 PM to 5 AM
9 AM to 4 PM
9 PM to 2 PM 9 PM to 2 PM 9 PM to 2 PM
119B 57.32 56.25 S MARTIN ST LONGMONT US 287 LONGMONT WB
9 PM to 5 AM
9 AM to 4 PM
9 PM to 5 AM
9 AM to 4 PM
9 PM to 5 AM
9 AM to 4 PM
9 PM to 2 PM 9 PM to 2 PM 9 PM to 2 PM
119B 57.32 59.09 S MARTIN ST LONGMONT 3RD AVE LONGMONT EB
9 PM to 5 AM
9 AM to Noon
9 PM to 5 AM
9 AM to Noon
9 PM to 5 AM
9 AM to Noon
9 PM to 1 PM 9 PM to 1 PM 9 PM to 1 PM
119B 59.09 57.32 3RD AVE LONGMONT S MARTIN ST LONGMONT WB
9 PM to 5 AM
10 AM to 1 PM
9 PM to 5 AM
10 AM to 1 PM
9 PM to 5 AM
10 AM to 1 PM
9 PM to Noon 9 PM to Noon 9 PM to Noon
119C 59.09 63.64 3RD AVE LONGMONT I-25 LONGMONT INTERCHANGE EB 9 PM to 5 AM 9 PM to 5 AM 9 PM to 5 AM 9 PM to 11 AM 9 PM to 11 AM 9 PM to 11 AM
119C 63.64 59.09 I-25 LONGMONT INTERCHANGE 3RD AVE LONGMONT WB 9 PM to 5 AM 9 PM to 5 AM 9 PM to 5 AM 9 PM to 10 AM 9 PM to 10 AM 9 PM to 10 AM
138A 0.00 0.55 US 6 STERLING (BEGIN NB 1-WAY) BROADWAY ST STERLING (END NB 1-WAY) 4400 3 NB Anytime Anytime Anytime Anytime Anytime Anytime
138A 0.55 3.33 SERVICE RD & 2ND ST STERLING LOGAN CR 43.5 4600 4 Both Anytime Anytime Anytime Anytime Anytime Anytime
138A 3.33 57.76 LOGAN CR 43.5 PLUM ST JULESBURG 2600 2 Both Anytime Anytime Anytime Anytime Anytime Anytime
138A 57.76 58.26 PLUM ST JULESBURG ASH ST JULESBURG 2200 4 Both Anytime Anytime Anytime Anytime Anytime Anytime
138A 58.26 59.82 ASH ST JULESBURG NEBRASKA STATE LINE 1900 2 Both Anytime Anytime Anytime Anytime Anytime Anytime
138Z 0.00 0.61 BROADWAY STREET STERLING (BEGIN SB 1-WAY) US HIGHWAY 6 (END SB 1-WAY) 4600 3 SB Anytime Anytime Anytime Anytime Anytime Anytime
144A 0.00 26.89 I-76 W/O WIGGINS MORGAN CR 16.8 2400 2 Both Anytime Anytime Anytime Anytime Anytime Anytime
144A 26.89 28.80 MORGAN CR 16.8 SH 52 5000 2 Both Anytime Anytime
9 PM to 5 AM
9 AM to 3 PM
Anytime Anytime Anytime
157A 0.00 4.53 US 36 BOULDER SH 119 BOULDER NB 9 PM to 5 AM 9 PM to 5 AM 9 PM to 5 AM 9 PM to 11 AM 9 PM to 11 AM 9 PM to 11 AM
157A 4.53 0.00 SH 119 BOULDER US 36 BOULDER SB 9 PM to 5 AM 9 PM to 5 AM 9 PM to 5 AM 9 PM to 9 AM 9 PM to 9 AM 9 PM to 9 AM
170A 0.00 2.16 BOULDER CR ES2 SENDA ROSCOSA ST ELDORADO SPRINGS 1300 2 Both Anytime Anytime Anytime Anytime Anytime Anytime
170A 2.16 3.06 SENDA ROSCOSA ST ELDORADO SPRINGS S CHERRYVALE RD BOULDER 6100 2 Both Anytime Anytime 9 PM to 5 AM Anytime Anytime 4 PM to Noon
170A 3.06 5.99 S CHERRYVALE RD BOULDER 76TH AVENUE 21000 2 Both 9 PM to 5 AM 9 PM to 5 AM 10 PM to 5 AM 7 PM to 9 AM 8 PM to 8 AM 11 PM to 7 AM
170A 5.99 6.68 76TH AVENUE BEGIN 4-LANE HWY 21000 2 Both 9 PM to 5 AM 9 PM to 5 AM 10 PM to 5 AM 7 PM to 9 AM 8 PM to 8 AM 11 PM to 7 AM
170A 6.68 6.91 BEGIN 4-LANE HWY US 36 SUPERIOR EB
9 PM to 5 AM
9 AM to Noon
9 PM to 5 AM
9 AM to Noon
9 PM to 5 AM
9 AM to Noon
Anytime Anytime Anytime
170A 6.91 6.68 US 36 SUPERIOR BEGIN 4-LANE HWY WB
9 PM to 5 AM
9 AM to Noon
9 PM to 5 AM
9 AM to Noon
9 PM to 5 AM
9 AM to Noon
Anytime Anytime Anytime
257A 0.00 5.15 US 60 MILLIKEN US 34 WELD COUNTY 8600 2 Both
6 PM to 7 AM
8 AM to 4 PM
6 PM to 6 AM
8 AM to 3 PM
7 PM to 6 AM Anytime Anytime 6 PM to 11 AM
257A 5.15 10.60 US 34 WELD COUNTY SH 392B / HOLLISTER LAKE RD WINDSOR 13000 2 Both
6 PM to 6 AM
9 AM to 2 PM
7 PM to 6 AM
9 AM to 11 AM
8 PM to 5 AM Anytime Anytime 7 PM to 8 AM
4
30000
25000
4
53000 4
6
4
6
4
439000
30000
38000
51000
58000
Page C-10

CDOT Region 4 Appendix C - Spring/Summer Single-Lane Closure Allowed Hours Lane Closure Strategy - 4th Ed.
0.0 - 0.5 mile
Lane Closure
0.5 - 1.0 mile
Lane Closure
> 1.0 mile
Lane Closure
0.0 - 0.5 mile
Lane Closure
0.5 - 1.0 mile
Lane Closure
> 1.0 mile
Lane Closure
Spring/Summer: April – October, Fall/Winter: November – March
State
Highway
Number
Beginning of
Section MP#
End of
Section
MP #
Beginning of Section - Description End of Section - Description Dir.
Spring/Summer Weekday Allowed Hours: Spring/Summer Weekend Allowed Hours:
# of
Lanes
2018 Volume
(AADT)
257A 10.60 11.14 SH 392B / HOLLISTER LAKE RD WINDSOR 2ND STREET WINDSOR NB Anytime Anytime Anytime Anytime Anytime Anytime
257A 11.14 10.60 2ND STREET WINDSOR SH 392B / HOLLISTER LAKE RD WINDSOR SB Anytime Anytime Anytime Anytime Anytime Anytime
257A 11.14 11.62 2ND STREET WINDSOR SH 392A / MAIN ST / 7TH ST WINDSOR 16000 2 Both
7 PM to 6 AM
9 AM to 11 AM
7 PM to 6 AM 9 PM to 5 AM Anytime 6 PM to 11 AM 8 PM to 8 AM
257A 11.62 14.53 SH 392A / MAIN ST / 7TH ST WINDSOR WELD CR 74 6900 2 Both Anytime
6 PM to 7 AM
8 AM to 4 PM
7 PM to 6 AM
9 AM to 11 AM
Anytime Anytime Anytime
257A 14.53 18.49 WELD CR 74 SH 14 5100 2 Both Anytime Anytime
6 PM to 6 AM
8 AM to 2 PM
Anytime Anytime Anytime
257B 0.04 1.15 SH 257A / WELD CR 19 US 34D / 10TH ST 170 2 Both Anytime Anytime Anytime Anytime Anytime Anytime
287B 122.78 133.24 KIOWA / CHEYENNE COUNTY LINE SH 40 4200 2 Both Anytime Anytime 6 PM to 9 AM Anytime Anytime 5 PM to 11 AM
287C 304.32 305.36 SH 7/W BASELINE RD BOULDER SH 7/ARAPAHOE RD BOULDER NB
9 PM to 5 AM
10 AM to 1 PM
9 PM to 5 AM
10 AM to 1 PM
9 PM to 5 AM
10 AM to 1 PM
7 PM to 11 AM 7 PM to 11 AM 7 PM to 11 AM
287C 305.36 304.32 SH 7/ARAPAHOE RD BOULDER SH 7/W BASELINE RD BOULDER SB
9 PM to 5 AM
10 AM to 1 PM
9 PM to 5 AM
10 AM to 1 PM
9 PM to 5 AM
10 AM to 1 PM
6 PM to 10 AM 6 PM to 10 AM 6 PM to 10 AM
287C 305.36 309.39 SH 7/ARAPAHOE RD BOULDER BOULDER CR 38 BOULDER COUNTY NB
9 PM to 5 AM
9 AM to 4 PM
9 PM to 5 AM
9 AM to 4 PM
9 PM to 5 AM
9 AM to 4 PM
6 PM to 1 PM 6 PM to 1 PM 6 PM to 1 PM
287C 309.39 305.36 BOULDER CR 38 BOULDER COUNTY SH 7/ARAPAHOE RD BOULDER SB
9 PM to 5 AM
9 AM to 4 PM
9 PM to 5 AM
9 AM to 4 PM
9 PM to 5 AM
9 AM to 4 PM
5 PM to Noon 5 PM to Noon 5 PM to Noon
287C 309.39 310.39 BOULDER CR 38 BOULDER COUNTY SH 52 LONGMONT NB
9 PM to 5 AM
9 AM to 4 PM
9 PM to 5 AM
9 AM to 4 PM
9 PM to 5 AM
9 AM to 4 PM
Anytime Anytime Anytime
287C 310.39 309.39 SH 52 LONGMONT BOULDER CR 38 BOULDER COUNTY SB
9 PM to 5 AM
9 AM to 4 PM
9 PM to 5 AM
9 AM to 4 PM
9 PM to 5 AM
9 AM to 4 PM
Anytime Anytime Anytime
287C 310.39 311.42 SH 52 LONGMONT NIWOT RD LONGMONT NB
9 PM to 5 AM
10 AM to 1 PM
9 PM to 5 AM
10 AM to 1 PM
9 PM to 5 AM
10 AM to 1 PM
5 PM to 2 PM 5 PM to 2 PM 5 PM to 2 PM
287C 311.42 310.39 NIWOT RD LONGMONT SH 52 LONGMONT SB
9 PM to 5 AM
10 AM to 4 PM
9 PM to 5 AM
10 AM to 4 PM
9 PM to 5 AM
10 AM to 4 PM
5 PM to 2 PM 5 PM to 2 PM 5 PM to 2 PM
287C 311.42 314.56 NIWOT RD LONGMONT JERSEY AVE LONGMONT NB
9 PM to 5 AM
9 AM to 11 AM
9 PM to 5 AM
9 AM to 11 AM
9 PM to 5 AM
9 AM to 11 AM
5 PM to 2 PM 5 PM to 2 PM 5 PM to 2 PM
287C 314.56 311.42 JERSEY AVE LONGMONT NIWOT RD LONGMONT SB
9 PM to 5 AM
10 AM to 3 PM
9 PM to 5 AM
10 AM to 3 PM
9 PM to 5 AM
10 AM to 3 PM
5 PM to 1 PM 5 PM to 1 PM 5 PM to 1 PM
287C 314.56 315.23 JERSEY AVE LONGMONT BOSTON AVE LONGMONT NB
9 PM to 5 AM
9 AM to Noon
9 PM to 5 AM
9 AM to Noon
9 PM to 5 AM
9 AM to Noon
5 PM to 2 PM 5 PM to 2 PM 5 PM to 2 PM
287C 315.23 314.56 BOSTON AVE LONGMONT JERSEY AVE LONGMONT SB
9 PM to 5 AM
9 AM to 11 AM
9 PM to 5 AM
9 AM to 11 AM
9 PM to 5 AM
9 AM to 11 AM
5 PM to 1 PM 5 PM to 1 PM 5 PM to 1 PM
287C 315.23 315.66 BOSTON AVE LONGMONT 3RD AVE LONGMONT NB
9 PM to 5 AM
9 AM to 4 PM
9 PM to 5 AM
9 AM to 4 PM
9 PM to 5 AM
9 AM to 4 PM
Anytime Anytime Anytime
287C 315.66 315.23 3RD AVE LONGMONT BOSTON AVE LONGMONT SB
9 PM to 5 AM
9 AM to 4 PM
9 PM to 5 AM
9 AM to 4 PM
9 PM to 5 AM
9 AM to 4 PM
Anytime Anytime Anytime
287C 315.66 316.33 3RD AVE LONGMONT 9TH AVE LONGMONT NB
9 PM to 5 AM
9 AM to 3 PM
9 PM to 5 AM
9 AM to 3 PM
9 PM to 5 AM
9 AM to 3 PM
Anytime Anytime Anytime
287C 316.33 315.66 9TH AVE LONGMONT 3RD AVE LONGMONT SB
9 PM to 5 AM
9 AM to 3 PM
9 PM to 5 AM
9 AM to 3 PM
9 PM to 5 AM
9 AM to 3 PM
Anytime Anytime Anytime
287C 316.33 316.85 9TH AVE LONGMONT MOUNTAIN VIEW AVE LONGMONT NB
9 PM to 5 AM
9 AM to Noon
9 PM to 5 AM
9 AM to Noon
9 PM to 5 AM
9 AM to Noon
5 PM to 1 PM 5 PM to 1 PM 5 PM to 1 PM
287C 316.85 316.33 MOUNTAIN VIEW AVE LONGMONT 9TH AVE LONGMONT SB
9 PM to 5 AM
9 AM to 11 AM
9 PM to 5 AM
9 AM to 11 AM
9 PM to 5 AM
9 AM to 11 AM
5 PM to Noon 5 PM to Noon 5 PM to Noon
287C 316.85 317.87 MOUNTAIN VIEW AVE LONGMONT 21ST AVE LONGMONT NB
9 PM to 5 AM
9 AM to 11 AM
9 PM to 5 AM
9 AM to 11 AM
9 PM to 5 AM
9 AM to 11 AM
5 PM to 1 PM 5 PM to 1 PM 5 PM to 1 PM
287C 317.87 316.85 21ST AVE LONGMONT MOUNTAIN VIEW AVE LONGMONT SB
9 PM to 5 AM
9 AM to 11 AM
9 PM to 5 AM
9 AM to 11 AM
9 PM to 5 AM
9 AM to 11 AM
5 PM to Noon 5 PM to Noon 5 PM to Noon
287C 317.87 318.33 21ST AVE LONGMONT SH 66 LONGMONT NB
9 PM to 5 AM
9 AM to 4 PM
9 PM to 5 AM
9 AM to 4 PM
9 PM to 5 AM
9 AM to 4 PM
Anytime Anytime Anytime
287C 318.33 317.87 SH 66 LONGMONT 21ST AVE LONGMONT SB
9 PM to 5 AM
9 AM to 4 PM
9 PM to 5 AM
9 AM to 4 PM
9 PM to 5 AM
9 AM to 4 PM
Anytime Anytime Anytime
287C 318.33 331.65 SH 66 LONGMONT 19TH ST SOUTHEAST LOVELAND NB
9 PM to 5 AM
9 AM to 4 PM
9 PM to 5 AM
9 AM to 4 PM
9 PM to 5 AM
9 AM to 4 PM
5 PM to 3 PM 5 PM to 3 PM 5 PM to 3 PM
287C 331.65 318.33 19TH ST SOUTHEAST LOVELAND SH 66 LONGMONT SB
9 PM to 5 AM
9 AM to 4 PM
9 PM to 5 AM
9 AM to 4 PM
9 PM to 5 AM
9 AM to 4 PM
Anytime Anytime Anytime
287C 331.65 332.67 19TH ST SOUTHEAST LOVELAND S CLEVELAND AVE LOVELAND NB
9 PM to 5 AM
9 AM to 4 PM
9 PM to 5 AM
9 AM to 4 PM
9 PM to 5 AM
9 AM to 4 PM
Anytime Anytime Anytime
287C 332.67 331.65 S CLEVELAND AVE LOVELAND 19TH ST SOUTHEAST LOVELAND SB
9 PM to 5 AM
9 AM to 3 PM
9 PM to 5 AM
9 AM to 3 PM
9 PM to 5 AM
9 AM to 3 PM
Anytime Anytime Anytime
4
4
4
28000
23000
30000
413000
40000
32000
24000
28000
28000
4
4
4
4
4
24000 4
24000
4
4
4
31000
25000
26000
4
Page C-11

CDOT Region 4 Appendix C - Spring/Summer Single-Lane Closure Allowed Hours Lane Closure Strategy - 4th Ed.
0.0 - 0.5 mile
Lane Closure
0.5 - 1.0 mile
Lane Closure
> 1.0 mile
Lane Closure
0.0 - 0.5 mile
Lane Closure
0.5 - 1.0 mile
Lane Closure
> 1.0 mile
Lane Closure
Spring/Summer: April – October, Fall/Winter: November – March
State
Highway
Number
Beginning of
Section MP#
End of
Section
MP #
Beginning of Section - Description End of Section - Description Dir.
Spring/Summer Weekday Allowed Hours: Spring/Summer Weekend Allowed Hours:
# of
Lanes
2018 Volume
(AADT)
287C 332.67 333.41 S CLEVELAND AVE LOVELAND 6TH ST LOVELAND 12000 2 NB
9 PM to 5 AM
9 AM to 4 PM
9 PM to 5 AM
9 AM to 4 PM
9 PM to 5 AM
9 AM to 4 PM
Anytime Anytime Anytime
287C 333.41 334.31 6TH ST LOVELAND 17TH AVE LOVELAND 17000 3 NB
9 PM to 5 AM
9 AM to 4 PM
9 PM to 5 AM
9 AM to 4 PM
9 PM to 5 AM
9 AM to 4 PM
Anytime Anytime Anytime
287C 334.31 339.13 17TH AVE LOVELAND SH 392 NB 9 PM to 5 AM 9 PM to 5 AM 9 PM to 5 AM 6 PM to Noon 6 PM to Noon 6 PM to Noon
287C 339.13 334.31 SH 392 17TH AVE LOVELAND SB 9 PM to 5 AM 9 PM to 5 AM 9 PM to 5 AM 6 PM to 11 AM 6 PM to 11 AM 6 PM to 11 AM
287C 339.13 342.21 SH 392 HARMONY ROAD FORT COLLINS NB 9 PM to 5 AM 9 PM to 5 AM 9 PM to 5 AM 5 PM to 9 AM 5 PM to 9 AM 5 PM to 9 AM
287C 342.21 339.13 HARMONY ROAD FORT COLLINS SH 392 SB 9 PM to 5 AM 9 PM to 5 AM 9 PM to 5 AM 7 PM to 11 AM 7 PM to 11 AM 7 PM to 11 AM
287C 342.21 345.99 HARMONY ROAD FORT COLLINS LAUREL ST FORT COLLINS NB
9 PM to 5 AM
9 AM to 4 PM
9 PM to 5 AM
9 AM to 4 PM
9 PM to 5 AM
9 AM to 4 PM
3 PM to 9 AM 3 PM to 9 AM 3 PM to 9 AM
287C 345.99 342.21 LAUREL ST FORT COLLINS HARMONY ROAD FORT COLLINS SB
9 PM to 5 AM
9 AM to 4 PM
9 PM to 5 AM
9 AM to 4 PM
9 PM to 5 AM
9 AM to 4 PM
5 PM to Noon 5 PM to Noon 5 PM to Noon
287C 345.99 346.63 LAUREL ST FORT COLLINS MOUNTAIN AVE FORT COLLINS NB
9 PM to 5 AM
9 AM to 3 PM
9 PM to 5 AM
9 AM to 3 PM
9 PM to 5 AM
9 AM to 3 PM
5 PM to 9 AM 5 PM to 9 AM 5 PM to 9 AM
287C 346.63 345.99 MOUNTAIN AVE FORT COLLINS LAUREL ST FORT COLLINS SB
9 PM to 5 AM
9 AM to 1 PM
9 PM to 5 AM
9 AM to 1 PM
9 PM to 5 AM
9 AM to 1 PM
6 PM to 11 AM 6 PM to 11 AM 6 PM to 11 AM
287C 346.63 348.63 MOUNTAIN AVE FORT COLLINS SH 1 / TERRY LAKE RD NB
9 PM to 5 AM
9 AM to Noon
9 PM to 5 AM
9 AM to Noon
9 PM to 5 AM
9 AM to Noon
5 PM to 9 AM 5 PM to 9 AM 5 PM to 9 AM
287C 348.63 346.63 SH 1 / TERRY LAKE RD MOUNTAIN AVE FORT COLLINS SB
9 PM to 5 AM
9 AM to 11 AM
9 PM to 5 AM
9 AM to 11 AM
9 PM to 5 AM
9 AM to 11 AM
7 PM to 11 AM 7 PM to 11 AM 7 PM to 11 AM
287C 348.63 350.21 SH 1 / TERRY LAKE RD LARIMER CR 54G LA PORTE NB Anytime Anytime Anytime Anytime Anytime Anytime
287C 350.21 348.63 LARIMER CR 54G LA PORTE SH 1 / TERRY LAKE RD SB Anytime Anytime Anytime Anytime Anytime Anytime
287C 350.21 352.35 LARIMER CR 54G LA PORTE OVERLAND TRAIL 7400 2 Both Anytime Anytime 7 PM to 7 AM 4 PM to 11 AM 6 PM to 10 AM 8 PM to 8 AM
287C 352.35 367.01 OVERLAND TRAIL LARIMER CR 74E 8800 3 Both Anytime Anytime Anytime Anytime Anytime Anytime
287C 367.01 367.84 LARIMER CR 74E LARIMER CR 80 4800 2 Both Anytime Anytime 6 PM to 10 AM Anytime Anytime 7 PM to 9 AM
287C 367.84 385.22 LARIMER CR 80 WYOMING STATE LINE 4100 3 Both Anytime Anytime Anytime Anytime Anytime Anytime
287Z 0.00 0.17 BEGIN 1-WAY SOUTHBOUND (17TH AVE) 16TH STREET LOVELAND 15000 2 SB
9 PM to 5 AM
9 AM to 11 AM
9 PM to 5 AM
9 AM to 11 AM
9 PM to 5 AM
9 AM to 11 AM
5 PM to Noon 5 PM to Noon 5 PM to Noon
287Z 0.17 1.27 16TH STREET LOVELAND 2ND ST LOVELAND 13000 3 SB
9 PM to 5 AM
9 AM to 4 PM
9 PM to 5 AM
9 AM to 4 PM
9 PM to 5 AM
9 AM to 4 PM
Anytime Anytime Anytime
287Z 1.27 1.76 2ND ST LOVELAND END 1-WAY SOUTHBOUND (5TH ST SE) 12000 2 SB
9 PM to 5 AM
9 AM to 3 PM
9 PM to 5 AM
9 AM to 3 PM
9 PM to 5 AM
9 AM to 3 PM
Anytime Anytime Anytime
385B 135.41 149.70 KIOWA / CHEYENNE COUNTY LINE US 40 IN CHEYENNE WELLS 610 2 Both Anytime Anytime Anytime Anytime Anytime Anytime
385C 150.31 207.51 US 40 IN CHEYENNE WELLS KIT CARSON/YUMA CTY LINE 5300 2 Both Anytime Anytime
6 PM to 7 AM
8 AM to Noon
Anytime Anytime Anytime
385C 207.51 216.86 KIT CARSON/YUMA CTY LINE US 36 WEST 800 2 Both Anytime Anytime Anytime Anytime Anytime Anytime
385D 219.37 241.12 US 36 EAST YUMA CR 33 920 2 Both Anytime Anytime Anytime Anytime Anytime Anytime
385D 241.12 278.93 YUMA CR 33 JOHNSON ST IN HOLYOKE 4000 2 Both Anytime Anytime Anytime Anytime Anytime Anytime
385D 278.93 279.42 JOHNSON ST IN HOLYOKE FURRY ST HOLYOKE 3700 4 Both Anytime Anytime Anytime Anytime Anytime Anytime
385D 279.42 309.14 US 6 HOLYOKE I-76 JULESBURG INTERCHANGE 2600 2 Both Anytime Anytime Anytime Anytime Anytime Anytime
385D 309.14 311.00 I-76 JULESBURG INTERCHANGE US 138 JULESBURG 1600 2 Both Anytime Anytime Anytime Anytime Anytime Anytime
385E 313.69 317.63 JULESBURG AIRPORT CO-NE STATE LINE 530 2 Both Anytime Anytime Anytime Anytime Anytime Anytime
6
4
4
4
37000
35000
42000
27000
30000
14000
4
4
Page C-12

CDOT Region 4 Appendix C - Spring/Summer Single-Lane Closure Allowed Hours Lane Closure Strategy - 4th Ed.
0.0 - 0.5 mile
Lane Closure
0.5 - 1.0 mile
Lane Closure
> 1.0 mile
Lane Closure
0.0 - 0.5 mile
Lane Closure
0.5 - 1.0 mile
Lane Closure
> 1.0 mile
Lane Closure
Spring/Summer: April – October, Fall/Winter: November – March
State
Highway
Number
Beginning of
Section MP#
End of
Section
MP #
Beginning of Section - Description End of Section - Description Dir.
Spring/Summer Weekday Allowed Hours: Spring/Summer Weekend Allowed Hours:
# of
Lanes
2018 Volume
(AADT)
392A 95.31 100.00 US 287 I-25 WINDSOR INTERCHANGE 16000 2 Both 9 PM to 5 PM 9 PM to 5 AM 10 PM to 5 AM 9 PM to 9 AM 9 PM to 8 AM 11 PM to 7 AM
392A 100.00 104.46 I-25 WINDSOR INTERCHANGE 7TH ST IN WINDSOR (SH 257 NORTH) 21000 2 Both 9 PM to 5 AM 9 PM to 5 AM 10 PM to 5 AM 9 PM to 8 AM 9 PM to 7 AM 11 PM to 6 AM
392B 105.44 107.42 SH 257 SOUTH WELD CR 23 8900 2 Both 6 PM to 4 PM
6 PM to 6 AM
8 AM to 3 PM
7 PM to 5 AM Anytime Anytime 6 PM to 11 AM
392B 107.42 112.57 WELD CR 23 WELD CR 33 8500 2 Both 6 PM to 4 PM
6 PM to 6 AM
8 AM to 3 PM
7 PM to 5 AM Anytime Anytime 7 PM to 10 AM
392B 112.57 117.61 WELD CR 33 WELD CR 43 7800 2 Both 6 PM to 4 PM
6 PM to 6 AM
8 AM to 3 PM
7 PM to 5 AM Anytime Anytime 7 PM to 10 AM
392B 117.61 141.58 WELD CR 43 WELD CR 55 4000 2 Both Anytime Anytime 6 PM to 4 PM Anytime Anytime Anytime
402A 0.00 4.23 US 287 I-25 EAST FRONTAGE ROAD 19000 2 Both 9 PM to 5 AM 9 PM to 5 AM 10 PM to 5 AM 9 PM to 9 AM 9 PM to 8 AM 10 PM to 7 AM
Page C-13

APPENDIX D
FALL/WINTER SCHEDULES

Region 4 Lane Closure Strategy, 4
th
Ed.
Appendix D
APPENDIX D. FALL/WINTER ALLOWABLE
CLOSURE HOURS

CDOT Region 4 Appendix D - Fall/Winter Single-Lane Closure Allowed Hours Lane Closure Strategy - 4th Ed.
0.0 - 0.5 mile
Lane Closure
0.5 - 1.0 mile
Lane Closure
> 1.0 mile
Lane Closure
0.0 - 0.5 mile
Lane Closure
0.5 - 1.0 mile
Lane Closure
> 1.0 mile
Lane Closure
001A 0.00 0.35 US 287 IN FORT COLLINS LARIMER CR 50 E 9100 2 Both Anytime Anytime 7 PM to 6 AM Anytime Anytime 7 PM to 9 AM
001A 0.35 3.71 LARIMER CR 50 E LARIMER CR 58 7400 2 Both Anytime Anytime
6 PM to 7 AM
9 AM to 11 AM
Anytime Anytime 6 PM to 10 AM
001A 3.71 9.41 LARIMER CR 58 1ST ST WELLINGTON 4700 2 Both Anytime Anytime Anytime Anytime Anytime Anytime
001A 9.41 10.05 1ST ST WELLINGTON I-25 (WELLINGTON INTERCHANGE) 10000 3 Both Anytime Anytime Anytime Anytime Anytime Anytime
006I 343.72 346.70 I-76 MORGAN CR 3 INTERCHANGE EASTBOUND I-76 ON RAMP WIGGINS 3800 2 Both Anytime Anytime 9 PM to 4 PM Anytime Anytime Anytime
006J 371.69 376.22 I-76 INTERCHANGE BRUSH MORGAN CR W HILLROSE 1700 4 Both Anytime Anytime Anytime Anytime Anytime Anytime
006J 376.22 397.96 MORGAN CR W HILLROSE 5TH ST ATWOOD 1700 2 Both Anytime Anytime Anytime Anytime Anytime Anytime
006J 397.96 403.86 5TH ST ATWOOD FRONT ST STERLING 5100 4 Both Anytime Anytime Anytime Anytime Anytime Anytime
006J 403.86 404.15 FRONT ST STERLING DIVISION AVE STERLING 3300 2 Both Anytime Anytime Anytime Anytime Anytime Anytime
006J 404.15 404.64 DIVISION AVE STERLING (BEGIN EB 1-WAY) SH 138 STERLING (END EB 1-WAY) 5400 3 EB Anytime Anytime Anytime Anytime Anytime Anytime
006J 404.64 407.18 CHESTNUT ST STERLING LEAVE STERLING URBAN LIMIT 12000 4 Both Anytime Anytime Anytime Anytime Anytime Anytime
006J 407.18 436.50 LEAVE STERLING URBAN LIMIT SH 59 HAXTUN 2600 2 Both Anytime Anytime Anytime Anytime Anytime Anytime
006J 436.50 444.76 SH 59 HAXTUN PHILLIPS CR 21 PAOLI 1800 4 Both Anytime Anytime Anytime Anytime Anytime Anytime
006J 444.76 453.81 PHILLIPS CR 21 PAOLI SHERMAN AVE HOLYOKE 1600 2 Both Anytime Anytime Anytime Anytime Anytime Anytime
006J 453.81 453.94 SHERMAN AVE HOLYOKE BELFORD AVE HOLYOKE 3300 3 Both Anytime Anytime Anytime Anytime Anytime Anytime
006J 453.94 454.32 S BELFORD AVE HOLYOKE MORLAN AVE HOLYOKE 5100 4 Both Anytime Anytime Anytime Anytime Anytime Anytime
006J 454.32 454.62 MORLAN AVE HOLYOKE WORLEY AVE HOLYOKE 4400 3 Both Anytime Anytime Anytime Anytime Anytime Anytime
006J 454.62 467.28 WORLEY AVE HOLYOKE NEBRASKA STATE LINE 2000 2 Both Anytime Anytime Anytime Anytime Anytime Anytime
006Z 0.00 0.09 N 3RD ST & W CHESTNUT ST STERLING N 4TH ST & W CHESTNUT ST STERLING 6300 3 Both Anytime Anytime Anytime Anytime Anytime Anytime
006Z 0.09 0.60 CHESTNUT ST STERLING (BEGIN WB 1-WAY) DIVISION AVE STERLING (END WB 1-WAY) 5900 3 WB Anytime Anytime Anytime Anytime Anytime Anytime
007A 0.00 0.58 US 36 ESTES PARK GRAVES AVE ESTES PARK EB Anytime Anytime Anytime Anytime Anytime Anytime
007A 0.58 0.00 GRAVES AVE ESTES PARK US 36 ESTES PARK WB Anytime Anytime Anytime Anytime Anytime Anytime
007A 0.58 1.65 GRAVES AVE ESTES PARK PEAK VIEW DR ESTES PARK 9300 3 Both Anytime Anytime Anytime Anytime Anytime Anytime
007A 1.65 3.48 PEAK VIEW DR ESTES PARK MARY'S LAKE RD S/O ESTES PARK 6500 2 Both Anytime Anytime 5 PM to Noon Anytime Anytime 6 PM to 9 AM
007A 3.48 3.88 MARY'S LAKE RD S/O ESTES PARK FISH CREEK WAY LARIMER COUNTY 3800 2 Both Anytime Anytime Anytime Anytime Anytime Anytime
007A 3.88 33.00 FISH CREEK WAY LARIMER COUNTY BROADWAY ST LYONS WB 3400 2 Both Anytime Anytime Anytime Anytime Anytime 5 PM to 10 AM
007B 49.51 50.53 BROADWAY BOULDER 26TH ST BOULDER 25000 4 Both
9 PM to 5 AM
9 AM to 1 PM
9 PM to 5 AM
9 AM to 1 PM
9 PM to 5 AM
9 AM to 1 PM
9 PM to Noon 9 PM to Noon 9 PM to Noon
007B 50.53 50.64 26TH ST BOULDER US 36 (28TH ST) BOULDER EB 9 PM to 1 PM 9 PM to 1 PM 9 PM to 1 PM 9 PM to Noon 9 PM to Noon 9 PM to Noon
007B 50.64 50.53 US 36 (28TH ST) BOULDER 26TH ST BOULDER WB 5 PM to 2 PM 5 PM to 2 PM 5 PM to 2 PM Anytime Anytime Anytime
007C 52.49 54.33 US 36 (28TH ST) BOULDER 55TH ST BOULDER EB 9 PM to 5 AM 9 PM to 5 AM 9 PM to 5 AM Anytime Anytime Anytime
007C 54.33 52.49 55TH ST BOULDER US 36 (28TH ST) BOULDER WB 9 PM to 5 AM 9 PM to 5 AM 9 PM to 5 AM Anytime Anytime Anytime
007C 54.33 55.25 55TH ST BOULDER 63RD ST BOULDER COUNTY EB 9 PM to 5 AM 9 PM to 5 AM 9 PM to 5 AM Anytime Anytime Anytime
007C 55.25 54.33 63RD ST BOULDER COUNTY 55TH ST BOULDER WB 9 PM to 5 AM 9 PM to 5 AM 9 PM to 5 AM Anytime Anytime Anytime
Spring/Summer: April – October, Fall/Winter: November – March
22000 4
35000 6
28000 5
# of
Lanes
Dir.
Fall/Winter Weekday Allowed Hours: Fall/Winter Weekend Allowed Hours:
8800 4
State
Highway
Number
Beginning of
Section MP#
End of
Section
MP #
Beginning of Section - Description End of Section - Description
2018 Volume
(AADT)
Page D-1

CDOT Region 4 Appendix D - Fall/Winter Single-Lane Closure Allowed Hours Lane Closure Strategy - 4th Ed.
0.0 - 0.5 mile
Lane Closure
0.5 - 1.0 mile
Lane Closure
> 1.0 mile
Lane Closure
0.0 - 0.5 mile
Lane Closure
0.5 - 1.0 mile
Lane Closure
> 1.0 mile
Lane Closure
Spring/Summer: April – October, Fall/Winter: November – March
# of
Lanes
Dir.
Fall/Winter Weekday Allowed Hours: Fall/Winter Weekend Allowed Hours:
State
Highway
Number
Beginning of
Section MP#
End of
Section
MP #
Beginning of Section - Description End of Section - Description
2018 Volume
(AADT)
007C 55.25 56.77 63RD ST BOULDER COUNTY 75TH ST BOULDER COUNTY 21000 3 Both 9 PM to 5 AM 9 PM to 5 AM 9 PM to 5 AM Anytime Anytime Anytime
007C 56.77 59.46 75TH ST BOULDER COUNTY 95TH ST LAFAYETTE 21000 2 Both 9 PM to 5 AM 9 PM to 5 AM 10 PM to 5 AM 7 PM to 10 AM 7 PM to 9 AM 11 PM to 7 AM
007C 59.46 60.68 95TH ST LAFAYETTE US 287 LAFAYETTE 16000 2 Both 9 PM to 5 AM 9 PM to 5 AM 9 PM to 5 AM 6 PM to 11 AM 7 PM to 10 AM 10 PM to 8 AM
007E 0.00 1.59 BUS. LOOP ALLENS PARK SKI RD ALLENS PARK 770 2 Both Anytime Anytime Anytime Anytime Anytime Anytime
011A 0.00 1.35 SH 138 SEDGWICK COLORADO NEBRASKA STATE LINE 480 2 Both Anytime Anytime Anytime Anytime Anytime Anytime
014B 64.82 121.69 WEST END OF CAMERON PASS US 287 LARIMER COUNTY 3000 2 Both Anytime Anytime Anytime 9 PM to 5 AM 9 PM to 5 AM 9 PM to 5 AM
014C 134.73 135.71 S COLLEGE AVE FORT COLLINS MULBERRY ST / RIVERSIDE AVE FORT COLLINS EB
9 PM to 5 AM
9 AM to 4 PM
9 PM to 5 AM
9 AM to 4 PM
9 PM to 5 AM
9 AM to 4 PM
Anytime Anytime Anytime
014C 135.71 134.73 MULBERRY ST / RIVERSIDE AVE FORT COLLINS S COLLEGE AVE FORT COLLINS WB
9 PM to 5 AM
9 AM to 4 PM
9 PM to 5 AM
9 AM to 4 PM
9 PM to 5 AM
9 AM to 4 PM
Anytime Anytime Anytime
014C 135.71 136.05 MULBERRY ST / RIVERSIDE AVE FORT COLLINS LEMAY ST FORT COLLINS EB
9 PM to 5 AM
9 AM to 4 PM
9 PM to 5 AM
9 AM to 4 PM
9 PM to 5 AM
9 AM to 4 PM
6 PM to Noon 6 PM to Noon 6 PM to Noon
014C 136.05 135.71 LEMAY ST FORT COLLINS MULBERRY ST / RIVERSIDE AVE FORT COLLINS WB
9 PM to 5 AM
9 AM to 4 PM
9 PM to 5 AM
9 AM to 4 PM
9 PM to 5 AM
9 AM to 4 PM
6 PM to 9 AM 6 PM to 9 AM 6 PM to 9 AM
014C 136.05 137.62 LEMAY ST FORT COLLINS S SUMMIT VIEW DR FORT COLLINS EB
9 PM to 5 AM
9 AM to 1 PM
9 PM to 5 AM
9 AM to 1 PM
9 PM to 5 AM
9 AM to 1 PM
7 PM to 9 AM 7 PM to 9 AM 7 PM to 9 AM
014C 137.62 136.05 S SUMMIT VIEW DR FORT COLLINS LEMAY ST FORT COLLINS WB
9 PM to 5 AM
10 AM to 1 PM
9 PM to 5 AM
10 AM to 1 PM
9 PM to 5 AM
10 AM to 1 PM
7 PM to 9 AM 7 PM to 9 AM 7 PM to 9 AM
014C 137.62 138.75 S SUMMIT VIEW DR FORT COLLINS SW FRONTAGE RD FORT COLLINS EB
9 PM to 5 AM
9 AM to 4 PM
9 PM to 5 AM
9 AM to 4 PM
9 PM to 5 AM
9 AM to 4 PM
6 PM to 11 AM 6 PM to 11 AM 6 PM to 11 AM
014C 138.75 137.62 SW FRONTAGE RD FORT COLLINS S SUMMIT VIEW DR FORT COLLINS WB
9 PM to 5 AM
9 AM to 4 PM
9 PM to 5 AM
9 AM to 4 PM
9 PM to 5 AM
9 AM to 4 PM
6 PM to 9 AM 6 PM to 9 AM 6 PM to 9 AM
014C 138.75 138.97 SW FRONTAGE RD FORT COLLINS I-25 INTERCHANGE FORT COLLINS EB
9 PM to 5 AM
9 AM to 1 PM
9 PM to 5 AM
9 AM to 1 PM
9 PM to 5 AM
9 AM to 1 PM
7 PM to 9 AM 7 PM to 9 AM 7 PM to 9 AM
014C 138.97 138.75 I-25 INTERCHANGE FORT COLLINS SW FRONTAGE RD FORT COLLINS WB
9 PM to 5 AM
10 AM to Noon
9 PM to 5 AM
10 AM to Noon
9 PM to 5 AM
10 AM to Noon
7 PM to 9 AM 7 PM to 9 AM 7 PM to 9 AM
014C 138.97 139.46 I-25 INTERCHANGE FORT COLLINS CHANGE WIDTH e/o BOX ELDER CREEK EB
9 PM to 5 AM
9 AM to 3 PM
9 PM to 5 AM
9 AM to 3 PM
9 PM to 5 AM
9 AM to 3 PM
Anytime Anytime Anytime
014C 139.46 138.97 CHANGE WIDTH e/o BOX ELDER CREEK I-25 INTERCHANGE FORT COLLINS WB
9 PM to 5 AM
9 AM to 3 PM
9 PM to 5 AM
9 AM to 3 PM
9 PM to 5 AM
9 AM to 3 PM
Anytime Anytime Anytime
014C 139.46 142.18 CHANGE WIDTH e/o BOX ELDER CREEK WELD CR 1 11000 2 Both
9 PM to 5 AM
8 AM to 3 PM
9 PM to 5 AM
9 AM to Noon
9 PM to 5 AM Anytime 2 PM to 11 AM 9 PM to 5 AM
014C 142.18 144.15 WELD CR 1 SH 257 WELD COUNTY 9700 2 Both
9 PM to 5 AM
8 AM to 4 PM
9 PM to 5 AM
8 AM to 3 PM
9 PM to 5 AM Anytime Anytime 9 PM to 8 AM
014C 144.15 152.16 SH 257 WELD COUNTY WELD CR 33 8500 2 Both Anytime
9 PM to 5 AM
8 AM to 4 PM
9 PM to 5 AM Anytime Anytime 9 PM to 9 AM
014C 152.16 153.37 WELD CR 33 SH 85 AULT 5800 2 Both Anytime Anytime 6 PM to 6 AM Anytime Anytime Anytime
014C 153.37 222.20 SH 85 AULT LOGAN CR 11 4000 2 Both Anytime Anytime Anytime Anytime Anytime Anytime
014C 222.20 229.23 LOGAN CR 11 LOGAN CR 25 1600 3 Both Anytime Anytime Anytime Anytime Anytime Anytime
014C 229.23 234.26 LOGAN CR 25 LOGAN CR 35 3800 2 Both Anytime Anytime
9 PM to 5 AM
8 AM to Noon
Anytime Anytime Anytime
014C 234.26 236.92 LOGAN CR 35 US 6 NE (3RD ST) RD SE (MAIN ST) -- END SH 14 17000 4 Both Anytime Anytime Anytime Anytime Anytime Anytime
023A 0.00 17.84 US 385 HOLYOKE COLORADO NEBRASKA STATE LINE 510 2 Both Anytime Anytime Anytime Anytime Anytime Anytime
024B 419.32 437.00 CR 12.00 W/O SEIBERT SH 57 (KANSAS AVE) IN STRATTON 760 2 Both Anytime Anytime Anytime Anytime Anytime Anytime
024C 437.55 454.87 SH 57 (CR 31) IN STRATTON US 385 IN BURLINGTON 2800 2 Both Anytime Anytime Anytime Anytime Anytime Anytime
024D 456.00 457.29 7TH ST IN BURLINGTON NORTH I-70 FRONTAGE ROAD IN BURLINGTON 4000 2 Both Anytime Anytime Anytime Anytime Anytime Anytime
024F 0.00 0.48 US 40 IN LIMON I-70 INTERCHANGE (#259) 6100 2 Both Anytime Anytime Anytime Anytime Anytime Anytime
024G 350.58 377.40 EL PASO / ELBERT COUNTY LINE N AVE - LIMON 4700 2 Both Anytime Anytime 9 PM to 4 PM Anytime Anytime Anytime
024G 377.40 379.29 N AVE - LIMON LAKE CREEK 6400 2 Both Anytime Anytime Anytime Anytime Anytime Anytime
34000 4
41000 4
20000 4
22000 4
31000 4
40000 4
Page D-2

CDOT Region 4 Appendix D - Fall/Winter Single-Lane Closure Allowed Hours Lane Closure Strategy - 4th Ed.
0.0 - 0.5 mile
Lane Closure
0.5 - 1.0 mile
Lane Closure
> 1.0 mile
Lane Closure
0.0 - 0.5 mile
Lane Closure
0.5 - 1.0 mile
Lane Closure
> 1.0 mile
Lane Closure
Spring/Summer: April – October, Fall/Winter: November – March
# of
Lanes
Dir.
Fall/Winter Weekday Allowed Hours: Fall/Winter Weekend Allowed Hours:
State
Highway
Number
Beginning of
Section MP#
End of
Section
MP #
Beginning of Section - Description End of Section - Description
2018 Volume
(AADT)
024G 379.29 380.46 LAKE CREEK I-70 INTERCHANGE (#363) 1900 2 Both Anytime Anytime Anytime Anytime Anytime Anytime
025A 229.11 235.15 SH 7/ BASELINE RD BROOMFIELD COUNTY SH 52 / DACONO / FT LUPTON NB 9 PM to 5 AM 9 PM to 5 AM 9 PM to 5 AM 9 PM to 5 AM 9 PM to 5 AM 9 PM to 5 AM
025A 235.15 229.11 SH 52 / DACONO / FT LUPTON SH 7/ BASELINE RD BROOMFIELD COUNTY SB 9 PM to 5 AM 9 PM to 5 AM 9 PM to 5 AM 9 PM to 5 AM 9 PM to 5 AM 9 PM to 5 AM
025A 235.15 243.15 SH 52 / DACONO / FT LUPTON SH 66 NB 9 PM to 5 AM 9 PM to 5 AM 9 PM to 5 AM 9 PM to 5 AM 9 PM to 5 AM 9 PM to 5 AM
025A 243.15 235.15 SH 66 SH 52 / DACONO / FT LUPTON SB 9 PM to 5 AM 9 PM to 5 AM 9 PM to 5 AM 9 PM to 5 AM 9 PM to 5 AM 9 PM to 5 AM
025A 243.15 247.00 SH 66 SOUTHBOUND PASSING LANE END NB 10 PM to 5 AM 10 PM to 5 AM 10 PM to 5 AM 9 PM to 5 AM 9 PM to 5 AM 9 PM to 5 AM
025A 247.00 243.15 SOUTHBOUND PASSING LANE END SH 66 SB 9 PM to 5 AM 9 PM to 5 AM 9 PM to 5 AM 9 PM to 5 AM 9 PM to 5 AM 9 PM to 5 AM
025A 247.00 250.00 SOUTHBOUND PASSING LANE END SOUTHBOUND PASSING LANE START NB 10 PM to 5 AM 10 PM to 5 AM 10 PM to 5 AM 9 PM to 5 AM 9 PM to 5 AM 9 PM to 5 AM
025A 250.00 247.00 SOUTHBOUND PASSING LANE START SOUTHBOUND PASSING LANE END SB 9 PM to 5 AM 9 PM to 5 AM 9 PM to 5 AM 9 PM to 5 AM 9 PM to 5 AM 9 PM to 5 AM
025A 250.00 265.41 SOUTHBOUND PASSING LANE START HARMONY ROAD INTERCHANGE NB 9 PM to 5 AM 9 PM to 5 AM 9 PM to 5 AM 9 PM to 5 AM 9 PM to 5 AM 9 PM to 5 AM
025A 265.41 250.00 HARMONY ROAD INTERCHANGE SOUTHBOUND PASSING LANE START SB 9 PM to 5 AM 9 PM to 5 AM 9 PM to 5 AM 9 PM to 5 AM 9 PM to 5 AM 9 PM to 5 AM
025A 265.41 271.37 HARMONY ROAD INTERCHANGE MTN VISTA DRIVE INTERCHANGE NB 9 PM to 5 AM 9 PM to 5 AM 9 PM to 5 AM 9 PM to 5 AM 9 PM to 5 AM 9 PM to 5 AM
025A 271.37 265.41 MTN VISTA DRIVE INTERCHANGE HARMONY ROAD INTERCHANGE SB 9 PM to 5 AM 9 PM to 5 AM 9 PM to 5 AM 9 PM to 5 AM 9 PM to 5 AM 9 PM to 5 AM
025A 271.37 277.94 MTN VISTA DRIVE INTERCHANGE SH 1 / WELLINGTON NB 6 PM to 4 PM 6 PM to 4 PM 6 PM to 4 PM Anytime Anytime Anytime
025A 277.94 271.37 SH 1 / WELLINGTON MTN VISTA DRIVE INTERCHANGE SB 6 PM to 4 PM 6 PM to 4 PM 6 PM to 4 PM 11 AM to 9 AM 11 AM to 9 AM 11 AM to 9 AM
025A 277.94 298.88 SH 1 / WELLINGTON WYOMING STATE LINE NB Anytime Anytime Anytime Anytime Anytime Anytime
025A 298.88 277.94 WYOMING STATE LINE SH 1 / WELLINGTON SB Anytime Anytime Anytime Anytime Anytime Anytime
034A 57.69 59.19 RMNP TOLLGATE FISH HATCHERY RD ESTES PARK 2800 2 Both Anytime Anytime Anytime Anytime Anytime Anytime
034A 59.19 60.97 FISH HATCHERY RD ESTES PARK BEGIN US 34 BUSINESS ESTES PARK 5100 2 Both Anytime Anytime Anytime Anytime Anytime 4 PM to Noon
034A 60.97 61.93 BEGIN US 34 BUSINESS ESTES PARK BIG HORN DRIVE ESTES PARK 3900 2 Both Anytime Anytime Anytime Anytime Anytime Anytime
034A 61.93 62.51 BIG HORN DRIVE ESTES PARK E ELKHORN AVE ESTES PARK 6700 2 Both Anytime Anytime Anytime Anytime Anytime Anytime
034A 62.51 63.19 E ELKHORN AVE ESTES PARK SUMMIT DR ESTES PARK EB Anytime Anytime Anytime Anytime Anytime Anytime
034A 63.19 62.51 SUMMIT DR ESTES PARK E ELKHORN AVE ESTES PARK WB Anytime Anytime Anytime Anytime Anytime Anytime
034A 63.19 64.23 SUMMIT DR ESTES PARK CR 63E ESTES PARK 12000 3 Both Anytime Anytime Anytime Anytime Anytime Anytime
034A 64.23 75.58 CR 63E ESTES PARK DEVILS GULCH RD DRAKE 6600 2 Both Anytime Anytime Anytime Anytime Anytime 9 PM to 10 AM
034A 75.58 83.50 DEVILS GULCH RD DRAKE START 4-LANE SECTION 5200 2 Both Anytime Anytime Anytime Anytime Anytime 5 PM to 11 AM
034A 83.50 84.10 START 4-LANE SECTION END 4-LANE SECTION 5200 4 Both Anytime Anytime Anytime Anytime Anytime Anytime
034A 84.10 84.76 END 4-LANE SECTION LARIMER CR 29 5200 2 Both Anytime Anytime Anytime Anytime Anytime 5 PM to 11 AM
034A 84.76 87.69 LARIMER CR 29 LARIMER CR 27 8800 2 Both Anytime Anytime 9 PM to 11 AM Anytime 4 PM to Noon 9 PM to 9 AM
034A 87.69 88.68 LARIMER CR 27 MORNING DR LOVELAND 12000 2 Both Anytime Anytime 6 PM to 8 AM Anytime Anytime 6 PM to 9 AM
034A 88.68 89.39 MORNING DR LOVELAND NAMAQUA AVE LOVELAND EB
9 PM to 5 AM
9 AM to 4 PM
9 PM to 5 AM
9 AM to 4 PM
9 PM to 5 AM
9 AM to 4 PM
Anytime Anytime Anytime
034A 89.39 88.68 NAMAQUA AVE LOVELAND MORNING DR LOVELAND WB
9 PM to 5 AM
9 AM to 4 PM
9 PM to 5 AM
9 AM to 4 PM
9 PM to 5 AM
9 AM to 4 PM
Anytime Anytime Anytime
16000 4
34000 4
25000 4
18000 4
84000 5
87000 4
71000 4
127000 6
104000 6
84000 4
Page D-3

CDOT Region 4 Appendix D - Fall/Winter Single-Lane Closure Allowed Hours Lane Closure Strategy - 4th Ed.
0.0 - 0.5 mile
Lane Closure
0.5 - 1.0 mile
Lane Closure
> 1.0 mile
Lane Closure
0.0 - 0.5 mile
Lane Closure
0.5 - 1.0 mile
Lane Closure
> 1.0 mile
Lane Closure
Spring/Summer: April – October, Fall/Winter: November – March
# of
Lanes
Dir.
Fall/Winter Weekday Allowed Hours: Fall/Winter Weekend Allowed Hours:
State
Highway
Number
Beginning of
Section MP#
End of
Section
MP #
Beginning of Section - Description End of Section - Description
2018 Volume
(AADT)
034A 89.39 90.28 NAMAQUA AVE LOVELAND VAN BUREN AVE LOVELAND EB
9 PM to 5 AM
9 AM to 4 PM
9 PM to 5 AM
9 AM to 4 PM
9 PM to 5 AM
9 AM to 4 PM
Anytime Anytime Anytime
034A 90.28 89.39 VAN BUREN AVE LOVELAND NAMAQUA AVE LOVELAND WB
9 PM to 5 AM
9 AM to 4 PM
9 PM to 5 AM
9 AM to 4 PM
9 PM to 5 AM
9 AM to 4 PM
Anytime Anytime Anytime
034A 90.28 96.03 VAN BUREN AVE LOVELAND WEST I-25 FRONTAGE ROAD EB 9 PM to 5 AM 9 PM to 5 AM 9 PM to 5 AM 8 PM to Noon 8 PM to Noon 8 PM to Noon
034A 96.03 90.28 WEST I-25 FRONTAGE ROAD VAN BUREN AVE LOVELAND WB 9 PM to 5 AM 9 PM to 5 AM 9 PM to 5 AM 7 PM to 9 AM 7 PM to 9 AM 7 PM to 9 AM
034A 96.03 98.84 WEST I-25 FRONTAGE ROAD LARIMER-WELD COUNTY LINE EB 9 PM to 5 AM 9 PM to 5 AM 9 PM to 5 AM 8 PM to Noon 8 PM to Noon 8 PM to Noon
034A 98.84 96.03 LARIMER-WELD COUNTY LINE WEST I-25 FRONTAGE ROAD WB 9 PM to 5 AM 9 PM to 5 AM 9 PM to 5 AM 6 PM to 9 AM 6 PM to 9 AM 6 PM to 9 AM
034A 98.84 102.48 LARIMER-WELD COUNTY LINE US 34D INTERCHANGE GREELEY EB 9 PM to 5 AM 9 PM to 5 AM 9 PM to 5 AM 7 PM to Noon 7 PM to Noon 7 PM to Noon
034A 102.48 98.84 US 34D INTERCHANGE GREELEY LARIMER-WELD COUNTY LINE WB 9 PM to 5 AM 9 PM to 5 AM 9 PM to 5 AM 6 PM to 9 AM 6 PM to 9 AM 6 PM to 9 AM
034A 102.48 102.80 US 34D INTERCHANGE GREELEY SH 257 (ENTER GREELEY) EB
9 PM to 5 AM
9 AM to 4 PM
9 PM to 5 AM
9 AM to 4 PM
9 PM to 5 AM
9 AM to 4 PM
Anytime Anytime Anytime
034A 102.80 102.48 SH 257 (ENTER GREELEY) US 34D INTERCHANGE GREELEY WB
9 PM to 5 AM
9 AM to 4 PM
9 PM to 5 AM
9 AM to 4 PM
9 PM to 5 AM
9 AM to 4 PM
Anytime Anytime Anytime
034A 102.80 107.61 SH 257 (ENTER GREELEY) 65TH AVE GREELEY EB
9 PM to 5 AM
9 AM to 4 PM
9 PM to 5 AM
9 AM to 4 PM
9 PM to 5 AM
9 AM to 4 PM
6 PM to 3 PM 6 PM to 3 PM 6 PM to 3 PM
034A 107.61 102.80 65TH AVE GREELEY SH 257 (ENTER GREELEY) WB
9 PM to 5 AM
9 AM to 4 PM
9 PM to 5 AM
9 AM to 4 PM
9 PM to 5 AM
9 AM to 4 PM
5 PM to 11 AM 5 PM to 11 AM 5 PM to 11 AM
034A 107.61 112.23 65TH AVE GREELEY 11TH AVE GREELEY EB 9 PM to 5 AM 9 PM to 5 AM 9 PM to 5 AM 7 PM to 1 PM 7 PM to 1 PM 7 PM to 1 PM
034A 112.23 107.61 11TH AVE GREELEY 65TH AVE GREELEY WB 9 PM to 5 AM 9 PM to 5 AM 9 PM to 5 AM 5 PM to 9 AM 5 PM to 9 AM 5 PM to 9 AM
034A 112.23 113.14 11TH AVE GREELEY EB SH 85 OVERPASS GREELEY EB 9 PM to 5 AM 9 PM to 5 AM 9 PM to 5 AM 6 PM to 1 PM 6 PM to 1 PM 6 PM to 1 PM
034A 113.14 112.23 EB SH 85 OVERPASS GREELEY 11TH AVE GREELEY WB 9 PM to 5 AM 9 PM to 5 AM 9 PM to 5 AM 5 PM to 11 AM 5 PM to 11 AM 5 PM to 11 AM
034A 113.14 135.61 EB SH 85 OVERPASS GREELEY MORGAN CR 386 EB Anytime Anytime Anytime Anytime Anytime Anytime
034A 135.61 113.14 MORGAN CR 386 EB SH 85 OVERPASS GREELEY WB Anytime Anytime Anytime Anytime Anytime Anytime
034A 135.61 149.63 MORGAN CR 386 SH 39 OVERPASS WIGGINS 5700 2 Both Anytime Anytime 7 PM to 6 AM Anytime Anytime 6 PM to 11 AM
034B 159.00 162.26 I-76 FORT MORGAN INTERCHANGE LANE ST FORT MORGAN 3600 2 Both Anytime Anytime Anytime Anytime Anytime Anytime
034B 162.26 168.47 LANE ST FORT MORGAN CR 24 FORT MORGAN 12000 4 Both Anytime Anytime Anytime Anytime Anytime Anytime
034B 168.47 172.74 CR 24 FORT MORGAN EDMUNDS ST BRUSH 6800 2 Both Anytime Anytime 9 PM to 5 AM Anytime Anytime 9 PM to 8 AM
034B 172.74 173.85 EDMUNDS ST BRUSH US 34 SPUR TO I-76 BRUSH 4300 4 Both Anytime Anytime Anytime Anytime Anytime Anytime
034B 173.85 195.84 US 34 SPUR TO I-76 BRUSH CUSTER AVE AKRON 3200 2 Both Anytime Anytime Anytime Anytime Anytime Anytime
034B 195.84 204.06 CUSTER AVE AKRON CR KK PLATNER WASHINGTON COUNTY 5700 4 Both Anytime Anytime Anytime Anytime Anytime Anytime
034B 204.06 222.77 CR KK PLATNER WASHINGTON COUNTY S DATE ST YUMA 2900 2 Both Anytime Anytime Anytime Anytime Anytime Anytime
034B 222.77 223.35 S DATE ST YUMA SH 59 YUMA 7100 4 Both Anytime Anytime Anytime Anytime Anytime Anytime
034B 223.35 223.84 SH 59 YUMA IDLEWILD YUMA 6000 2 Both Anytime Anytime 2 PM to 1 PM Anytime Anytime Anytime
034B 223.84 248.06 IDLEWILD YUMA CR 35 WRAY 3100 2 Both Anytime Anytime Anytime Anytime Anytime Anytime
034B 248.06 250.48 CR 35 WRAY DOUGLAS ST WRAY 4800 2 Both Anytime Anytime 2 PM to 1 PM Anytime Anytime Anytime
034B 250.48 259.51 DOUGLAS ST WRAY COLORADO NEBRASKA STATE LINE 3000 2 Both Anytime Anytime Anytime Anytime Anytime Anytime
034C 1.30 1.69 MAC GREGOR AVE ESTES PARK ST VRAIN AVENUE EB Anytime Anytime Anytime Anytime Anytime Anytime
034C 1.69 1.30 ST VRAIN AVENUE MAC GREGOR AVE ESTES PARK WB Anytime Anytime Anytime Anytime Anytime Anytime
18000 4
14000 4
35000 4
43000 4
40000 4
52000 4
49000 4
28000 4
25000 4
54000 4
Page D-4

CDOT Region 4 Appendix D - Fall/Winter Single-Lane Closure Allowed Hours Lane Closure Strategy - 4th Ed.
0.0 - 0.5 mile
Lane Closure
0.5 - 1.0 mile
Lane Closure
> 1.0 mile
Lane Closure
0.0 - 0.5 mile
Lane Closure
0.5 - 1.0 mile
Lane Closure
> 1.0 mile
Lane Closure
Spring/Summer: April – October, Fall/Winter: November – March
# of
Lanes
Dir.
Fall/Winter Weekday Allowed Hours: Fall/Winter Weekend Allowed Hours:
State
Highway
Number
Beginning of
Section MP#
End of
Section
MP #
Beginning of Section - Description End of Section - Description
2018 Volume
(AADT)
034D 0.00 1.86 BEGIN GREELEY BUSINESS LOOP SH 257 WELD COUNTY EB
9 PM to 5 AM
9 AM to 4 PM
9 PM to 5 AM
9 AM to 4 PM
9 PM to 5 AM
9 AM to 4 PM
5 PM to 11 AM 5 PM to 11 AM 5 PM to 11 AM
034D 1.86 0.00 SH 257 WELD COUNTY BEGIN GREELEY BUSINESS LOOP WB
9 PM to 5 AM
9 AM to 4 PM
9 PM to 5 AM
9 AM to 4 PM
9 PM to 5 AM
9 AM to 4 PM
5 PM to 11 AM 5 PM to 11 AM 5 PM to 11 AM
034D 1.86 4.67 SH 257 WELD COUNTY 71ST AVE GREELEY EB
9 PM to 5 AM
9 AM to 4 PM
9 PM to 5 AM
9 AM to 4 PM
9 PM to 5 AM
9 AM to 4 PM
5 PM to 11 AM 5 PM to 11 AM 5 PM to 11 AM
034D 4.67 1.86 71ST AVE GREELEY SH 257 WELD COUNTY WB
9 PM to 5 AM
9 AM to 4 PM
9 PM to 5 AM
9 AM to 4 PM
9 PM to 5 AM
9 AM to 4 PM
5 PM to 11 AM 5 PM to 11 AM 5 PM to 11 AM
034D 4.67 8.25 71ST AVE GREELEY 28TH AVE GREELEY EB
9 PM to 5 AM
9 AM to 3 PM
9 PM to 5 AM
9 AM to 3 PM
9 PM to 5 AM
9 AM to 3 PM
5 PM to 11 AM 5 PM to 11 AM 5 PM to 11 AM
034D 8.25 4.67 28TH AVE GREELEY 71ST AVE GREELEY WB
9 PM to 5 AM
9 AM to 1 PM
9 PM to 5 AM
9 AM to 1 PM
9 PM to 5 AM
9 AM to 1 PM
5 PM to 11 AM 5 PM to 11 AM 5 PM to 11 AM
034D 8.25 8.77 28TH AVE GREELEY BEGIN 1-WAY EB GREELEY EB
9 PM to 5 AM
9 AM to 4 PM
9 PM to 5 AM
9 AM to 4 PM
9 PM to 5 AM
9 AM to 4 PM
5 PM to 11 AM 5 PM to 11 AM 5 PM to 11 AM
034D 8.77 8.25 BEGIN 1-WAY WB GREELEY 28TH AVE GREELEY WB
9 PM to 5 AM
9 AM to 4 PM
9 PM to 5 AM
9 AM to 4 PM
9 PM to 5 AM
9 AM to 4 PM
5 PM to 11 AM 5 PM to 11 AM 5 PM to 11 AM
034D 8.77 10.00 BEGIN 1-WAY EB (10TH ST) GREELEY 10TH AVE GREELEY 10000 3 EB Anytime Anytime Anytime Anytime Anytime Anytime
034D 10.00 11.06 10TH AVE GREELEY US 85 BUSINESS LOOP EB Anytime Anytime Anytime Anytime Anytime Anytime
034D 11.06 10.00 US 85 BUSINESS LOOP 10TH AVE GREELEY WB Anytime Anytime Anytime Anytime Anytime Anytime
034D 11.06 14.71 US 85 BUSINESS LOOP US 34A 5300 2 Both Anytime Anytime 9 PM to Noon Anytime Anytime Anytime
034E 0.00 0.93 US 34 I-76 BRUSH INTERCHANGE 3000 2 Both Anytime Anytime Anytime Anytime Anytime Anytime
034F 0.00 0.03 US 34 END OF CDOT MAINTENANCE 1700 2 Both
9 PM to 5 AM
9 AM to 4 PM
9 PM to 5 AM
9 AM to 4 PM
9 PM to 5 AM
9 AM to 4 PM
5 PM to 11 AM 5 PM to 11 AM 5 PM to 11 AM
034Z 0.00 1.30 BEGIN 1-WAY WB (9TH ST) GREELEY WEST OF 23RD AVE GREELEY 11000 3 WB Anytime Anytime Anytime Anytime Anytime Anytime
036A 3.09 4.96 RMNP TOLLGATE SH 66 SOUTHWEST 6400 2 Both Anytime Anytime Anytime Anytime Anytime 5 PM to 10 AM
036A 4.96 6.38 SH 66 SOUTHWEST DAVIS ST ESTES PARK 12000 2 Both Anytime Anytime 9 PM to 9 AM 5 PM to 10 AM 9 PM to 9 AM 9 PM to 8 AM
036A 6.38 6.98 DAVIS ST ESTES PARK US 34 BUSINESS LOOP 11000 2 Both Anytime Anytime 9 PM to 9 AM 5 PM to 10 AM 9 PM to 9 AM 9 PM to 8 AM
036B 0.00 0.71 ELKHORN AVE ESTES PARK 4TH ST ESTES PARK EB Anytime Anytime Anytime Anytime Anytime Anytime
036B 0.71 0.00 4TH ST ESTES PARK ELKHORN AVE ESTES PARK WB Anytime Anytime Anytime Anytime Anytime Anytime
036B 0.71 20.30 SH 7 ESTES PARK BEGIN 1-WAY PAIR LYONS 9900 2 Both Anytime Anytime 6 PM to 7 AM 4 PM to 11 AM 5 PM to 10 AM 7 PM to 9 AM
036B 20.30 20.72 BEGIN 1-WAY PAIR LYONS END 1-WAY PAIR LYONS 7000 2 EB Anytime Anytime Anytime Anytime Anytime Anytime
036B 20.72 21.76 END 1-WAY PAIR LYONS JCT SH 66 BOULDER COUNTY EB Anytime Anytime Anytime Anytime Anytime Anytime
036B 21.76 20.72 JCT SH 66 BOULDER COUNTY END 1-WAY PAIR LYONS WB Anytime Anytime Anytime 1 PM to 9 AM 1 PM to 9 AM 1 PM to 9 AM
036B 21.76 32.18 JCT SH 66 BOULDER COUNTY BROADWAY 14000 2 Both 5 PM to 4 PM
6 PM to 7 AM
8 AM to 2 PM
7 PM to 6 AM 6 PM to 10 AM 6 PM to 9 AM 7 PM to 8 AM
036B 32.18 34.76 BROADWAY KALMIA PKWY BOULDER 24000 2 Both 9 PM to 5 AM 9 PM to 5 AM 9 PM to 5 AM 9 PM to 8 AM 9 PM to 8 AM 9 PM to 7 AM
036B 34.76 35.51 KALMIA PKWY BOULDER VALMONT RD BOULDER EB 9 PM to 1 PM 9 PM to 1 PM 9 PM to 1 PM 5 PM to Noon 5 PM to Noon 5 PM to Noon
036B 35.51 34.76 VALMONT RD BOULDER KALMIA PKWY BOULDER WB
5 PM to 5 AM
9 AM to Noon
5 PM to 5 AM
9 AM to Noon
5 PM to 5 AM
9 AM to Noon
5 PM to Noon 5 PM to Noon 5 PM to Noon
036B 35.51 35.98 VALMONT RD BOULDER PEARL ST BOULDER EB 9 PM to Noon 9 PM to Noon 9 PM to Noon 9 PM to 11 AM 9 PM to 11 AM 9 PM to 11 AM
036B 35.98 35.51 PEARL ST BOULDER VALMONT RD BOULDER WB 9 PM to 5 AM 9 PM to 5 AM 9 PM to 5 AM 9 PM to 10 AM 9 PM to 10 AM 9 PM to 10 AM
036B 35.98 36.34 PEARL ST BOULDER SH 119 EB 9 PM to 11 AM 9 PM to 11 AM 9 PM to 11 AM 9 PM to 11 AM 9 PM to 11 AM 9 PM to 11 AM
036B 36.34 35.98 SH 119 PEARL ST BOULDER WB 9 PM to 5 AM 9 PM to 5 AM 9 PM to 5 AM 9 PM to 9 AM 9 PM to 9 AM 9 PM to 9 AM
28000 4
32000 4
40000 4
17000 4
16000 4
17000 4
23000 4
30000 4
26000 4
22000 4
Page D-5

CDOT Region 4 Appendix D - Fall/Winter Single-Lane Closure Allowed Hours Lane Closure Strategy - 4th Ed.
0.0 - 0.5 mile
Lane Closure
0.5 - 1.0 mile
Lane Closure
> 1.0 mile
Lane Closure
0.0 - 0.5 mile
Lane Closure
0.5 - 1.0 mile
Lane Closure
> 1.0 mile
Lane Closure
Spring/Summer: April – October, Fall/Winter: November – March
# of
Lanes
Dir.
Fall/Winter Weekday Allowed Hours: Fall/Winter Weekend Allowed Hours:
State
Highway
Number
Beginning of
Section MP#
End of
Section
MP #
Beginning of Section - Description End of Section - Description
2018 Volume
(AADT)
036B 36.34 36.53 SH 119 SH 7 BOULDER COUNTY EAST EB 9 PM to 9 AM 9 PM to 9 AM 9 PM to 9 AM 9 PM to Noon 9 PM to Noon 9 PM to Noon
036B 36.53 36.34 SH 7 BOULDER COUNTY EAST SH 119 WB 9 PM to 8 AM 9 PM to 8 AM 9 PM to 8 AM 9 PM to 9 AM 9 PM to 9 AM 9 PM to 9 AM
036B 36.53 37.60 SH 7 BOULDER COUNTY EAST BASELINE ROAD INTERCHANGE BOULDER EB 9 PM to 9 AM 9 PM to 9 AM 9 PM to 9 AM 9 PM to Noon 9 PM to Noon 9 PM to Noon
036B 37.60 36.53 BASELINE ROAD INTERCHANGE BOULDER SH 7 BOULDER COUNTY EAST WB 9 PM to 8 AM 9 PM to 8 AM 9 PM to 8 AM 9 PM to 9 AM 9 PM to 9 AM 9 PM to 9 AM
036B 37.60 39.20 BASELINE ROAD INTERCHANGE BOULDER FOOTHILLS PARKWAY INTERCHANGE EB 6 PM to 6 AM 6 PM to 6 AM 6 PM to 6 AM 6 PM to 9 AM 6 PM to 9 AM 6 PM to 9 AM
036B 39.20 37.60 FOOTHILLS PARKWAY INTERCHANGE BASELINE ROAD INTERCHANGE BOULDER WB
7 PM to 6 AM
9 AM to Noon
7 PM to 6 AM
9 AM to Noon
7 PM to 6 AM
9 AM to Noon
7 PM to 11 AM 7 PM to 11 AM 7 PM to 11 AM
036B 39.20 48.04 FOOTHILLS PARKWAY INTERCHANGE BROOMFIELD INTERCHANGE EB 8 PM to 6 AM 8 PM to 6 AM 8 PM to 6 AM 8 PM to 7 AM 8 PM to 7 AM 8 PM to 7 AM
036B 48.04 39.20 BROOMFIELD INTERCHANGE FOOTHILLS PARKWAY INTERCHANGE WB 9 PM to 6 AM 9 PM to 6 AM 9 PM to 6 AM 9 PM to 9 AM 9 PM to 9 AM 9 PM to 9 AM
036D 129.57 135.58 ADAMS CR 72 SH 71 LAST CHANCE 630 2 Both Anytime Anytime Anytime Anytime Anytime Anytime
036D 135.58 224.38 SH 71 LAST CHANCE KANSAS STATE LINE 840 3 Both Anytime Anytime Anytime Anytime Anytime Anytime
036E 0.00 0.28 US 36/BASELINE RD BOULDER SH 93 EB Anytime Anytime Anytime Anytime Anytime Anytime
036E 0.28 0.00 SH 93 US 36/BASELINE RD BOULDER WB Anytime Anytime Anytime Anytime Anytime Anytime
036Z 0.00 0.30 BEGIN 1 WAY WB SECTION LYONS END 1 WAY WB SECTION LYONS 7000 2 WB Anytime Anytime Anytime Anytime Anytime Anytime
039A 0.00 1.34 US 6 & SH 52 MORGAN COUNTY MORGAN CR S 3900 2 Both Anytime Anytime Anytime Anytime Anytime Anytime
039A 1.34 7.57 MORGAN CR S SH 7 E & W BEGIN SH 42 1100 2 Both Anytime Anytime Anytime Anytime Anytime Anytime
040F 361.00 363.00 I-70 FRONTAGE ROAD (NEAR I-70 MP 338) I-70 INTERCHANGE (#340) IN AGATE 120 2 Both Anytime Anytime Anytime Anytime Anytime Anytime
040G 381.27 382.18 I-70 FRONTAGE ROAD (I-70 MP 358) US 24 IN LIMON 210 2 Both Anytime Anytime Anytime Anytime Anytime Anytime
040H 385.34 399.09 I-70 INTERCHANGE (#363) IN LIMON RD NE (1ST AVE.) (SHELL STREET) 6300 2 Both Anytime Anytime 7 PM to 7 AM Anytime Anytime 6 PM to 8 AM
040H 399.51 444.89 RD NE AND SW (3RD AVE) (BARRON ST) RD N AND S (CO RD 9) 5900 2 Both Anytime Anytime 7 PM to 7 AM Anytime Anytime 6 PM to 9 AM
040H 446.05 486.87 RD S (ST 3) KANSAS STATE LINE 1900 2 Both Anytime Anytime Anytime Anytime Anytime Anytime
042A 0.00 1.96 SH 7 S BOULDER RD LOUISVILLE 20000 2 Both 9 PM to 5 AM 9 PM to 5 AM 9 PM to 5 AM 9 PM to 10 AM 9 PM to 9 AM 11 PM to 7 AM
042A 1.96 2.62 S BOULDER RD LOUISVILLE W PINE ST LOUISVILLE 18000 2 Both 9 PM to 5 AM 9 PM to 5 AM 9 PM to 5 AM 9 PM to 11 AM 9 PM to 10 AM 10 PM to 8 AM
042A 2.62 4.88 W PINE ST LOUISVILLE US 287 LAFAYETTE 12000 2 Both
9 PM to 5 AM
9 AM to 3 PM
9 PM to 5 AM
9 AM to 11 AM
9 PM to 5 AM 9 PM to 4 PM 9 PM to 4 PM 8 PM to 9 AM
052A 0.00 4.67 SH 119 (DIAGONAL HIGHWAY) US 287 11000 2 Both
9 PM to 5 AM
9 AM to 3 PM
9 PM to 5 AM
9 AM to 2 PM
9 PM to 5 AM Anytime Anytime 8 PM to 8 AM
052A 4.67 11.17 US 287 I-25 DACONO INTERCHANGE 19000 2 Both 9 PM to 5 AM 9 PM to 5 AM 9 PM to 4 AM 7 PM to 9 AM 8 PM to 9 AM 10 PM to 6 AM
052A 11.17 13.83 I-25 DACONO INTERCHANGE GLEN CREIGHTON DR DACONO 19000 2 Both 9 PM to 5 AM 9 PM to 5 AM 10 PM to 5 AM 7 PM to 9 AM 8 PM to 9 AM 11 PM to 6 AM
052A 13.83 18.44 GLEN CREIGHTON DR DACONO WELD CR 23 12000 2 Both
9 PM to 5 AM
9 AM to 3 PM
9 PM to 5 AM
9 AM to 2 PM
9 PM to 5 AM Anytime 6 PM to 3 PM 8 PM to 8 AM
052A 18.44 19.96 WELD CR 23 SH 85 FT LUPTON 11000 2 Both
9 PM to 5 AM
9 AM to 3 PM
9 PM to 5 AM
9 AM to 2 PM
9 PM to 5 AM Anytime Anytime 8 PM to 9 AM
052A 19.96 20.67 SH 85 FT LUPTON HARRISON AVE FORT LUPTON 13000 2 Both
9 PM to 5 AM
9 AM to 3 PM
9 PM to 5 AM
9 AM to 3 PM
9 PM to 5 AM Anytime 6 PM to 9 AM 8 PM to 7 AM
052A 20.67 25.46 HARRISON AVE FORT LUPTON WELD CR 37 13000 2 Both
9 PM to 5 AM
9 AM to 3 PM
9 PM to 5 AM
9 AM to 3 PM
9 PM to 5 AM Anytime 6 PM to 9 AM 8 PM to 7 AM
052A 25.46 29.63 WELD CR 37 BEECH ST HUDSON 8800 2 Both Anytime Anytime 9 PM to 5 AM Anytime Anytime 7 PM to 8 AM
052A 29.63 36.92 BEECH ST HUDSON WELD CR 59 3900 2 Both Anytime Anytime Anytime Anytime Anytime Anytime
052A 36.92 72.58 WELD CR 59 MORGAN CR Q WIGGINS 2100 2 Both Anytime Anytime Anytime Anytime Anytime Anytime
94000 4
36000 6
49000 4
46000 4
57000 4
Page D-6

CDOT Region 4 Appendix D - Fall/Winter Single-Lane Closure Allowed Hours Lane Closure Strategy - 4th Ed.
0.0 - 0.5 mile
Lane Closure
0.5 - 1.0 mile
Lane Closure
> 1.0 mile
Lane Closure
0.0 - 0.5 mile
Lane Closure
0.5 - 1.0 mile
Lane Closure
> 1.0 mile
Lane Closure
Spring/Summer: April – October, Fall/Winter: November – March
# of
Lanes
Dir.
Fall/Winter Weekday Allowed Hours: Fall/Winter Weekend Allowed Hours:
State
Highway
Number
Beginning of
Section MP#
End of
Section
MP #
Beginning of Section - Description End of Section - Description
2018 Volume
(AADT)
052B 86.48 86.98 US 34 FORT MORGAN SH 144 FORT MORGAN 7300 4 Both Anytime Anytime Anytime Anytime Anytime Anytime
052B 86.98 87.16 SH 144 FORT MORGAN FORT MORGAN I-76 INTERCHANGE 13000 4 Both Anytime Anytime Anytime Anytime Anytime Anytime
052B 87.16 87.90 FORT MORGAN I-76 INTERCHANGE MORGAN CR T 5800 2 Both Anytime Anytime 6 PM to 3 PM Anytime Anytime Anytime
052B 87.90 88.47 MORGAN CR T MORGAN CR T.5 4300 4 Both Anytime Anytime Anytime Anytime Anytime Anytime
052B 88.47 91.07 MORGAN CR T.5 MORGAN CR W 2200 2 Both Anytime Anytime Anytime Anytime Anytime Anytime
052B 91.07 111.54 MORGAN CR W SH 14 RAYMER 1200 2 Both Anytime Anytime Anytime Anytime Anytime Anytime
055A 0.00 5.66 SH 138 CROOK BEGIN LOGAN CR 81 1000 2 Both Anytime Anytime Anytime Anytime Anytime Anytime
056B 2.90 4.49 MEADOWLARK DRIVE 2ND ST BERTHOUD 8000 2 Both Anytime 6 PM to 4 PM 7 PM to 6 AM Anytime Anytime 6 PM to 10 AM
056B 4.49 9.53 2ND ST BERTHOUD I-25 BERTHOUD INTERCHANGE 7400 2 Both Anytime Anytime 7 PM to 6 AM Anytime Anytime 6 PM to 10 AM
057A 0.00 0.53 I-70 STRATTON US 24 STRATTON 1400 2 Both Anytime Anytime Anytime Anytime Anytime Anytime
059A 0.00 67.14 KIT CARSON/WASHINGTON COUNTY LINE US 36 NEAR COPE 1200 2 Both Anytime Anytime Anytime Anytime Anytime Anytime
059B 74.47 173.31 US 36 WEST OF JOES SH 138 SEDGEWICK 3000 2 Both Anytime Anytime Anytime Anytime Anytime Anytime
060A 0.00 4.96 US 287 CAMPION LARIMER CR 7 4600 2 Both Anytime Anytime 6 PM to 4 PM Anytime Anytime Anytime
060B 6.00 9.86 I-25 INTERCHANGE JOHNSTOWN MILLIKEN ANGOVE AVE JOHNSTOWN 14000 2 Both
7 PM to 6 AM
8 AM to 3 PM
7 AM to 6 AM
9 AM to 11 AM
9 PM to 5 AM 5 PM to Noon 7 PM to 11 AM 9 PM to 8 AM
060B 9.86 14.70 ANGOVE AVE JOHNSTOWN WELD CR 48 11000 2 Both 6 PM to 4 PM
7 PM to 6 AM
8 AM to 3 PM
9 PM to 5 AM Anytime Anytime 8 PM to 9 AM
060B 14.70 20.20 WELD CR 48 US 85 S/O GILCREST 7000 2 Both Anytime Anytime
7 PM to 6 AM
9 AM to Noon
Anytime Anytime 6 PM to 11 AM
061A 0.00 40.99 US 34 OTIS US 6 STERLING 3000 2 Both Anytime Anytime Anytime Anytime Anytime Anytime
063A 0.00 56.41 US 36 ANTON US 6 ATWOOD 1900 2 Both Anytime Anytime Anytime Anytime Anytime Anytime
066B 28.69 30.00 US 36 LYONS MP 30 11000 4 Both Anytime Anytime Anytime Anytime Anytime Anytime
066B 30.00 34.84 MP 30 JOTIPA DR LONGMONT 12000 2 Both
9 PM to 5 AM
9 AM to 1 PM
9 PM to 5 AM 9 PM to 5 AM Anytime 5 PM to Noon 7 PM to 8 AM
066B 34.84 35.08 JOTIPA DR LONGMONT HOVER ST LONGMONT 15000 3 Both
9 PM to 5 AM
9 AM to 4 PM
9 PM to 5 AM
9 AM to 4 PM
9 PM to 5 AM
9 AM to 4 PM
Anytime Anytime Anytime
066B 35.08 36.51 HOVER ST LONGMONT HILLCREST ST / PRATT ST LONGMONT 29000 2 Both 9 PM to 5 AM 9 PM to 5 AM 11 PM to 5 AM 8 PM to 8 AM 8 PM to 8 AM 11 PM to 7 AM
066B 36.51 36.83 HILLCREST ST / PRATT ST LONGMONT ERFERT ST LONGMONT EB
9 PM to 5 AM
9 AM to 4 PM
9 PM to 5 AM
9 AM to 4 PM
9 PM to 5 AM
9 AM to 4 PM
Anytime Anytime Anytime
066B 36.83 36.51 ERFERT ST LONGMONT HILLCREST ST / PRATT ST LONGMONT WB
9 PM to 5 AM
9 AM to 4 PM
9 PM to 5 AM
9 AM to 4 PM
9 PM to 5 AM
9 AM to 4 PM
Anytime Anytime Anytime
066B 36.83 37.66 ERFERT ST LONGMONT N 115TH ST LONGMONT 19000 2 Both 9 PM to 5 AM 9 PM to 5 AM 10 PM to 5 AM 6 PM to 10 AM 7 PM to 9 AM 9 PM to 7 AM
066B 37.66 37.95 N 115TH ST LONGMONT PACE ST LONGMONT 19000 3 Both
9 PM to 5 AM
9 AM to 4 PM
9 PM to 5 AM
9 AM to 4 PM
9 PM to 5 AM
9 AM to 4 PM
Anytime Anytime Anytime
066B 37.95 38.92 PACE ST LONGMONT BOULDER WELD COUNTY LINE ROAD 21000 2 Both 9 PM to 5 AM 9 PM to 5 AM 10 PM to 5 AM 7 PM to 9 AM 7 PM to 9 AM 10 PM to 7 AM
066B 38.92 42.74 BOULDER WELD COUNTY LINE ROAD I-25 LONGMONT INTERCHANGE 20000 2 Both 9 PM to 5 AM 9 PM to 5 AM 10 PM to 5 AM 7 PM to 9 AM 7 PM to 9 AM 10 PM to 7 AM
066B 42.74 44.92 I-25 LONGMONT INTERCHANGE WELD CR 13 17000 2 Both 9 PM to 5 AM 9 PM to 5 AM 9 PM to 5 AM 6 PM to 10 AM 7 PM to 9 AM 9 PM to 7 AM
066B 44.92 51.39 WELD CR 13 US 85 PLATTEVILLE 11000 2 Both
9 PM to 5 AM
9 AM to 4 PM
9 PM to 5 AM
9 AM to 3 PM
9 PM to 5 AM Anytime 5 PM to Noon 7 PM to 8 AM
070A 332.02 340.40 STRASBURG LINCOLN / JOHN BOUNDARY EB Anytime Anytime Anytime Anytime Anytime Anytime
070A 340.40 332.00 LINCOLN / JOHN BOUNDARY STRASBURG WB Anytime Anytime Anytime Anytime Anytime Anytime
12000 4
23000 4
Page D-7

CDOT Region 4 Appendix D - Fall/Winter Single-Lane Closure Allowed Hours Lane Closure Strategy - 4th Ed.
0.0 - 0.5 mile
Lane Closure
0.5 - 1.0 mile
Lane Closure
> 1.0 mile
Lane Closure
0.0 - 0.5 mile
Lane Closure
0.5 - 1.0 mile
Lane Closure
> 1.0 mile
Lane Closure
Spring/Summer: April – October, Fall/Winter: November – March
# of
Lanes
Dir.
Fall/Winter Weekday Allowed Hours: Fall/Winter Weekend Allowed Hours:
State
Highway
Number
Beginning of
Section MP#
End of
Section
MP #
Beginning of Section - Description End of Section - Description
2018 Volume
(AADT)
070A 340.40 361.70 LINCOLN / JOHN BOUNDARY LIMON EB Anytime Anytime Anytime Anytime Anytime Anytime
070A 361.70 340.40 LIMON LINCOLN / JOHN BOUNDARY WB Anytime Anytime Anytime Anytime Anytime Anytime
070A 361.70 405.07 LIMON SH 59 / SEIBERT EB Anytime Anytime Anytime Anytime Anytime Anytime
070A 405.07 361.70 SH 59 / SEIBERT LIMON WB Anytime Anytime Anytime Anytime Anytime Anytime
070A 405.07 449.59 SH 59 / SEIBERT KANSAS STATE LINE EB Anytime Anytime Anytime Anytime Anytime Anytime
070A 449.59 405.07 KANSAS STATE LINE SH 59 / SEIBERT WB Anytime Anytime Anytime Anytime Anytime Anytime
070O 0.00 0.35 US 40 AGATE I-70 AGATE 250 2 Both Anytime Anytime Anytime Anytime Anytime Anytime
070P 0.00 0.53 I-70 VONA US 24 VONA 200 2 Both Anytime Anytime Anytime Anytime Anytime Anytime
070Q 0.14 0.38 US 24 BURLINGTON I-70 BURLINGTON 1900 2 Both Anytime Anytime Anytime Anytime Anytime Anytime
071C 48.65 101.06 CROWLEY / LINCOLN COUNTY LINE SH 24 IN LIMON 2800 2 Both Anytime Anytime Anytime Anytime Anytime Anytime
071D 102.00 138.01 US 24 (3RD ST) IN LIMON US 36 IN LAST CHANCE 2100 2 Both Anytime Anytime Anytime Anytime Anytime Anytime
071D 138.01 174.36 US 36 IN LAST CHANCE US 34 BRUSH 2700 2 Both Anytime Anytime Anytime Anytime Anytime Anytime
071E 175.49 176.46 US 34 BRUSH I-76 BRUSH INTERCHANGE 5700 4 Both Anytime Anytime Anytime Anytime Anytime Anytime
071E 176.46 201.64 I-76 BRUSH INTERCHANGE SH 14 WELD COUNTY 1700 2 Both Anytime Anytime Anytime Anytime Anytime Anytime
071F 205.53 232.82 SH 14 WELD COUNTY NEBRASKA STATE LINE 1100 2 Both Anytime Anytime Anytime Anytime Anytime Anytime
072B 32.33 32.86 SH 119 NEDERLAND FOREST RD NEDERLAND 4700 2 Both Anytime Anytime Anytime Anytime Anytime Anytime
072B 32.86 54.00 FOREST RD NEDERLAND SH 7 RAYMOND 2400 2 Both Anytime Anytime Anytime Anytime Anytime Anytime
076A 25.15 89.66 LOCHBUIE INTERCHANGE SH 71 / BRUSH 25000 4 Both Anytime Anytime Anytime Anytime Anytime Anytime
076A 89.66 184.14 SH 71 / BRUSH NEBRASKA STATE LINE 15000 4 Both Anytime Anytime Anytime Anytime Anytime Anytime
076B 0.00 0.31 SH 76 INTERCHANGE KEENSBURG ELM ST KEENESBURG 4300 2 Both Anytime Anytime Anytime Anytime Anytime Anytime
079B 18.93 23.89 168TH AVENUE PROSPECT VALLEY, SH 52 1500 2 Both Anytime Anytime Anytime Anytime Anytime Anytime
085C 236.03 241.59 ADAMS / WELD COUNTY LINE SH 52 FT LUPTON NB
9 PM to 5 AM
9 AM to 2 PM
9 PM to 5 AM
9 AM to 2 PM
9 PM to 5 AM
9 AM to 2 PM
5 PM to 3 PM 5 PM to 3 PM 5 PM to 3 PM
085C 241.59 236.03 SH 52 FT LUPTON ADAMS / WELD COUNTY LINE SB
9 PM to 5 AM
9 AM to 4 PM
9 PM to 5 AM
9 AM to 4 PM
9 PM to 5 AM
9 AM to 4 PM
5 PM to 3 PM 5 PM to 3 PM 5 PM to 3 PM
085C 241.59 265.85 SH 52 FT LUPTON US 34 NB
9 PM to 5 AM
9 AM to 3 PM
9 PM to 5 AM
9 AM to 3 PM
9 PM to 5 AM
9 AM to 3 PM
Anytime Anytime Anytime
085C 265.85 241.59 US 34 SH 52 FT LUPTON SB
9 PM to 5 AM
9 AM to 4 PM
9 PM to 5 AM
9 AM to 4 PM
9 PM to 5 AM
9 AM to 4 PM
Anytime Anytime Anytime
085E 0.00 1.28 SH 52 FORT LUPTON BUSINESS LOOP US 85 4700 2 Both Anytime Anytime 6 PM to 4 PM Anytime Anytime Anytime
085F 0.00 1.38 SH 66 PLATEVILLE END US 85 PLATEVILLE BUS LOOP 1400 2 Both Anytime Anytime Anytime Anytime Anytime Anytime
085G 0.00 1.63 SH 85 BUSINESS LOOP GREELEY US 34 BUSINESS LOOP GREELEY 18000 4 Both Anytime Anytime Anytime Anytime Anytime Anytime
085H 0.00 2.24 US 34 BUSINESS LOOP GREELEY END US 85 GREELEY BUS LOOP 14000 4 Both Anytime Anytime Anytime Anytime Anytime Anytime
085L 265.85 266.65 US 34 22ND ST GREELEY NB
9 PM to 5 AM
9 AM to 4 PM
9 PM to 5 AM
9 AM to 4 PM
9 PM to 5 AM
9 AM to 4 PM
Anytime Anytime Anytime
085L 266.65 265.85 22ND ST GREELEY US 34 SB
9 PM to 5 AM
9 AM to 11 AM
9 PM to 5 AM
9 AM to 11 AM
9 PM to 5 AM
9 AM to 11 AM
Anytime Anytime Anytime
085L 266.65 268.23 22ND ST GREELEY 8TH STREET NB
9 PM to 5 AM
9 AM to 2 PM
9 PM to 5 AM
9 AM to 2 PM
9 PM to 5 AM
9 AM to 2 PM
Anytime Anytime Anytime
085L 268.23 266.65 8TH STREET 22ND ST GREELEY SB
9 PM to 5 AM
9 AM to Noon
9 PM to 5 AM
9 AM to Noon
9 PM to 5 AM
9 AM to Noon
Anytime Anytime Anytime
30000 5
30000 4
10000 4
33000 4
30000 4
15000 4
15000 4
Page D-8

CDOT Region 4 Appendix D - Fall/Winter Single-Lane Closure Allowed Hours Lane Closure Strategy - 4th Ed.
0.0 - 0.5 mile
Lane Closure
0.5 - 1.0 mile
Lane Closure
> 1.0 mile
Lane Closure
0.0 - 0.5 mile
Lane Closure
0.5 - 1.0 mile
Lane Closure
> 1.0 mile
Lane Closure
Spring/Summer: April – October, Fall/Winter: November – March
# of
Lanes
Dir.
Fall/Winter Weekday Allowed Hours: Fall/Winter Weekend Allowed Hours:
State
Highway
Number
Beginning of
Section MP#
End of
Section
MP #
Beginning of Section - Description End of Section - Description
2018 Volume
(AADT)
085L 268.23 270.25 8TH ST GREELEY GREELEY BUS RTE OVERPASS NB Anytime Anytime Anytime Anytime Anytime Anytime
085L 270.25 268.23 GREELEY BUS RTE OVERPASS 8TH ST GREELEY SB Anytime Anytime Anytime Anytime Anytime Anytime
085L 270.25 272.48 GREELEY BUS RTE OVERPASS SH 392 LUCERNE NB Anytime Anytime Anytime Anytime Anytime Anytime
085L 272.48 270.25 SH 392 LUCERNE GREELEY BUS RTE OVERPASS SB Anytime Anytime Anytime Anytime Anytime Anytime
085L 272.48 280.28 SH 392 LUCERNE 1ST AVE AULT NB Anytime Anytime Anytime Anytime Anytime Anytime
085L 280.28 272.48 1ST AVE AULT SH 392 LUCERNE SB Anytime Anytime Anytime Anytime Anytime Anytime
085L 280.28 283.40 1ST AVE AULT S/O MAIN AVE PIERCE 4800 2 Both Anytime Anytime
6 PM to 6 AM
9 AM to 3 PM
Anytime Anytime Anytime
085L 283.40 284.10 S/O MAIN AVE PIERCE N/O WELD CR 90 PIERCE NB Anytime Anytime Anytime Anytime Anytime Anytime
085L 284.10 283.40 N/O WELD CR 90 PIERCE S/O MAIN AVE PIERCE SB Anytime Anytime Anytime Anytime Anytime Anytime
085L 284.10 288.53 N/O WELD CR 90 PIERCE 4TH ST NUNN 4500 2 Both Anytime Anytime 6 PM to 4 PM Anytime Anytime Anytime
085L 288.53 309.54 4TH ST NUNN WYOMING STATE LINE 4100 2 Both Anytime Anytime 6 PM to 4 PM Anytime Anytime Anytime
086A 12.26 23.13 CREST OF 3.9% GRADE UTE AVE IN KIOWA 13000 2 Both Anytime
6 PM to 6 AM
9 AM to 3 PM
9 PM to 5 AM 3 PM to 10 AM 5 PM to 9 AM 8 PM to 7 AM
086A 23.13 27.72 UTE AVE IN KIOWA ELBERT CR 61.6 EB Anytime Anytime Anytime Anytime Anytime Anytime
086A 27.72 23.13 ELBERT CR 61.6 UTE AVE IN KIOWA WB Anytime Anytime Anytime Anytime Anytime Anytime
086A 27.72 59.00 ELBERT CR 61.6 I-70 INTERCHANGE (#352) 1800 2 Both Anytime Anytime Anytime Anytime Anytime Anytime
093A 11.78 12.00 SH 128 E BOULDER COUNTY END SB PASSING LANE 19000 2 Both 9 PM to 5 AM 9 PM to 5 AM 10 PM to 5 AM 7 PM to 10 AM 7 PM to 9 AM 11 PM to 7 AM
093A 12.00 13.62 END SB PASSING LANE SH 170 MARSHALL 19000 3 Both
9 PM to 5 AM
9 AM to 4 PM
9 PM to 5 AM
9 AM to 4 PM
9 PM to 5 AM
9 AM to 4 PM
Anytime Anytime Anytime
093A 13.62 15.32 SH 170 MARSHALL GREENBRIER BLVD BOULDER NB
9 PM to 5 AM
9 AM to 4 PM
9 PM to 5 AM
9 AM to 4 PM
9 PM to 5 AM
9 AM to 4 PM
Anytime Anytime Anytime
093A 15.32 13.62 GREENBRIER BLVD BOULDER SH 170 MARSHALL SB
9 PM to 5 AM
9 AM to 4 PM
9 PM to 5 AM
9 AM to 4 PM
9 PM to 5 AM
9 AM to 4 PM
Anytime Anytime Anytime
093A 15.32 16.33 GREENBRIER BLVD BOULDER TABLE MESA DR BOULDER NB
9 PM to 5 AM
10 AM to 4 PM
9 PM to 5 AM
10 AM to 4 PM
9 PM to 5 AM
10 AM to 4 PM
6 PM to 4 PM 6 PM to 4 PM 6 PM to 4 PM
093A 16.33 15.32 TABLE MESA DR BOULDER GREENBRIER BLVD BOULDER SB
9 PM to 5 AM
9 AM to 3 PM
9 PM to 5 AM
9 AM to 3 PM
9 PM to 5 AM
9 AM to 3 PM
Anytime Anytime Anytime
093A 16.33 17.42 TABLE MESA DR BOULDER US 36E / BASELINE RD BOULDER NB
9 PM to 5 AM
9 AM to 4 PM
9 PM to 5 AM
9 AM to 4 PM
9 PM to 5 AM
9 AM to 4 PM
Anytime Anytime Anytime
093A 17.42 16.33 US 36E / BASELINE RD BOULDER TABLE MESA DR BOULDER SB
9 PM to 5 AM
9 AM to 4 PM
9 PM to 5 AM
9 AM to 4 PM
9 PM to 5 AM
9 AM to 4 PM
Anytime Anytime Anytime
093A 17.42 17.78 US 36E / BASELINE RD BOULDER 20TH ST BOULDER NB
9 PM to 5 AM
9 AM to 4 PM
9 PM to 5 AM
9 AM to 4 PM
9 PM to 5 AM
9 AM to 4 PM
Anytime Anytime Anytime
093A 17.78 17.42 20TH ST BOULDER US 36E / BASELINE RD BOULDER SB
9 PM to 5 AM
9 AM to 4 PM
9 PM to 5 AM
9 AM to 4 PM
9 PM to 5 AM
9 AM to 4 PM
5 PM to Noon 5 PM to Noon 5 PM to Noon
093A 17.78 18.72 20TH ST BOULDER ARAPAHOE AVE BOULDER NB
9 PM to 5 AM
9 AM to 3 PM
9 PM to 5 AM
9 AM to 3 PM
9 PM to 5 AM
9 AM to 3 PM
5 PM to 3 PM 5 PM to 3 PM 5 PM to 3 PM
093A 18.72 17.78 ARAPAHOE AVE BOULDER 20TH ST BOULDER SB
9 PM to 5 AM
1 PM to 4 PM
9 PM to 5 AM
1 PM to 4 PM
9 PM to 5 AM
1 PM to 4 PM
Anytime Anytime Anytime
093A 18.72 18.85 ARAPAHOE AVE BOULDER SH 119 / SH 7 BOULDER NB
9 PM to 5 AM
9 AM to 3 PM
9 PM to 5 AM
9 AM to 3 PM
9 PM to 5 AM
9 AM to 3 PM
Anytime Anytime Anytime
093A 18.85 18.72 SH 119 / SH 7 BOULDER ARAPAHOE AVE BOULDER SB
9 PM to 5 AM
9 AM to 4 PM
9 PM to 5 AM
9 AM to 4 PM
9 PM to 5 AM
9 AM to 4 PM
Anytime Anytime Anytime
094A 35.01 86.00 EL PASO / LINCOLN COUNTY LINE US 40 AT AROYA 530 2 Both Anytime Anytime Anytime Anytime Anytime Anytime
113A 0.00 18.83 SH 138 ILIFF NEBRASKA STATE LINE 1600 2 Both Anytime Anytime Anytime Anytime Anytime Anytime
119A 22.10 36.47 GILPIN BOULDER COUNTY LINE BOULDER CR 122 7000 2 Both Anytime Anytime 6 PM to 1 PM Anytime Anytime 5 PM to 10 AM
119A 36.47 38.98 BOULDER CR 122 BOULDER CR 118 5900 2 Both Anytime Anytime 6 PM to 5 PM Anytime Anytime 5 PM to 10 AM
27000 4
34000 6
36000 5
30000 4
3000 4
17000 4
29000 4
17000 4
12000 4
4600 4
17000 4
Page D-9

CDOT Region 4 Appendix D - Fall/Winter Single-Lane Closure Allowed Hours Lane Closure Strategy - 4th Ed.
0.0 - 0.5 mile
Lane Closure
0.5 - 1.0 mile
Lane Closure
> 1.0 mile
Lane Closure
0.0 - 0.5 mile
Lane Closure
0.5 - 1.0 mile
Lane Closure
> 1.0 mile
Lane Closure
Spring/Summer: April – October, Fall/Winter: November – March
# of
Lanes
Dir.
Fall/Winter Weekday Allowed Hours: Fall/Winter Weekend Allowed Hours:
State
Highway
Number
Beginning of
Section MP#
End of
Section
MP #
Beginning of Section - Description End of Section - Description
2018 Volume
(AADT)
119A 38.98 40.93 BOULDER CR 118 PEARL ST BOULDER 8100 2 Both Anytime Anytime 7 PM to 8 AM Anytime Anytime 6 PM to 9 AM
119A 40.93 41.89 PEARL ST BOULDER BROADWAY BOULDER 19000 4 Both 9 PM to 5 AM 9 PM to 5 AM 9 PM to 5 AM Anytime Anytime Anytime
119B 44.24 44.98 US 36 BOULDER FOOTHILLS PARKWAY INTERCHANGE EB 9 PM to 5 AM 9 PM to 5 AM 9 PM to 5 AM 5 PM to 2 PM 5 PM to 2 PM 5 PM to 2 PM
119B 44.98 44.24 FOOTHILLS PARKWAY INTERCHANGE US 36 BOULDER WB 9 PM to 5 AM 9 PM to 5 AM 9 PM to 5 AM Anytime Anytime Anytime
119B 44.98 46.18 FOOTHILLS PARKWAY INTERCHANGE JAY ROAD BOULDER EB 9 PM to 5 AM 9 PM to 5 AM 9 PM to 5 AM Anytime Anytime Anytime
119B 46.18 44.98 JAY ROAD BOULDER FOOTHILLS PARKWAY INTERCHANGE WB 9 PM to 5 AM 9 PM to 5 AM 9 PM to 5 AM 5 PM to Noon 5 PM to Noon 5 PM to Noon
119B 46.18 56.25 JAY ROAD BOULDER US 287 LONGMONT EB
9 PM to 5 AM
9 AM to 2 PM
9 PM to 5 AM
9 AM to 2 PM
9 PM to 5 AM
9 AM to 2 PM
6 PM to 9 AM 6 PM to 9 AM 6 PM to 9 AM
119B 56.25 46.18 US 287 LONGMONT JAY ROAD BOULDER WB
9 PM to 5 AM
Noon to 2 PM
9 PM to 5 AM
Noon to 2 PM
9 PM to 5 AM
Noon to 2 PM
7 PM to 9 AM 7 PM to 9 AM 7 PM to 9 AM
119B 56.25 57.32 US 287 LONGMONT S MARTIN ST LONGMONT EB
9 PM to 5 AM
9 AM to 4 PM
9 PM to 5 AM
9 AM to 4 PM
9 PM to 5 AM
9 AM to 4 PM
Anytime Anytime Anytime
119B 57.32 56.25 S MARTIN ST LONGMONT US 287 LONGMONT WB
9 PM to 5 AM
9 AM to 4 PM
9 PM to 5 AM
9 AM to 4 PM
9 PM to 5 AM
9 AM to 4 PM
Anytime Anytime Anytime
119B 57.32 59.09 S MARTIN ST LONGMONT 3RD AVE LONGMONT EB
9 PM to 5 AM
9 AM to 1 PM
9 PM to 5 AM
9 AM to 1 PM
9 PM to 5 AM
9 AM to 1 PM
5 PM to 3 PM 5 PM to 3 PM 5 PM to 3 PM
119B 59.09 57.32 3RD AVE LONGMONT S MARTIN ST LONGMONT WB
9 PM to 5 AM
10 AM to 1 PM
9 PM to 5 AM
10 AM to 1 PM
9 PM to 5 AM
10 AM to 1 PM
5 PM to Noon 5 PM to Noon 5 PM to Noon
119C 59.09 63.64 3RD AVE LONGMONT I-25 LONGMONT INTERCHANGE EB
9 PM to 5 AM
9 AM to Noon
9 PM to 5 AM
9 AM to Noon
9 PM to 5 AM
9 AM to Noon
6 PM to 11 AM 6 PM to 11 AM 6 PM to 11 AM
119C 63.64 59.09 I-25 LONGMONT INTERCHANGE 3RD AVE LONGMONT WB 9 PM to 5 AM 9 PM to 5 AM 9 PM to 5 AM 5 PM to 10 AM 5 PM to 10 AM 5 PM to 10 AM
138A 0.00 0.55 US 6 STERLING (BEGIN NB 1-WAY) BROADWAY ST STERLING (END NB 1-WAY) 4400 3 NB Anytime Anytime Anytime Anytime Anytime Anytime
138A 0.55 3.33 SERVICE RD & 2ND ST STERLING LOGAN CR 43.5 4600 4 Both Anytime Anytime Anytime Anytime Anytime Anytime
138A 3.33 57.76 LOGAN CR 43.5 PLUM ST JULESBURG 2600 2 Both Anytime Anytime Anytime Anytime Anytime Anytime
138A 57.76 58.26 PLUM ST JULESBURG ASH ST JULESBURG 2200 4 Both Anytime Anytime Anytime Anytime Anytime Anytime
138A 58.26 59.82 ASH ST JULESBURG NEBRASKA STATE LINE 1900 2 Both Anytime Anytime Anytime Anytime Anytime Anytime
138Z 0.00 0.61 BROADWAY STREET STERLING (BEGIN SB 1-WAY) US HIGHWAY 6 (END SB 1-WAY) 4600 3 SB Anytime Anytime Anytime Anytime Anytime Anytime
144A 0.00 26.89 I-76 W/O WIGGINS MORGAN CR 16.8 2400 2 Both Anytime Anytime Anytime Anytime Anytime Anytime
144A 26.89 28.80 MORGAN CR 16.8 SH 52 5000 2 Both Anytime Anytime Anytime Anytime Anytime Anytime
157A 0.00 4.53 US 36 BOULDER SH 119 BOULDER NB
9 PM to 5 AM
10 AM to 3 PM
9 PM to 5 AM
10 AM to 3 PM
9 PM to 5 AM
10 AM to 3 PM
9 PM to 9 AM 9 PM to 9 AM 9 PM to 9 AM
157A 4.53 0.00 SH 119 BOULDER US 36 BOULDER SB
9 PM to 5 AM
Noon to 4 PM
9 PM to 5 AM
Noon to 4 PM
9 PM to 5 AM
Noon to 4 PM
9 PM to 9 AM 9 PM to 9 AM 9 PM to 9 AM
170A 0.00 2.16 BOULDER CR ES2 SENDA ROSCOSA ST ELDORADO SPRINGS 1300 2 Both Anytime Anytime Anytime Anytime Anytime Anytime
170A 2.16 3.06 SENDA ROSCOSA ST ELDORADO SPRINGS S CHERRYVALE RD BOULDER 6100 2 Both Anytime Anytime
7 PM to 7 AM
9 AM to 2 PM
Anytime Anytime Anytime
170A 3.06 5.99 S CHERRYVALE RD BOULDER 76TH AVENUE 21000 2 Both 8 PM to 7 AM 8 PM to 7 AM 9 PM to 6 AM 7 PM to 10 AM 7 PM to 9 AM 11 PM to 7 AM
170A 5.99 6.68 76TH AVENUE BEGIN 4-LANE HWY 21000 2 Both 8 PM to 7 AM 8 PM to 7 AM 9 PM to 6 AM 7 PM to 10 AM 7 PM to 9 AM 11 PM to 7 AM
170A 6.68 6.91 BEGIN 4-LANE HWY US 36 SUPERIOR EB 6 PM to 1 PM 6 PM to 1 PM 6 PM to 1 PM Anytime Anytime Anytime
170A 6.91 6.68 US 36 SUPERIOR BEGIN 4-LANE HWY WB 5 PM to 1 PM 5 PM to 1 PM 5 PM to 1 PM Anytime Anytime Anytime
257A 0.00 5.15 US 60 MILLIKEN US 34 WELD COUNTY 8600 2 Both
6 PM to 7 AM
8 AM to 4 PM
6 PM to 6 AM
8 AM to 3 PM
7 PM to 6 AM Anytime Anytime 6 PM to 11 AM
257A 5.15 10.60 US 34 WELD COUNTY SH 392B / HOLLISTER LAKE RD WINDSOR 13000 2 Both
6 PM to 6 AM
9 AM to 2 PM
7 PM to 6 AM
9 AM to 11 AM
8 PM to 5 AM Anytime Anytime 7 PM to 8 AM
39000 4
53000 4
25000 4
51000 4
38000 6
30000 4
30000 4
58000 6
Page D-10

CDOT Region 4 Appendix D - Fall/Winter Single-Lane Closure Allowed Hours Lane Closure Strategy - 4th Ed.
0.0 - 0.5 mile
Lane Closure
0.5 - 1.0 mile
Lane Closure
> 1.0 mile
Lane Closure
0.0 - 0.5 mile
Lane Closure
0.5 - 1.0 mile
Lane Closure
> 1.0 mile
Lane Closure
Spring/Summer: April – October, Fall/Winter: November – March
# of
Lanes
Dir.
Fall/Winter Weekday Allowed Hours: Fall/Winter Weekend Allowed Hours:
State
Highway
Number
Beginning of
Section MP#
End of
Section
MP #
Beginning of Section - Description End of Section - Description
2018 Volume
(AADT)
257A 10.60 11.14 SH 392B / HOLLISTER LAKE RD WINDSOR 2ND STREET WINDSOR NB Anytime Anytime Anytime Anytime Anytime Anytime
257A 11.14 10.60 2ND STREET WINDSOR SH 392B / HOLLISTER LAKE RD WINDSOR SB Anytime Anytime Anytime Anytime Anytime Anytime
257A 11.14 11.62 2ND STREET WINDSOR SH 392A / MAIN ST / 7TH ST WINDSOR 16000 2 Both Anytime 7 PM to 6 AM 8 PM to 5 AM Anytime 5 PM to Noon 7 PM to 8 AM
257A 11.62 14.53 SH 392A / MAIN ST / 7TH ST WINDSOR WELD CR 74 6900 2 Both Anytime
6 PM to 7 AM
8 AM to 4 PM
7 PM to 6 AM
9 AM to 11 AM
Anytime Anytime Anytime
257A 14.53 18.49 WELD CR 74 SH 14 5100 2 Both Anytime Anytime
6 PM to 6 AM
8 AM to 2 PM
Anytime Anytime Anytime
257B 0.04 1.15 SH 257A / WELD CR 19 US 34D / 10TH ST 170 2 Both Anytime Anytime Anytime Anytime Anytime Anytime
287B 122.78 133.24 KIOWA / CHEYENNE COUNTY LINE SH 40 4200 2 Both Anytime Anytime
6 PM to 10 AM
4 PM to 5 PM
Anytime Anytime 4 PM to Noon
287C 304.32 305.36 SH 7/W BASELINE RD BOULDER SH 7/ARAPAHOE RD BOULDER NB
7 PM to 8 AM
10 AM to 1 PM
7 PM to 8 AM
10 AM to 1 PM
7 PM to 8 AM
10 AM to 1 PM
6 PM to Noon 6 PM to Noon 6 PM to Noon
287C 305.36 304.32 SH 7/ARAPAHOE RD BOULDER SH 7/W BASELINE RD BOULDER SB
6 PM to 6 AM
10 AM to 1 PM
6 PM to 6 AM
10 AM to 1 PM
6 PM to 6 AM
10 AM to 1 PM
5 PM to 9 AM 5 PM to 9 AM 5 PM to 9 AM
287C 305.36 309.39 SH 7/ARAPAHOE RD BOULDER BOULDER CR 38 BOULDER COUNTY NB
6 PM to 8 AM
9 AM to 4 PM
6 PM to 8 AM
9 AM to 4 PM
6 PM to 8 AM
9 AM to 4 PM
5 PM to 1 PM 5 PM to 1 PM 5 PM to 1 PM
287C 309.39 305.36 BOULDER CR 38 BOULDER COUNTY SH 7/ARAPAHOE RD BOULDER SB
6 PM to 7 AM
9 AM to 5 PM
6 PM to 7 AM
9 AM to 5 PM
6 PM to 7 AM
9 AM to 5 PM
5 PM to 11 AM 5 PM to 11 AM 5 PM to 11 AM
287C 309.39 310.39 BOULDER CR 38 BOULDER COUNTY SH 52 LONGMONT NB
9 PM to 5 AM
9 AM to 4 PM
9 PM to 5 AM
9 AM to 4 PM
9 PM to 5 AM
9 AM to 4 PM
Anytime Anytime Anytime
287C 310.39 309.39 SH 52 LONGMONT BOULDER CR 38 BOULDER COUNTY SB
9 PM to 5 AM
9 AM to 4 PM
9 PM to 5 AM
9 AM to 4 PM
9 PM to 5 AM
9 AM to 4 PM
Anytime Anytime Anytime
287C 310.39 311.42 SH 52 LONGMONT NIWOT RD LONGMONT NB
9 PM to 5 AM
9 AM to 3 PM
9 PM to 5 AM
9 AM to 3 PM
9 PM to 5 AM
9 AM to 3 PM
Anytime Anytime Anytime
287C 311.42 310.39 NIWOT RD LONGMONT SH 52 LONGMONT SB
9 PM to 5 AM
9 AM to 4 PM
9 PM to 5 AM
9 AM to 4 PM
9 PM to 5 AM
9 AM to 4 PM
Anytime Anytime Anytime
287C 311.42 314.56 NIWOT RD LONGMONT JERSEY AVE LONGMONT NB
9 PM to 5 AM
9 AM to 2 PM
9 PM to 5 AM
9 AM to 2 PM
9 PM to 5 AM
9 AM to 2 PM
Anytime Anytime Anytime
287C 314.56 311.42 JERSEY AVE LONGMONT NIWOT RD LONGMONT SB
9 PM to 5 AM
9 AM to 4 PM
9 PM to 5 AM
9 AM to 4 PM
9 PM to 5 AM
9 AM to 4 PM
Anytime Anytime Anytime
287C 314.56 315.23 JERSEY AVE LONGMONT BOSTON AVE LONGMONT NB
9 PM to 5 AM
9 AM to 2 PM
9 PM to 5 AM
9 AM to 2 PM
9 PM to 5 AM
9 AM to 2 PM
Anytime Anytime Anytime
287C 315.23 314.56 BOSTON AVE LONGMONT JERSEY AVE LONGMONT SB
9 PM to 5 AM
9 AM to 3 PM
9 PM to 5 AM
9 AM to 3 PM
9 PM to 5 AM
9 AM to 3 PM
Anytime Anytime Anytime
287C 315.23 315.66 BOSTON AVE LONGMONT 3RD AVE LONGMONT NB
9 PM to 5 AM
9 AM to 4 PM
9 PM to 5 AM
9 AM to 4 PM
9 PM to 5 AM
9 AM to 4 PM
Anytime Anytime Anytime
287C 315.66 315.23 3RD AVE LONGMONT BOSTON AVE LONGMONT SB
9 PM to 5 AM
9 AM to 4 PM
9 PM to 5 AM
9 AM to 4 PM
9 PM to 5 AM
9 AM to 4 PM
Anytime Anytime Anytime
287C 315.66 316.33 3RD AVE LONGMONT 9TH AVE LONGMONT NB
9 PM to 5 AM
9 AM to 4 PM
9 PM to 5 AM
9 AM to 4 PM
9 PM to 5 AM
9 AM to 4 PM
Anytime Anytime Anytime
287C 316.33 315.66 9TH AVE LONGMONT 3RD AVE LONGMONT SB
9 PM to 5 AM
9 AM to 4 PM
9 PM to 5 AM
9 AM to 4 PM
9 PM to 5 AM
9 AM to 4 PM
Anytime Anytime Anytime
287C 316.33 316.85 9TH AVE LONGMONT MOUNTAIN VIEW AVE LONGMONT NB
9 PM to 5 AM
9 AM to Noon
9 PM to 5 AM
9 AM to Noon
9 PM to 5 AM
9 AM to Noon
5 PM to 3 PM 5 PM to 3 PM 5 PM to 3 PM
287C 316.85 316.33 MOUNTAIN VIEW AVE LONGMONT 9TH AVE LONGMONT SB
9 PM to 5 AM
9 AM to Noon
9 PM to 5 AM
9 AM to Noon
9 PM to 5 AM
9 AM to Noon
5 PM to Noon 5 PM to Noon 5 PM to Noon
287C 316.85 317.87 MOUNTAIN VIEW AVE LONGMONT 21ST AVE LONGMONT NB
9 PM to 5 AM
9 AM to Noon
9 PM to 5 AM
9 AM to Noon
9 PM to 5 AM
9 AM to Noon
5 PM to 1 PM 5 PM to 1 PM 5 PM to 1 PM
287C 317.87 316.85 21ST AVE LONGMONT MOUNTAIN VIEW AVE LONGMONT SB
9 PM to 5 AM
9 AM to 11 AM
9 PM to 5 AM
9 AM to 11 AM
9 PM to 5 AM
9 AM to 11 AM
5 PM to Noon 5 PM to Noon 5 PM to Noon
287C 317.87 318.33 21ST AVE LONGMONT SH 66 LONGMONT NB
9 PM to 5 AM
9 AM to 4 PM
9 PM to 5 AM
9 AM to 4 PM
9 PM to 5 AM
9 AM to 4 PM
Anytime Anytime Anytime
287C 318.33 317.87 SH 66 LONGMONT 21ST AVE LONGMONT SB
9 PM to 5 AM
9 AM to 4 PM
9 PM to 5 AM
9 AM to 4 PM
9 PM to 5 AM
9 AM to 4 PM
Anytime Anytime Anytime
287C 318.33 331.65 SH 66 LONGMONT 19TH ST SOUTHEAST LOVELAND NB
9 PM to 5 AM
9 AM to 3 PM
9 PM to 5 AM
9 AM to 3 PM
9 PM to 5 AM
9 AM to 3 PM
Anytime Anytime Anytime
287C 331.65 318.33 19TH ST SOUTHEAST LOVELAND SH 66 LONGMONT SB
9 PM to 5 AM
9 AM to 3 PM
9 PM to 5 AM
9 AM to 3 PM
9 PM to 5 AM
9 AM to 3 PM
Anytime Anytime Anytime
287C 331.65 332.67 19TH ST SOUTHEAST LOVELAND S CLEVELAND AVE LOVELAND NB
9 PM to 5 AM
9 AM to 4 PM
9 PM to 5 AM
9 AM to 4 PM
9 PM to 5 AM
9 AM to 4 PM
Anytime Anytime Anytime
287C 332.67 331.65 S CLEVELAND AVE LOVELAND 19TH ST SOUTHEAST LOVELAND SB
9 PM to 5 AM
9 AM to 4 PM
9 PM to 5 AM
9 AM to 4 PM
9 PM to 5 AM
9 AM to 4 PM
Anytime Anytime Anytime
26000 4
24000 4
30000 4
31000 4
25000 4
28000 4
24000 4
23000 4
24000 4
28000 4
28000 4
13000 4
40000 4
32000 4
Page D-11

CDOT Region 4 Appendix D - Fall/Winter Single-Lane Closure Allowed Hours Lane Closure Strategy - 4th Ed.
0.0 - 0.5 mile
Lane Closure
0.5 - 1.0 mile
Lane Closure
> 1.0 mile
Lane Closure
0.0 - 0.5 mile
Lane Closure
0.5 - 1.0 mile
Lane Closure
> 1.0 mile
Lane Closure
Spring/Summer: April – October, Fall/Winter: November – March
# of
Lanes
Dir.
Fall/Winter Weekday Allowed Hours: Fall/Winter Weekend Allowed Hours:
State
Highway
Number
Beginning of
Section MP#
End of
Section
MP #
Beginning of Section - Description End of Section - Description
2018 Volume
(AADT)
287C 332.67 333.41 S CLEVELAND AVE LOVELAND 6TH ST LOVELAND 12000 2 NB
9 PM to 5 AM
9 AM to 4 PM
9 PM to 5 AM
9 AM to 4 PM
9 PM to 5 AM
9 AM to 4 PM
Anytime Anytime Anytime
287C 333.41 334.31 6TH ST LOVELAND 17TH AVE LOVELAND 17000 3 NB
9 PM to 5 AM
9 AM to 4 PM
9 PM to 5 AM
9 AM to 4 PM
9 PM to 5 AM
9 AM to 4 PM
Anytime Anytime Anytime
287C 334.31 339.13 17TH AVE LOVELAND SH 392 NB 9 PM to 5 AM 9 PM to 5 AM 9 PM to 5 AM 6 PM to 11 AM 6 PM to 11 AM 6 PM to 11 AM
287C 339.13 334.31 SH 392 17TH AVE LOVELAND SB 9 PM to 5 AM 9 PM to 5 AM 9 PM to 5 AM 5 PM to 9 AM 5 PM to 9 AM 5 PM to 9 AM
287C 339.13 342.21 SH 392 HARMONY ROAD FORT COLLINS NB
9 PM to 5 AM
9 AM to 4 PM
9 PM to 5 AM
9 AM to 4 PM
9 PM to 5 AM
9 AM to 4 PM
5 PM to 9 AM 5 PM to 9 AM 5 PM to 9 AM
287C 342.21 339.13 HARMONY ROAD FORT COLLINS SH 392 SB
9 PM to 5 AM
9 AM to 4 PM
9 PM to 5 AM
9 AM to 4 PM
9 PM to 5 AM
9 AM to 4 PM
6 PM to 10 AM 6 PM to 10 AM 6 PM to 10 AM
287C 342.21 345.99 HARMONY ROAD FORT COLLINS LAUREL ST FORT COLLINS NB
9 PM to 5 AM
9 AM to 4 PM
9 PM to 5 AM
9 AM to 4 PM
9 PM to 5 AM
9 AM to 4 PM
Anytime Anytime Anytime
287C 345.99 342.21 LAUREL ST FORT COLLINS HARMONY ROAD FORT COLLINS SB
9 PM to 5 AM
9 AM to 4 PM
9 PM to 5 AM
9 AM to 4 PM
9 PM to 5 AM
9 AM to 4 PM
Anytime Anytime Anytime
287C 345.99 346.63 LAUREL ST FORT COLLINS MOUNTAIN AVE FORT COLLINS NB
9 PM to 5 AM
9 AM to 4 PM
9 PM to 5 AM
9 AM to 4 PM
9 PM to 5 AM
9 AM to 4 PM
Noon to 9 AM Noon to 9 AM Noon to 9 AM
287C 346.63 345.99 MOUNTAIN AVE FORT COLLINS LAUREL ST FORT COLLINS SB
9 PM to 5 AM
9 AM to 4 PM
9 PM to 5 AM
9 AM to 4 PM
9 PM to 5 AM
9 AM to 4 PM
5 PM to Noon 5 PM to Noon 5 PM to Noon
287C 346.63 348.63 MOUNTAIN AVE FORT COLLINS SH 1 / TERRY LAKE RD NB
9 PM to 5 AM
9 AM to 4 PM
9 PM to 5 AM
9 AM to 4 PM
9 PM to 5 AM
9 AM to 4 PM
2 PM to 9 AM 2 PM to 9 AM 2 PM to 9 AM
287C 348.63 346.63 SH 1 / TERRY LAKE RD MOUNTAIN AVE FORT COLLINS SB
9 PM to 5 AM
9 AM to 4 PM
9 PM to 5 AM
9 AM to 4 PM
9 PM to 5 AM
9 AM to 4 PM
5 PM to 11 AM 5 PM to 11 AM 5 PM to 11 AM
287C 348.63 350.21 SH 1 / TERRY LAKE RD LARIMER CR 54G LA PORTE NB Anytime Anytime Anytime Anytime Anytime Anytime
287C 350.21 348.63 LARIMER CR 54G LA PORTE SH 1 / TERRY LAKE RD SB Anytime Anytime Anytime Anytime Anytime Anytime
287C 350.21 352.35 LARIMER CR 54G LA PORTE OVERLAND TRAIL 7400 2 Both Anytime Anytime 6 PM to 7 AM Anytime Anytime 6 PM to 9 AM
287C 352.35 367.01 OVERLAND TRAIL LARIMER CR 74E 8800 3 Both Anytime Anytime Anytime Anytime Anytime Anytime
287C 367.01 367.84 LARIMER CR 74E LARIMER CR 80 4800 2 Both Anytime Anytime Anytime Anytime Anytime 5 PM to 11 AM
287C 367.84 385.22 LARIMER CR 80 WYOMING STATE LINE 4100 3 Both Anytime Anytime Anytime Anytime Anytime Anytime
287Z 0.00 0.17 BEGIN 1-WAY SOUTHBOUND (17TH AVE) 16TH STREET LOVELAND 15000 2 SB
9 PM to 5 AM
9 AM to Noon
9 PM to 5 AM
9 AM to Noon
9 PM to 5 AM
9 AM to Noon
5 PM to Noon 5 PM to Noon 5 PM to Noon
287Z 0.17 1.27 16TH STREET LOVELAND 2ND ST LOVELAND 13000 3 SB
9 PM to 5 AM
9 AM to 4 PM
9 PM to 5 AM
9 AM to 4 PM
9 PM to 5 AM
9 AM to 4 PM
Anytime Anytime Anytime
287Z 1.27 1.76 2ND ST LOVELAND END 1-WAY SOUTHBOUND (5TH ST SE) 12000 2 SB
9 PM to 5 AM
9 AM to 4 PM
9 PM to 5 AM
9 AM to 4 PM
9 PM to 5 AM
9 AM to 4 PM
Anytime Anytime Anytime
385B 135.41 149.70 KIOWA / CHEYENNE COUNTY LINE US 40 IN CHEYENNE WELLS 610 2 Both Anytime Anytime Anytime Anytime Anytime Anytime
385C 150.31 207.51 US 40 IN CHEYENNE WELLS KIT CARSON/YUMA CTY LINE 5300 2 Both Anytime Anytime 6 PM to 3 PM Anytime Anytime Anytime
385C 207.51 216.86 KIT CARSON/YUMA CTY LINE US 36 WEST 800 2 Both Anytime Anytime Anytime Anytime Anytime Anytime
385D 219.37 241.12 US 36 EAST YUMA CR 33 920 2 Both Anytime Anytime Anytime Anytime Anytime Anytime
385D 241.12 278.93 YUMA CR 33 JOHNSON ST IN HOLYOKE 4000 2 Both Anytime Anytime Anytime Anytime Anytime Anytime
385D 278.93 279.42 JOHNSON ST IN HOLYOKE FURRY ST HOLYOKE 3700 4 Both Anytime Anytime Anytime Anytime Anytime Anytime
385D 279.42 309.14 US 6 HOLYOKE I-76 JULESBURG INTERCHANGE 2600 2 Both Anytime Anytime Anytime Anytime Anytime Anytime
385D 309.14 311.00 I-76 JULESBURG INTERCHANGE US 138 JULESBURG 1600 2 Both Anytime Anytime Anytime Anytime Anytime Anytime
385E 313.69 317.63 JULESBURG AIRPORT CO-NE STATE LINE 530 2 Both Anytime Anytime Anytime Anytime Anytime Anytime
30000 4
14000 4
35000 4
42000 6
27000 4
37000 4
Page D-12

CDOT Region 4 Appendix D - Fall/Winter Single-Lane Closure Allowed Hours Lane Closure Strategy - 4th Ed.
0.0 - 0.5 mile
Lane Closure
0.5 - 1.0 mile
Lane Closure
> 1.0 mile
Lane Closure
0.0 - 0.5 mile
Lane Closure
0.5 - 1.0 mile
Lane Closure
> 1.0 mile
Lane Closure
Spring/Summer: April – October, Fall/Winter: November – March
# of
Lanes
Dir.
Fall/Winter Weekday Allowed Hours: Fall/Winter Weekend Allowed Hours:
State
Highway
Number
Beginning of
Section MP#
End of
Section
MP #
Beginning of Section - Description End of Section - Description
2018 Volume
(AADT)
392A 95.31 100.00 US 287 I-25 WINDSOR INTERCHANGE 16000 2 Both
9 PM to 5 AM
9 AM to Noon
9 PM to 5 AM 9 PM to 5 AM 9 PM to 10 AM 9 PM to 9 AM 10 PM to 7 AM
392A 100.00 104.46 I-25 WINDSOR INTERCHANGE 7TH ST IN WINDSOR (SH 257 NORTH) 21000 2 Both 9 PM to 5 AM 9 PM to 5 AM 10 PM to 5 AM 9 PM to 9 AM 9 PM to 8 AM 11 PM to 6 AM
392B 105.44 107.42 SH 257 SOUTH WELD CR 23 8900 2 Both 5 PM to 4 PM
6 PM to 6 AM
8 AM to 4 PM
7 PM to 5 AM Anytime Anytime 6 PM to 11 AM
392B 107.42 112.57 WELD CR 23 WELD CR 33 8500 2 Both Anytime
6 PM to 6 AM
8 AM to 4 PM
7 PM to 5 AM Anytime Anytime 6 PM to 10 AM
392B 112.57 117.61 WELD CR 33 WELD CR 43 7800 2 Both Anytime
6 PM to 6 AM
8 AM to 4 PM
7 PM to 5 AM Anytime Anytime 6 PM to 11 AM
392B 117.61 141.58 WELD CR 43 WELD CR 55 4000 2 Both Anytime Anytime 6 PM to 5 PM Anytime Anytime Anytime
402A 0.00 4.23 US 287 I-25 EAST FRONTAGE ROAD 19000 2 Both 9 PM to 5 AM 9 PM to 5 AM 9 PM to 5 AM 9 PM to 10 AM 9 PM to 9 AM 9 PM to 7 AM
Page D-13

APPENDIX E
SCHEDULE FOR CLOSING 2 LANES

Region 4 Lane Closure Strategy, 4
th
Ed.
Appendix E
APPENDIX E. DUAL-LANE ALLOWABLE
CLOSURE HOURS

CDOT Region 4 Appendix E - Double-Lane Closure Allowed Hours Lane Closure Strategy - 4th Ed.
Weekday Weekend Weekday Weekend
007C 52.49 54.33 US 36 (28TH ST) BOULDER 55TH ST BOULDER 3 EB 9 PM to 5 AM 6 PM to Noon 9 PM to 5 AM 5 PM to 1 PM
007C 54.33 52.49 55TH ST BOULDER US 36 (28TH ST) BOULDER 3 WB 9 PM to 5 AM 5 PM to 11 AM 9 PM to 5 AM 4 PM to Noon
007C 55.25 54.33 63RD ST BOULDER COUNTY 55TH ST BOULDER 28000 3 WB 9 PM to 5 AM Anytime 9 PM to 5 AM Anytime
025A 229.11 235.15 SH 7/ BASELINE RD BROOMFIELD COUNTY SH 52 / DACONO / FT LUPTON 3 NB 11 PM to 5 AM 11 PM to 5 AM 10 PM to 5 AM 11 PM to 5 AM
025A 235.15 229.11 SH 52 / DACONO / FT LUPTON SH 7/ BASELINE RD BROOMFIELD COUNTY 3 SB 10 PM to 5 AM 11 PM to 5 AM 9 PM to 5 AM 9 PM to 5 PM
025A 235.15 243.15 SH 52 / DACONO / FT LUPTON SH 66 3 NB 11 PM to 5 AM 11 PM to 5 AM 11 PM to 5 AM 10 PM to 5 AM
025A 243.15 235.15 SH 66 SH 52 / DACONO / FT LUPTON 3 SB 10 PM to 5 AM 10 PM to 5 AM 10 PM to 5 AM 9 PM to 5 AM
025A 250.00 247.00 SOUTHBOUND PASSING LANE START SOUTHBOUND PASSING LANE END 84000 3 SB 9 PM to 5 AM 9 PM to 5 AM 9 PM to 5 AM 9 PM to 5 AM
034D 8.77 10.00 BEGIN 1-WAY EB (10TH ST) GREELEY 10TH AVE GREELEY 10000 3 EB 9 PM to 5 AM Anytime Anytime Anytime
034Z 0.00 1.30 BEGIN 1-WAY WB (9TH ST) GREELEY WEST OF 23RD AVE GREELEY 11000 3 WB 9 PM to 5 AM Anytime 6 PM to 4 PM Anytime
036E 0.00 0.28 US 36/BASELINE RD BOULDER SH 93 3 EB 8 PM to 10 AM 6 PM to Noon 8 PM to Noon 6 PM to 1 PM
036E 0.28 0.00 SH 93 US 36/BASELINE RD BOULDER 3 WB 7 PM to 8 AM 5 PM to 10 AM 7 PM to 8 AM 4 PM to Noon
085L 265.85 266.65 US 34 22ND ST GREELEY 30000 3 NB
9 PM to 5 AM
9 AM to 2 PM
9 PM to Noon
9 PM to 5 AM
9 AM to 2 PM
Anytime
093A 16.33 17.42 TABLE MESA DR BOULDER US 36E / BASELINE RD BOULDER 3 NB 9 PM to 5 AM 6 PM to Noon
9 PM to 5 AM
1 PM to 3 PM
5 PM to 1 PM
093A 17.42 16.33 US 36E / BASELINE RD BOULDER TABLE MESA DR BOULDER 3 SB 9 PM to 5 AM 5 PM to 11 AM
9 PM to 5 AM
9 AM to 2 PM
3 PM to 1 PM
093A 17.42 17.78 US 36E / BASELINE RD BOULDER 20TH ST BOULDER 36000 3 NB 9 PM to 5 AM 6 PM to Noon 9 PM to 5 AM 6 PM to 1 PM
119B 44.98 46.18 FOOTHILLS PARKWAY INTERCHANGE JAY ROAD BOULDER 3 EB 9 PM to 5 AM 9 PM to 9 AM 9 PM to 5 AM 9 PM to 10 AM
119B 46.18 44.98 JAY ROAD BOULDER FOOTHILLS PARKWAY INTERCHANGE 3 WB 9 PM to 5 AM 9 PM to 8 AM 9 PM to 5 AM 7 PM to 9 AM
119B 56.25 57.32 US 287 LONGMONT S MARTIN ST LONGMONT 3 EB
9 PM to 5 AM
9 AM to 11 AM
9 PM to 11 AM
9 PM to 5 AM
9 AM to 11 AM
6 PM to 1 PM
119B 57.32 56.25 S MARTIN ST LONGMONT US 287 LONGMONT 3 WB 9 PM to 5 AM 9 PM to 10 AM 9 PM to 5 AM 5 PM to 10 AM
138A 0.00 0.55 US 6 STERLING (BEGIN NB 1-WAY) BROADWAY ST STERLING (END NB 1-WAY) 4400 3 NB Anytime Anytime Anytime Anytime
138Z 0.00 0.61 BROADWAY STREET STERLING (BEGIN SB 1-WAY) US HIGHWAY 6 (END SB 1-WAY) 4600 3 SB Anytime Anytime Anytime Anytime
287C 333.41 334.31 6TH ST LOVELAND 17TH AVE LOVELAND 17000 3 NB 9 PM to 5 AM 6 PM to Noon
9 PM to 5 AM
9 AM to 11 AM
5 PM to 11 AM
287C 342.21 345.99 HARMONY ROAD FORT COLLINS LAUREL ST FORT COLLINS 3 NB 9 PM to 5 AM 7 PM to 8 AM 9 PM to 5 AM 5 PM to 9 AM
287C 345.99 342.21 LAUREL ST FORT COLLINS HARMONY ROAD FORT COLLINS 3 SB 9 PM to 5 AM 8 PM to 10 AM
9 PM to 5 AM
9 AM to 1 PM
6 PM to 11 AM
287Z 0.17 1.27 16TH STREET LOVELAND 2ND ST LOVELAND 13000 3 SB 9 PM to 5 AM 6 PM to Noon
9 PM to 5 AM
9 AM to 11 AM
5 PM to 11 AM
Spring/Summer: April – October, Fall/Winter: November – March
42000
38000
58000
34000
36000
127000
104000
35000
# of
Lanes
Dir.
Spring/Summer Allowed Hours: Fall/Winter Allowed Hours:
State
Highway
Number
Beginning
of Section
MP#
End of
Section
MP #
Beginning of Section - Description End of Section - Description
2018 Volume
(AADT)
Page E-1

6300 South Syracuse Way, Suite 600 Centennial, CO 80111 303.721.1440 www.fhueng.com
