
Primary Care
in the United States
A Chartbook of
Facts and Statistics

Primary Care in the United States 2
Prepared by:
Robert Graham Center (RGC)
1133 Connecticut Avenue NW, Suite 1100
Washington, DC 20036
www.graham-center.org
@TheGrahamCenter
IBM-Watson Health (IBM)
75 Binney St
Cambridge, MA 02142
www.ibm.com/watson-health
The American Board of Family Medicine (ABFM) & afliated
Center for Professionalism & Value in Health Care (CPV)
1016 16th Street NW, Suite 700
Washington, DC 20036
https://professionalismandvalue.org/
Contributors:
Brian Antono, RGC
Andrew Bazemore, ABFM/CPV
Irene Dankwa-Mullan, IBM
Judy George, IBM
Anuradha Jetty, RGC
Stephen Petterson, RGC
Amol Rajmane, IBM
Kyu Rhee, IBM
Bedda L. Rosario, IBM
Elisabeth Scheufele, IBM
Joel Willis, ABFM/CPV
Acknowledgements:
Thanks to the many people who contributed to this report
throughout its development at IBM, ABFM, and the Robert
Graham Center. IBM colleagues include: Sean Kennedy, Tim
Bullock, Kay Miller, Amanda Mummert and Sarah Kefayati.
Published February 2021
Suggested Citation:
Willis J, Antono B, Bazemore A, Jetty A, Petterson S, George
J, Rosario BL, Scheufele E, Rajmane A, Dankwa-Mullan I,
Rhee K. The State of Primary Care in the United States:
A Chartbook of Facts and Statistics. October 2020.
Table of
contents
04 Preface
06 Executive Summary
07 I. Introduction
08 Why Primary Care?
09 Ecology of Medical Care
10 II. First Contact
11 Who Provides Primary Care?
11 Primary Care Physicians
12 Primary Care Nurse Practitioners and Physician Assistants
12 Age Distribution of Primary Care Physicians
13 Primary Care Physicians by Gender
13 Number of Graduates from Primary Care Residencies
14 Where is Primary Care Provided?
14 Ratios of Primary Care Professionals to Population
15 Primary Care Physician to Population Ratios by State
16 Primary Care Physicians by Rural/Urban Geography
16 Primary Care Practices by Ownership
18 III. Continuity
19 Who Visits Primary Care Practices?
19 Ofce Visits to Physicians by Specialty
20 Outpatient Visits to Primary Care Physicians
by Patient Age and Sex
21 IV. Comprehensiveness
22 What Medical Conditions do Primary
Care Physicians Address?
22 Primary Care Physicians’ Scope of Practice
23 Primary Care for Patients with Chronic Conditions
23 Changes in Primary Care Scope of Practice
24 V. Coordination
25 How Does Care Coordination Function in Primary Care?
27 VI. Cost
28 How Much Do We Spend on Primary Care?
29 Expenditures for Primary Care
30 Primary Care Payment Sources
30 Trends in Compensation for Primary Care Providers
31 VII. Preventive Care Visits
32 Why Preventive Care Visits?
33 Trend of Preventive Care Visit Utilization
34 Preventive Care Visit Utilization, Stratied by Age and Sex
35 Preventive Care Visit Utilization, Regional Distribution
36 Preventive Care Visit Utilization, by Health Plan
37 Patients with Preventive Care Visits, Primary Care and Non-
Primary Care Providers
38
Trend of Average Total Cost of Preventive Care Visit Utilization
39 VIII. References
42 Methods Appendix
44 Description of Data Sources
Primary Care in the United States 3

Preface
As we launched this project in the summer of 2019, we
could scarcely have imagined that just 12 months later,
the United States (U.S.) would be beleaguered in a global
pandemic by the coronavirus disease 2019 (COVID-19).
What is even more surprising is that we would submit a
Chartbook for publication in the country facing the world’s
heaviest pandemic burden at that time, despite having the
greatest per capita wealth and health care spending
of any nation. The United States, home to 4% of the world’s
population, currently accounts for about a quarter of
both the world’s COVID-19 cases (4,000,000) and deaths
(150,000).
1,2
Such dismal gures coincide with an overly
specialized, and highly fragmented U.S. health care
system with a long history of underinvestment in both
primary care and public health.
At this moment, the only certainty seems to be more
uncertainty as we nd ourselves coming to grips with a
“new normal.” Yet, as the current situation continues to
evolve, the impact of COVID-19 will be felt far beyond its
population-based effects on morbidity and mortality,
3
with sequelae including:
4
severely strained management
of chronic disease,
5
increase in and worsening of mental
health,
6,7
and associated effects,
8
and exacerbation
9
in
disparity of an already existing and uneven provision
of medical and health care services
10
for vulnerable
populations. Despite the challenges being endured during
this pandemic, the practice of primary care stands to
play a signicant role in the management of these issues,
employing previously underutilized technology such as
telehealth, and overcoming the nancial and physical
limitations imposed by the pandemic on a practice model
built on routinely physician ofce-based patient care.
Primary care is not exempt from the strain facing so many
sectors of the U.S. economy, and health care in particular.
Early convenience sampled surveys administered weekly
to a cohort of over 700 U.S. primary care clinicians (across
49 states) suggested they experienced extreme mental
stress, increased morbidity and mortality among patients
from pandemic-related constraints, resource loss (due to
staff sickness and/or quarantine), and existential nancial
strain.
11
The means by which primary care practices meet
such challenges is evolving, but there is little doubt that
the pandemic will leave an indelible mark on primary care
access, team-structure, size, and delivery.
The health care community has also experienced a
transformation in clinical care delivery. After years of
lamenting the limited use, and sluggish adoption of
telehealth in primary care,
12
the swift pivot and embrace
of this platform by primary care clinicians and patients
alike to accommodate social distancing imperatives has
been remarkable. The demand and use of telehealth
services has accelerated rapidly as new rules relaxed prior
regulations, resulting in exponentially expanding access,
billing, and services.
13
A study by The Commonwealth
Fund showed that as in-person visits dropped early
in the pandemic, telemedicine visits briskly peaked
to 14% of weekly visits through mid-April. By mid-
June, telemedicine visits declined from its peak, but
remained substantially higher than pre-COVID-19 levels.
14
Unfortunately, primary care practices, that were unable to
shift to virtual care, were forced to restrict certain services
or to close.
11
One model examining the nancial impact of COVID-19
on U.S. primary care practices estimates that $15.1 billion
is needed to neutralize revenue losses nationally.
15
Even
assuming a rapid ramp up of telemedicine services to
offset losses of in-person visits, a variety of scenarios
estimates primary care practices losing over $65,000
per full-time equivalent (FTE) physician from current
fee-for-service payment structures.
15
An example in
Virginia demonstrated that a network of 12 primary care
ofces and 500 employees experienced 50% losses in
patient volume and 60% losses in revenue by May 2020
– resulting in furloughs of 50 employees, reduced staff
Primary Care Amidst
a Generational Pandemic
Primary Care in the United States 4

hours, and signicant pay cuts to clinician salaries.
16
Despite such nancial challenges, clinicians and primary
care practices around the country have fought hard to
keep their doors open.
17
As it currently stands, the direct costs of COVID-19
illustrate a disproportionate burden on minority
communities. Black, Indigenous, Latinx, and other
people of color are facing higher rates of hospitalization
or death from COVID-19 compared to non-Hispanic
white persons.
18
People of color have also suffered from
long-standing systemic health and social inequities
leading to higher rates of chronic conditions that worsen
the effects of COVID-19.
19
In addition to direct costs of
COVID-19 are indirect ones, or COVID collateral. These
include but are not limited to missed preventive care
needs, depression, anxiety, substance misuse, and
domestic violence increasingly witnessed by primary care
practices throughout the country.
11
Ultimately, the risks of
signicant morbidity and mortality from these sequelae
may far outweigh the enormous damage by the initial
wave of COVID-19.
With adequate attention and investment, primary care
– in coordination with public and community health
sectors – can mitigate both the long-established health
disparities and indirect sequelae facing the American
public after COVID-19 recedes. Whether this happens
depends on fundamental reforms to infrastructure and
associated payment models, and a renewed prioritization
of core functions. Empowered to provide ‘First Contact’ for
patients suffering directly or indirectly from COVID-19,
and coordinate contact tracing, primary care can help to
reduce emergency room and intensive care unit burden
from unnecessary care, expense, and overwhelmed
capacity. Primary care clinicians can further build on
‘Continuity’ relationships previously established with
their patients to offer reassurance, effective triage, and
certainty in a time rife with more questions than answers.
The ‘Comprehensive’ range of services that primary care
offers across the widest platform of delivery in America can
reduce the collateral damage from COVID-19 to support
patients with chronic diseases whose routine care was
usurped by the urgency of the pandemic and to incorporate
eventual vaccine and possible treatment regimens as they
emerge. And nally, well-supported primary care can
provide our patients and populations with ‘Coordinated’
care, including but not limited to mitigating challenges
in accessing mental health support and services as well
as securing affordable food, medications, and shelter.
Alternatively, the nancial apocalypse ushered in by the
pandemic for many primary care practices could leave
the nation with critical gaps in its most utilized and widely
distributed source of care, exactly when we need it most.
We hope that this Chartbook provides some utility to those
seeking to better understand primary care and to those
working to ensure its viability as we continue through the
pandemic-engendered “new normal.”
Primary Care in the United States 5Preface
Executive
Summary
Primary Care (PC) has entered a new decade facing truly
dynamic times for U.S. politics, culture, health, and the
system charged with its maintenance. And yet, just two
years after the world’s nations reafrmed primary care’s
central role in the achievement of “Health for All,” and as
we await the rst report from the National Academies of
Medicine on High Performing Primary Care since 1996,
20
not much has changed.
Despite renewed interest in strengthening primary
care in the United States in recent years, there remains
an inadequate understanding of what primary care is
and does, insufcient investment in its infrastructure
and growth, inadequacy in its workforce numbers and
distribution, and inefcient coordination with other sectors.
In what follows, we seek to improve upon gaps in knowledge
by offering a snapshot of the facts and gures that make up
contemporary U.S. Primary Care. It is our sincere hope that
such information not only ignites a curiosity to learn more,
but simultaneously serves as a foundation to improve upon
this vital health system function.
The Chartbook is loosely organized around Dr. Barbara
Stareld’s conceptual framing of primary care’s
salutary effects as “4 C’s” - First Contact, Continuity,
Comprehensiveness, and Coordination of care. Through
these four dimensions, Dr. Stareld explained how systems
emphasizing primary care achieved greater access to
higher quality health care at lower costs and with greater
equity across populations.
The analyses conducted within this Chartbook reafrm
Primary Care’s standing as the largest platform of health
care delivery in the United States, an idea rst quantied
and illustrated by the grandfather of Health Services
Research, Dr. Kerr White, in 1961 – and which still holds
true today. Additional analyses also conrm that the
proportion of the U.S. physician workforce in primary care
has diminished to 31% (Table 1), as specialist training
continues to grow in the absence of a National Workforce
Commission or federal agency directing workforce
planning. Hopes that nurse practitioners and physician
assistants might ll the gap remain. However, these groups
face the same incentives to specialize as physicians,
and their proportional PC contributions continue to lag
anticipated levels (Table 2).
Sections II and III of the Chartbook frames basic facts and
gures on patient contact with primary care, by exploring
visits,and how they vary by specialty type, age and gender.
Section IV tackles the frequency and range of conditions
seen in primary care, and how they are changing.
Remarkably, despite representing less than one-third of the
physician workforce, more than 80% of patients
with 8 common chronic conditions saw a primary care
physician for that condition within a two-year period.
Understanding the adequacy of a future PC workforce,
particularly for vulnerable areas and populations, requires
successful denition of who is currently practicing primary
care as well as elucidation of age and gender distributions,
and graduate outputs (Figures 2-4). Recent years have
seen misestimation of primary care physician supply that
have potentially dangerous implications for workforce
planning.
21
For example, Table 1 offers a contemporary
enumeration of the total physician workforce in primary
care. Other gures will help the reader understand the
percentage of the current PC workforce approaching
retirement age, who are serving rural communities, the
distribution across practice ownership types and sizes,
and how the ratios of primary care to population varies
across all 50 states (Figure 5).
In Section V, new analyses inform the coordinating
function of primary care, as exemplied by an evolving
and multifaceted primary care team. New conceptual
approaches to capturing overall investment in primary
care are the subject of Section VI. Using a nationally
representative data source, this section also reveals the
persistent underinvestment in primary care relative
to other sectors.
In Section VII, the Chartbook takes a novel look at
Preventive Care Visit (PCV) utilization. Using the largest
aggregation of commercial data available, we nd that PCV
use has steadily increased over the ten-year period of 2008-
2018. However, the results also suggest that PCV utilization
remains low (28.9% to 44.8% in 2018), particularly among
males and in rural communities and in the Western
U.S., suggesting that there remain policy and practice
opportunities to improve preventive care.
While it would be a daunting task for a chartbook to paint
a complete portrait of a domain as broad as primary care,
we hope that readers will nd the array of facts and gures
collected into this one to be helpful in their understanding
of primary care, well-established as the ‘central’ and
‘essential’ feature of any robust health system.
Primary Care in the United States 6

I. Introduction
Primary Care in the United States 7
Why Primary Care?
In 1978, the nations of the world gathered at Alma-Ata and
declared primary care as the key to attaining “Health for
All.”
25
In 1996, an Institute of Medicine (IOM) report dened
primary care as “the provision of integrated, accessible
health care services by clinicians who are accountable
for addressing a large majority of personal health care
needs, developing a sustained partnership with patients,
and practicing in the context of family and community.”
26
In her seminal work, Dr. Barbara Stareld, preeminent
scholar and health services researcher, conceptualized the
vital role and value of primary care as 4 C’s—First Contact,
Continuity, Comprehensiveness, and Coordination of
care. Over a 25 year career, Stareld reinforced primary
care’s strong association with improvement in overall
health outcomes for persons and populations, including
but not limited to broader access, lower costs, greater
health equity, and higher quality.
27
Presently, in the U.S.
primary care sits on the precipice of a broken health care
system. If strengthened in well-designed, well-delivered,
and well-used ways, the 4 C’s of primary care can provide
a solid foundation for achievement of the quadruple aim—
improving quality of care, health of people and populations,
reducing health care cost, and improving the work life of
health care clinicians and staff.
In 2000, the World Health Organization (WHO) assessed the
world’s health systems and ranked the United States 37
th
out of 191
countries.
22
Despite attempts at improvement, the United States in
2020 continues to woefully underperform in key aspects of health
care services including access, efciency, quality, and equity while
simultaneously spending more on health care than any other system
in the world—over $3 trillion per year.
23
One major culprit is a U.S.
health care system that has become increasingly fragmented in its
delivery, services, and attempts at solutions begetting unsustainability,
ineffectiveness, and more brokenness.
24
U.S. primary care can play
a critical role in reconnecting and correcting a system capable of
achieving safe, high-quality, accessible, equitable, and affordable
health care for all Americans. This chartbook describes the current
state of primary care in the United States presenting information from
a variety of national data sources to answer questions about who, what,
where, and how primary care is being delivered.
1. IntroductionPrimary Care in the United States 8

Figure 1 below shows the proportion of Americans who
seek various types of health care services in an average
month. For every 1,000 people in the United States:
– 800 report symptoms
– 327 consider seeking medical care
– 217 visit a physician’s ofce
(of which 113 visit a primary care physician)
– 104 visit a specialist physician
– 65 visit a complementary
or alternative medical care provider
– 21 visit a hospital-based outpatient clinic
– 14 receive health services at home
– 13 visit an emergency department
– Eight are hospitalized
– Less than one person is hospitalized
in an academic medical center
1. Introduction
Figure 1. The Ecology of Medical Care, 2001
Ecology of Medical Care
Primary care remains the largest platform of health care
delivery in the United States, rst demonstrated by Kerr
White in 1961. Forty years later, an updated and expanded
estimate of the use of all health services calculated the
number of Americans who experience certain health care
events in a typical one-month period. Using multiple data
sources and comparing primary care services to other
medical specialty services, the model showed that more
people seek primary care than any other type of health
care service.
1000 persons
800 report symptoms
327 consider seeking medical care
217 visit a physician’s ofce
(113 visit a primary care physician’s ofce)
65 visit a complimentary or alternative medical
care provider
21 visit a hospital outpatient clinic
14 receive home healthcare
13 visit an emergency department
8 are hospitalized
<1 is hospitalized in an academic medical center
Primary Care in the United States 9

II. First Contact
Primary Care in the United States 10

Who Provides Primary Care?
Unlike many other countries, the U.S. primary care workforce lags
woefully behind its specialty care counterparts. At present, primary
care physicians represent only about one-third of the overall physician
workforce in the United States.
28
This falls far short of the 40 percent
primary care workforce recommended by the Council on Graduate
Medical Education (COGME) report on Advancing Primary Care.
29
Although the 2010 COGME report outlined signicant evidence
demonstrating optimal health outcomes when 40 percent of the
physician workforce are primary care physicians,
the United States
has seen a decades decline in production of primary care physicians
relative to specialty physicians.
30
A closer look reveals declining trends
in U.S. medical graduates choosing family medicine—14 to 8 percent
among allopathic graduates from 2000 to 2005 and 34 to 29 percent
among osteopathic graduates from 2001 to 2008.
29
This decline is
further magnied by the looming retirement of one-quarter of the
primary care physician workforce,
28
and an anticipated increase in
demand for primary care physicians as the U.S. population grows
larger and older. If supply and demand trends persist, the American
Association of Medical Colleges (AAMC) estimates a shortage ranging
between 21,100 and 55,200 primary care physicians by 2032.
31
Primary Care Physicians
In 2019, there were more than 228,000 direct patient
care physicians in the ve major primary care specialties
(Table 1). The major specialty of primary care is family
medicine, accounting for nearly 40 percent of the total
primary care physician workforce, followed by general
internal medicine and general pediatrics. The number of
geriatricians is relatively small. Primary care physicians
make up less than one-third of the physicians who spend
most of their time caring for patients.
28
Table 1. Number of Ofce-Based, Direct Patient Care Physicians by Specialty, 2019
Physician Type Number of Physicians Percent of Primary Care Physicians Percent Total
Total Physicians 730,026 – 100.0%
Non-Primary Care Physicians 501,089 – 68.6%
Total Primary Care Physicians 228,936 100.0% 31.4%
Family Physicians 91,037 39.8% 12.5%
Geriatrics 4,495 2.0% 0.6%
General Practice 5,579 2.4% 0.8%
General Internal Medicine 78,984 34.5% 10.8%
General Pediatrics 48,842 21.3% 6.7%
Source: American Medical Association (AMA) Physician Masterle, 2019
Primary Care in the United States 112. First Contact

Figure 2. Age Distribution of Primary Care Physicians, 2019
Source: American Medical Association (AMA) Physician Masterle, 2019
Primary Care Nurse Practitioners
and Physician Assistants
Rapid growth in the number of nurse practitioners (NPs)
and physician assistants (PAs) have offered new hope for
lling gaps in access to primary care. However, the well-
documented decline in physicians choosing primary care
appears to be shared by NPs and PAs, which have seen
similar reductions in primary care as a preferred specialty
choice.
32
In recent reports, debate remains over what
portion of NPs and PAs enter primary care. For example,
the National Commission on Certication of Physician
Assistants (NCCPA) notes that only 25.8% of PAs (25,487)
currently work in primary care settings, versus ndings by
the Agency for Health Care Research and Quality (AHRQ)
in 2016 estimating 43.4% of PAs (36,119) practice primary
care.
33,34
It is clear in either case that ensuring PAs and NPs
entry into and retention in primary care is a challenge,
much like that faced in the physician workforce. Table 2
below shows an updated estimate of the total number
of PAs and NPs, and the proportion of each working in
primary care based on a ‘co-location’ method described
in the Appendix. Lacking the type of data Masterle that
is available to physicians, this is an estimate only.
Table 2. Estimates of Nurse Practitioners and Physician Assistants in Primary Care, 2020
Provider Type Total Number Percent in Primary Care Number in Primary Care
Nurse Practitioners 220,332 42.8% 94,302
Physician Assistants 118,195 35.7% 42,195
Source: Medicare Provider Enrollment, Chain, and Ownership System (PECOS), 2020
<35 35-39
0
5K
10K
15K
20K
25K
30K
35K
40K
40-44 45-49 50-54 55-59 60-64 65-69 70-74 75-80 80-84 85+
Age Distribution of Primary Care Physicians
Most primary care physicians arrive in the workforce in
their late 20s, and typically remain in the workforce for 40
years. The increased interest in primary care in the late
1990s likely explains the age peak of physicians in the mid-
late 40s (Figure 2). In 2019, nearly one-quarter of primary
care physicians were aged 60 years and older.
28
Compared to physicians, physician assistants (PAs) in
primary care tend to be younger on average. Only 14% of
primary care PAs are aged 60 years or older. The median
age is 40 years.
35
Age distribution data were not available for
primary care nurse practitioners.
Primary Care in the United States 122. First Contact

Figure 3. Primary Care Physicians by Gender and Specialty, 2019
Source: American Medical Association (AMA) Physician Masterle, 2019
Primary Care Physicians by Gender
The primary care physician (PCP) workforce in many
industrialized nations is increasingly female. In recent
decades, the proportion of PCPs who are women has
doubled or nearly doubled, often outpacing non-primary
care specialties in these industrialized countries.
36,37
Family Practice
Female Male
Geriatrics
General Practice
Internal Medicine
Pediatrics
All Primary Care Physicians
65%53%
46%
39%
26%
35%
47%
54%
61%
74%
Number of Graduates from Primary Care Residencies
The number of graduates from primary care residency
training programs peaked in the late 1990s and
subsequently declined for the next decade (Figure 4).
There appears to be a growth in the number of graduates
in recent years, though there is a long lag period after
Figure 4. Primary Care Physicians by Year of Residency Graduation, 1980-2015
Source: American Medical Association (AMA) Physician Masterle, 2019
5K
1980-1989 1990-1999 2000-2009 2010-2015
6K
7K
8K
9K
10K
42% 58%
There is an increasing balance by gender across most
of the primary care disciplines, and as of 2019, a majority
of pediatricians, geriatricians, and nurse practitioners
are women (Figure 3).
completion of training before a physician’s practice
specialty or location is certain. Data sources, such
as the AMA Physician Masterle, reect this period
of uncertainty for recent residency graduates.
Primary Care in the United States 132. First Contact

Where is Primary Care Provided?
Over a hundred years ago, Abraham Flexner noted the
disproportionate geographic distribution of physicians
38
–
an enduring access problem re-emphasized in numerous
federal agency reports and expert panels in recent decades.
According to the Organisation for Economic Co-operation
and Development (OECD), the number of physicians per
1,000 residents in the United States is slightly lower than
the average in other similarly developed OECD countries —
2.6 for the United States compared to the OECD average of
3.5.
39
However, signicant state-level variation exists within
the United States.
40
Compared to any other specialty group, family physicians,
primary care nurse practitioners, and primary care
physician assistants are more likely to provide care in rural
and remote areas. The number of providers at practice
sites also varies signicantly, but as recently as 2016, the
majority of clinic sites have ve or fewer providers.
41
Ratios of Primary Care Professionals to Population
There are 223.1 physicians per 100,000 persons in the
United States. Of those, nearly one-third (70/223.1) are
primary care physicians (Table 3). There are 111.7 primary
care providers overall per 100,000 population, including
physicians, physician assistants, and nurse practitioners.
This translates to one primary care physician for about
every 1,429 people in the United States, and one primary
care professional for every 895 people.
28,42,43
There are substantial variations across the primary
care specialties and professions. Pediatric and geriatric
physician ratios are adjusted for the appropriate
population ages. Physician assistant and nurse
practitioner ratios are considerably higher because of
the smaller number of professionals. Table 3 shows both
the number of health care professionals per 100,000
population and the ratio of persons per provider.
28,42,43
Table 3. Primary Care Professionals
per 100,000 Population by Specialty, 2019
Specialty Providers
per 100,000
Persons
per Provider
Family Medicine 27.8 3,594
General Practice 1.7 58,643
General Internal Medicine 24.1 4,142
Geriatrics* 8.6 11,664
General Pediatrics
+
66.5 1,503
Primary Care Nurse
Practitioners
28.8 3,470
Primary Care Physician
Assistants
12.9 7,754
All Primary Care Physicians 70.0 1,429
All Primary Care Providers 111.7 895
All Physicians 223.1 448
Sources:
American Medical Association (AMA) Physician Masterle, 2019 (Physicians)
Medicare Provider Enrollment, Chain, and Ownership System (PECOS),
2020 (NP/PA)
United States Census Bureau, 2018 population estimates
*Population: Persons over age 65
+Population: Persons under age 18
Primary Care in the United States 142. First Contact

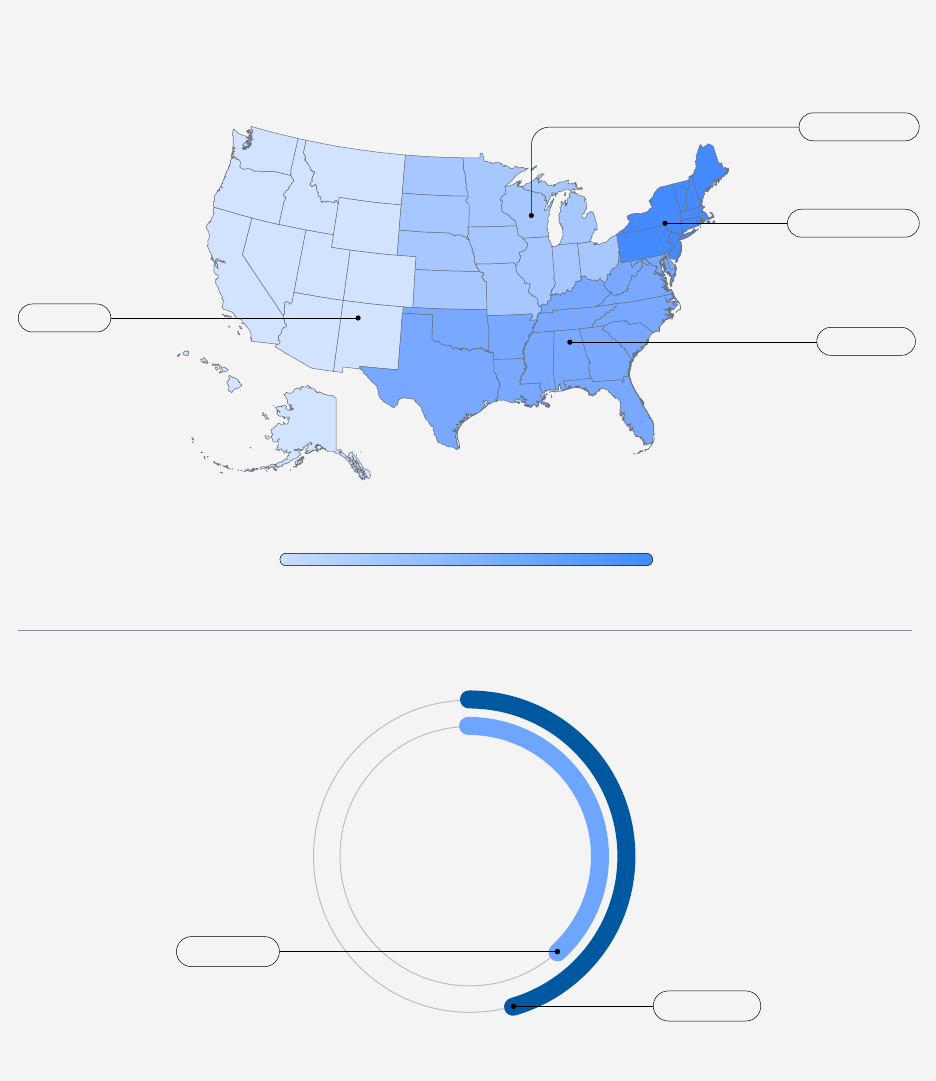
Primary Care Physician to Population Ratios by State
The number of primary care physicians per 100,000
population varies signicantly by state (Figure 5).
Mississippi has the lowest, with 49.1, and Vermont the
highest, with 103.9 primary care physicians per 100,000
people. The District of Columbia has an even higher
physician-to-population ratio of 130.7. The Northeast,
Northwest, and northern Midwest regions have the highest
ratios of primary care physicians per population.
28
Source: American Medical Association (AMA) Physician Masterle, 2019;
United States Census Bureau, 2019 population estimates
44
MS
NV
UT
TX
OK
KY
AL
ID
AZ
GA
SC
IN
LA
AR
TN
MO
NC
FL
WY
IA
NM
OH
NE
DE
VA
KS
49.1
52.6
52.7
55.5
56.1
58.3
58,6
58.9
60.0
60.1
60.6
60.6
61.7
62.7
63.2
64.4
64.5
66.0
66.3
67.4
68.9
69.0
69.1
69.2
69.5
69.6
69.7
70.8
71.1
72.1
72.4
72.5
73.0
73.4
74.1
74.9
75.1
75.2
75.4
77.0
79.3
80.8
82.4
84.5
85.2
88.7
89.0
91.0
91.3
100.3
103.9
130.7
ND
MI
SD
IL
CA
WI
PA
WV
CT
MT
CO
NJ
NY
WA
MD
MN
NH
OR
HI
RI
PR
MA
AK
ME
VT
DC
Figure 5. Primary Care Physicians per 100,000 Population by State, 2019
Primary Care in the United States 152. First Contact

Figure 6. Primary Care Physicians by Employment Status
Source: National Ambulatory Medical Care Survey (NAMCS), 2016
Primary Care Physicians by Rural/Urban Geography
Table 4 shows that primary care physicians are better
represented in rural areas than specialist physicians.
Among primary care physicians, family physicians and
general practice physicians are more highly concentrated
Owner, physician practice
Owner, insurance company or health plan, HMO, or other
Employee, physician owned practice
Employee, not physician owned practice
Contractor
4%
1%
48%
16%
32%
in rural areas compared to geriatricians, internists, and
pediatricians. Conversely, geriatricians, internists, and
pediatricians are as highly concentrated in urban areas as
specialist physicians.
Table 4. Primary Care Physicians by Rural-Urban Commuting Area (RUCA) Designation
Rural
Status
Percent
of U.S.
Population
Non-Primary
Care
Primary
Care
Family
Medicine
Geriatrics General
Practice
Internal
Medicine
Pediatrics
Urban 84.2% 95.1% 91.8% 87.6% 95.9% 87.6% 94.7% 95.1%
Large Rural 8.7% 3.3% 4.5% 6.2% 2.3% 5.8% 3.3% 3.2%
Small Rural 4.1% 0.9% 2.2% 3.8% 0.9% 3.6% 1.1% 1.0%
Isolated Rural 3.0% 0.4% 1.1% 2.1% 0.6% 2.3% 0.5% 0.4%
Sources: American Medical Association (AMA) Physician Masterle, 2019
American Community Survey (ACS), 5-Year Summary File, 2014-2018 population estimates
45
Rural-Urban Commuting Area (RUCA) Codes
46
Primary Care Practices by Ownership
Some primary care physicians own their practices,
while others work as employees of another physician,
as employees in non-physician owned practices, or as
independent contractors (Figure 6). The majority of
primary care ofces are owned by a physician or physician
group. Nearly half (48%) of primary care physicians are
full or partial owners of their practices, which is a decline
compared to our previous calculation.
47
Conversely, the
other half (48%) of primary care physicians belong to a
rapidly growing cohort of employed physicians. Of the
48% employed primary care physicians, two-thirds work
in non-physician owned practices while one-third work in
physician owned practices. A small percentage of primary
care physicians (4%) are independent contractors.
Primary Care in the United States 162. First Contact

Figure 7. Distribution of Primary Care Physicians
in Non-Physician Owned Practices
Source: National Ambulatory Medical Care Survey (NAMCS), 2016
Of the primary care physicians who work in non-physician
owned practices, half (50%) are in practices owned
by insurers, health plans, HMOs, or other corporate
entities. Approximately 47% are in medical, academic, or
community health centers (Figure 7).
Medical/academic health center;
Community health center; other hospital
Insurance company, health plan, or HMO;
other health corporation; other
Other
3%
47%
50%
Primary Care in the United States 172. First Contact

III. Continuity
Primary Care in the United States 18

Who Visits Primary Care Practices?
In 2016, Americans made nearly 900 million visits to ofce-based
physicians with almost half of those visits made to primary care
physicians.
48
As previously discussed, many Americans also seek
primary care services from nurse practitioners and physician
assistants, though their scope of practice varies by state and by practice
site. The benets to populations that establish a relationship with
primary care are numerous in the literature. Consistently, studies show
a link between having a primary care provider and improved patient
health outcomes with a simultaneous reduction in overall cost for health
care services and utilization.
49,50
Ofce Visits to Physicians by Specialty
The largest number of ofce-based primary care physician
visits (over 200 million) were to family medicine or general
practice physicians (Table 5). Visits to general pediatricians
and general internists represent the second and third-most
visited primary care specialties, with more than 207 million
combined visits.
Table 5. Physician Ofce Visits by Specialty
Physician Specialty Number of Visits Percent of Visits
General and
Family Medicine
202,494,171 22.9%
Internal Medicine 81,700,886 9.2%
Pediatrics 126,063,214 14.3%
All Primary Care 410,258,271 46.4%
Other Medical
Specialties
238,945,991 27.0%
Surgical Specialties 234,520,916 26.5%
All Visits 883,725,178 100.0%
Primary Care in the United States 193. Continuity

Figure 8 shows the proportion of ofce visits to primary
care physicians and specialists compared to each
specialty’s percentage of total workforce.
Figure 8. Visits to Ofce-Based Physicians by Specialty
Outpatient Visits to Primary Care Physicians by Patient Age and Sex
The number of visits to primary care physicians varies
by age and sex (Figure 9). According to the Medical
Expenditure Panel Survey (MEPS),
51
which provides
nationally representative information about all health
services in the United States, the youngest (< 1 year) and
oldest patients (75+ years) tend to visit primary care
0%
0
1
2
3
4
General and
Family Medicine
Internal Medicine Pediatrics All Primary Care All Other
Specialties
10%
20%
30%
50%
40%
60%
0 1-4 5-9 10-14 15-17 18-24 25-29 20-54 55-64 65-74 75+
Female
Male
Percent of Visits
Percent of Workforce
Source: National Ambulatory
Medical Care Survey (NAMCS), 2016
Figure 9. Primary Care Ofce Visits by Age and Sex, 2017
Source: Medical Expenditure Panel Survey (MEPS), 2017
offices most frequently. The youngest age group averages
nearly 4 visits per year; older age groups average 2.5 to
3 visits per year. Across all age groups, females have a
higher mean number of primary care office visits (1.47)
per year than males (1.24).
Primary Care in the United States 203. Continuity

IV. Comprehensiveness
Primary Care in the United States 21

Primary Care Physicians’ Scope of Practice
Primary care physicians continue to care for the broadest
range of conditions and illnesses among the physician
specialties. One lens on the scope of physician practice
is the distribution of the diagnosis codes in their billing
for services rendered. The number of diagnosis codes
used by primary care physicians is broader than that of
non-primary care physicians, whose diagnosis codes
What Medical Conditions do Primary Care Physicians Address?
Primary care physicians care for patients of all ages and with a broad
range of acute and chronic physical and psychological conditions,
including multiple chronic conditions. Primary care physicians also
deliver clinical preventive services, provide patient education, and
perform procedures from minor (e.g. skin biopsy) to major (labor and
delivery). Comprehensive care delivers better clinical outcomes for
patients and lowers overall health spending for the health system.
52
Figure 10. Scope of Practice by Number of ICD-10 Diagnosis Codes
for Primary Care and Selected Physician Specialties
Source: National Ambulatory Medical Care Survey (NAMCS), 2016
General/family practice
Internal medicine
Pediatrics
Otolaryngology
Obstetrics and gynecology
Dermatology
Orthopedic surgery
Neurology
General surgery
Ophthalmology
Urology
Cardiovascular diseases
Psychiatry
200 400 600 800 1,0000
cluster around the organs or illnesses of their specialty.
Figure 10 indicates the number of unique International
Classication of Disease, Tenth Revision (ICD-10) diagnosis
codes by primary care and selected specialties. Primary
care physicians treat a wide range of conditions along the
spectrum of ICD-classied conditions.
Primary Care in the United States 224. Comprehensiveness

Primary Care for Patients with Chronic Conditions
Chronic conditions are prolonged in duration. They
include hypertension, arthritis, diabetes, heart disease,
and asthma. Today, six of every ten adults in the United
States have at least one chronic condition.
53
Primary care
physicians care for a large portion of patients with chronic
diseases. Primary care nurse practitioners and physician
assistants see patients with these chronic diseases as
well. However, data about the care they provide are not
easily accessible. Within a group of eight common chronic
diseases, primary care physicians see a large proportion of
patients with these conditions (Table 6). For example, 61
million Americans with high blood pressure sought care in
2017 and 81% of them visited a primary care physician.
More people with hypertension, diabetes, and asthma visit
a primary care physician each year than visit a specialist
for treatment of these conditions. Even people with less
common, severe chronic diseases, such as Parkinson’s
disease, generally see a primary care physician each year,
in addition to seeing a specialist, such as a neurologist.
Changes in Primary Care Scope of Practice
Scope of practice is changing across the primary care
disciplines, none so dramatically perhaps as in family
medicine. As the gures above and below reects, family
physicians are increasingly likely to care for complex,
multimorbid patients in the outpatient and community
setting, and less likely to report care in a hospital setting
they once commonly tread. Similar trends have been
observed in other settings of care for family physicians
– e.g. prenatal care, home visits, nursing home care, and
obstetric care.
54
Not all of these trends reect trainee intent,
and early studies linking broader scope to positive policy
outcomes and lower burnout suggest the need for further
research on the impact that shifting scope may have on
patients and health systems.
55
Condition Total
Patients
Saw Primary
Care Physician
Saw Subspecialist
Hypertension 61,329,148 49,859,952 81% 44,001,040 72%
Arthritis 27,601,748 22,029,728 80% 22,303,648 81%
Diabetes 24,984,656 20,862,664 84% 18,365,792 74%
Asthma 19,485,934 15,721,782 81% 12,798,045 66%
Glaucoma 4,838,642 3,880,411 80% 4,555,869 94%
Macular Degeneration 2,724,906 2,212,159 81% 2,603,656 96%
Congestive Heart Failure 1,797,097 1,440,255 80% 1,545,735 86%
Parkinson's 598,042 514,940 86% 506,450 85%
Source: Medical Expenditure Panel Survey (MEPS), 2017
Table 6. Patients with Chronic Conditions Who Visited or Talked to a Physician, 2017
Table 7. Family Physicians’ Self-Reported Provision of Inpatient Care, 2013-2018
Year of Survey 2013 2014 2015 2016 2017* 2018*
Total FPs surveyed 10,673 10,064 8,464 8,886 8,675 8,727
FPs reporting inpatient care 3,637 3,386 2,551 2,551 2,182 2,091
Share of FPs reporting inpatient care 34.1% 33.6% 30.9% 28.7% 25.2% 23.9%
Source: American Board of Family Medicine (ABFM) Demographic Survey, 2013-2018.
FP: family physician. Sample restricted to FPs in direct patient care
*In 2017 and 2018, ABFM Diplomates were asked whether they provided “adult inpatient care” instead of “inpatient care” in the previous years.
Primary Care in the United States 234. Comprehensiveness

V. Coordination
Primary Care in the United States 24

Figure 11. Percentage of Family Physicians Reporting Having a Care Coordinator at Their Primary Practice,
by Practice Size and Patient-Centered Medical Home (PCMH) Status
How Does Care Coordination Function in Primary Care
According to the Institute of Medicine, “primary care is the provision
of integrated, accessible health care services by clinicians who are
accountable for addressing a large majority of personal health care
needs, developing a sustained partnership with patients, and practicing
in the context of family and community.”
56
A model encompassing this
type of care is known as the Patient Centered Medical Home (PCMH),
originally introduced by the American Academy of Pediatrics in 1967
and re-energized through accreditation programs in 2008. PCMH
has since focused on activities of care coordination, enhanced access
and payment reform.
57
Several primary care practices in the United
States have adopted the PCMH model and in so doing have been able to
increase their coordination capabilities (Figure 11).
58
Source: American Board of Family Medicine (ABFM) Recertication Examination Application Survey, 2016
0%
10%
20%
30%
70%
50%
90%
40%
80%
60%
100%
Solo Small
(2-5 Providers)
Medium
(6-20 Providers)
Large
(>20 Providers)
PCMH = Yes (N=716)
PCMH = No (N=1,241)
Primary Care in the United States 255. Coordination

Table 8. Percent Family Physicians Working Alongside Other Health Care Providers by Year
Provider 2014
(N=10,836)
2015
(N=9,198)
2016
(N=9,780)
2017
(N=8,161)
2018
(N=8,026)
Nurse Practitioner* 54.0 55.9 59.9 53.7 55.9
Registered Nurse* 47.0 48.7 49.8 53.5 53.8
Physician Assistant* 41.3 42.8 44.3 41.6 42.5
Licensed Practical Nurse* 34.5 35.1 37.1 49.7 49.3
Clinical pharmacist* 21.7 22.9 24.8 24.9 25.8
Behavior Specialist* 21.2 22.7 24.2 24.5 26.3
Social Worker* 20.9 22.0 24.6 24.0 26.3
PT/OT 14.8 16.4 17.5 14.5 14.4
Psychiatrist 12.1 12.5 14.2 13.1 13.1
Midwife 4.6 4.0 4.3 4.6 5.0
Reproduced by permission of the American Board of Family Medicine (ABFM)
Source: 2014, 2015, 2016, 2017, and 2018 ABFM Recertication Examination Application Surveys.
PT, physical therapist; OT, occupational therapist.
* Signicant to the P < .001.
Primary care, more than any other specialty, is uniquely
suited to coordinate care in a way that meets the needs of
the people it serves. Indeed, there are various health care
providers whose roles in primary care clinics improve the
overall health and welfare of patients through meeting
multifaceted needs, including but not limited to the realm
of social work, behavioral health, physical therapy, and
clinical pharmacy. Furthermore, collaboration between
family physicians and other health care providers appears
to be on the rise (Table 8).
59
Primary Care in the United States 265. Coordination

VI. Cost
Primary Care in the United States 27

How Much Do We Spend on Primary Care?
According to the Centers for Medicare & Medicaid Services (CMS),
total health care spending in the United States reached $3.6 trillion
in 2018.
60
Despite being the largest specialty in the U.S. health system,
primary care accounts for a mere 5-7% of total health care spending.
61
This investment pales in comparison to other developed nations who
average 14% of their total health care spending on primary care.
62
As the
United States evaluates its primary care investment, the Primary Care
Spend model (Figure 12) may be a useful tool – a framework appraising
primary care resource allocation and prioritization in the context of a
system’s overall health budget, while simultaneously acknowledging the
complex multifaceted components of primary care.
63
Figure 12. The Constituent Components of the Primary Care Spend Model
Reprinted with permission. © (2019). BMJ. All rights reserved. Adapted by permission from BMJ Publishing Group Limited. [publication title, author, volume number,
pagenumbers, copyright notice year]
Spending on primary care provided
within the context of the 4Cs (rst
contact, continuous, comprehensive,
& coordinated care)
Spending on the provision
of primary care services delivered
by primary care professionals
Spending on essential
primare care services
Total primary care spend
Total Healthcare spending
Primary Care in the United States 286. Cost

Expenditures for Primary Care
According to the Medical Expenditure Panel Survey
(MEPS), which captures household expense data for non-
institutionalized populations in the United States, ofce-
based primary care accounted for only ve percent of
total health expenditures in 2017 (Table 9). Furthermore,
Americans spent three times more on ofce-based
specialist services than primary care services.
Table 9. Expenditures on Health Care by Service Type
Services Total Expenses (In Millions) Percent of Total
Primary care, ofce-based $91,663 5.3%
Specialist, ofce-based $273,565 15.9%
Non-physician, ofce-based $211,999 12.3%
Emergency room $64,153 3.7%
Prescriptions $409,409 23.8%
Home Health $96,959 5.6%
Dental $106,156 6.2%
Inpatient $422,364 24.5%
Vision $17,943 1.0%
Other $28,918 1.7%
Total $1,723,130 100.0%
Source: Medical Expenditure Panel Survey (MEPS), 2017.
Note: Ofce-based and outpatient expenditures consist of facility and physician expenses for all ofce-based and outpatient visits.
‘Other’ includes expenditures on medical equipment and services.
Primary Care in the United States 296. Cost

Trends in Compensation for Primary Care Providers
While physician compensation has steadily increased in
recent years, primary care physicians continue to earn
much less than their specialist counterparts.
65
The 2020
Provider Compensation and Production Report from the
Medical Group Management Association (MGMA) revealed
that primary care physicians earned a median total
compensation of $273,437 in 2019, compared to $448,353
for specialist physicians.
66
Notably, however, was the rise
in median primary care physician compensation (10.46%)
outpacing that of specialist physicians (7.78%) between
2014 and 2018.
67
Perhaps more striking was a 12% rise in
family medicine physician median compensation, despite
little change to ‘work relative value units’ (wRVU) – a
measure of clinical productivity – over the same period.
This incongruent relationship between productivity and
compensation exposes the potential for two broader trends:
(1) a growing recognition of the primary care workforce
shortage that has made primary care physicians a valuable
commodity in a competitive market, and (2) the rise in
value-based incentives that has shifted the calculus for
physician compensation from volume (fee-for service) to
quality that primary care provides.
68
Additional factors that
inuence compensation include specialty, practice setting
(academic vs. private practice), and geographic location.
more than half of their patients have commercial insurance.
Internists care for a large number of elderly patients,
which is reected in the high percentage of patients who
participate in Medicare. General pediatricians see a larger
percentage of children, which is reected in the high
percentage of patients who participate in Medicaid.
64
Figure 13. Primary Care Payment Sources, 2014
Source: Medical Group Management Association (MGMA), Cost and Revenue Survey, 2015
Primary Care Payment Sources
The proportion of care provided for patients using public
health insurance (Medicare and Medicaid) varies among
the three major primary care specialties: family medicine,
internal medicine, and pediatrics (Figure 13). This is largely
reective of the age ranges of the patients that different
primary care specialists treat. For all three specialties,
0%
10%
20%
30%
70%
50%
40%
60%
Family Medicine
Internal Medicine
Pediatrics
Medicare Medicaid Commercial Self-Pay Other
Primary Care in the United States 306. Cost

VII. Preventive Care Visits
Primary Care in the United States 31
Why Preventive Care Visits?
A cornerstone of primary care practice is the delivery of preventive
care where the consistent delivery of preventive care services
contributes to the fundamental medical practice components of the
quadruple aim. In particular, major contributions include improving
the health of people and population, and reducing health care cost.
69,70,71
To promote utilization, the 2010 Affordable Care Act (ACA) enacted
into law the provision for preventive care services to be covered by
insurances at no cost to patients.
72
However, recently, the U.S. has failed
to reach the 4 goals for clinical preventive care set out by Health People
2020 (which, for 2019, included colorectal screening, blood pressure
and blood glucose control, and childhood immunizations).
73
Even in
commercially insured individuals, which is 55% of the U.S. population
74
and the largest source of revenue for primary care practices,
75
recommended preventive care is not received by all.
76,77
The relationship that a patient has with their primary care provider
and primary care organization has a great impact on mitigating their
individual health risks and is associated with greater adherence to
preventive care services.
78,79
These services are typically addressed
with patients during physician ofce encounters, and for both
children, and adults, these visits are expected to be billed as preventive
medicine encounters according to CPT
®
terminology.
80,81
This report
denes the set of preventive medicine encounters as Preventive
Care Visits (PCV) and describes the utilization of PCVs using the IBM
®
MarketScan
®
Commercial Research Database, which is a large sample
of a commercially insured population and their dependents in the
U.S.
82
This report focuses primarily on PCV utilization, which is dened
as the proportion of individuals who had at least one PCV within a given
year, as well as the trend of utilization from 2008 to 2018. In particular,
for the year of 2018, PCV utilization is stratied by individual patient
factors that may inuence the consumption of or access to medical
care and include age, sex, U.S. region of residence, and insurance
plan type.
83,84,85
Primary Care in the United States 327. Preventive Care Visits

Figure 14. Trend of Preventive Care Visit Utilization, 2008–2018
Source: IBM Marketscan, 2008-2018
Trend of Preventive Care Visit Utilization
From 2008 to 2018, the number of outpatient encounters
billed as preventive care visits steadily increased from 30%
in 2008 to 44% in 2018, through the transition stages of the
ACA legislation.
2008
50%
45%
40%
35%
30%
25%
20%
Preventive Care Visit Utilization
Year
2009 2010 2011 2012 2013 2014 2015 2016 2017 2018
Primary Care in the United States 337. Preventive Care Visits

Preventive Care Visit Utilization,
Stratied by Age and Sex
In 2018, females have a higher proportion of preventive
care visits when compared against males, by 53% vs
36%, respectively. From age 15 to 64 years, women have
consistently higher PCV utilization when compared against
men. In particular, the preventive care visit utilization for
females aged 18-24 (41%), 25-39 (47%), 40-54 (53%) and
55-64 (52%) years were higher than for males in those age
groups (18%, 21%, 30%, 37%, respectively). With regard to
age, PCV utilization were higher with children than adults.
Proportions were particularly high (above 80%), in the rst
year of life and in years 1-4.
The proportion for children with age ranges 5-9 years and
10-14 years were around 60% across the board for males
and females. The lowest PCV utilization was in males and
females at ages 18-24, with results for females still over
twice as high as males, 41% vs 18%, respectively. The PCV
utilization begins to uptick after the age group of 18-24
years, reaching the highest post-adolescent rates of 53% for
females at 40-54 years and 37% for males at 55-64 years.
Table 10. Preventive Care Visit Utilization, Stratied by Age and Sex
Age Group (in years) Overall Female Male
0 86.34% 86.38% 86.29%
1-4 84.06% 83.81% 84.31%
5-9 63.43% 62.98% 63.86%
10-14 60.49% 60.39% 60.59%
15-17 51.30% 53.13% 49.58%
18-24 28.88% 41.16% 17.51%
25-39 34.01% 47.14% 20.80%
40-54 41.54% 52.72% 29.93%
55-64 44.84% 51.74% 37.47%
Source: IBM Marketscan, 2018
Figure 15. Preventive Care Visit Utilization, Stratied by Age and Sex, 2018
Source: IBM Marketscan, 2018
0 1-4 5-9 10-14 15-17 18-24 25-39 40-54 55-64
Female
Male
Preventive Care Visit Utilization
Age Group ( Years)
0%
10%
20%
30%
40%
50%
60%
70%
80%
90%
100%
Primary Care in the United States 347. Preventive Care Visits
Preventive Care Visit Utilization, Regional Distribution
In 2018, the PCV utilization by U.S. geographical regions
were 43% for the South, 38% for the West, 45% for the
Midwest, and 53% for the Northeast. Also, the rates were
higher for urban (45%) regions than for rural (35%) regions.
West: 38%
U.S. Census Geographical Regions
Rural vs Urban, U.S.
38% 53%
Midwest: 45%
South: 43%
Urban: 45%
Rural: 35%
Northeast: 53%
Preventive care
visit ultilization (%)
Source: IBM Marketscan, 2018
Figure 16. Preventive Care Visit Utilization, by U.S. Region, 2018
Primary Care in the United States 357. Preventive Care Visits

Source: IBM Marketscan, 2018
Preventive Care Visit Utilization, by Health Plan
The health plans types that are billing for PCVs within
this database include point of service (POS) plan with
capitation, high deductible plans, consumer-driven health
plan (CDHP), POS, exclusive provider organization (EPO),
preferred provider organization (PPO), health maintenance
organization (HMO), and fee-for-service (FFS).
POS with
capitation
High
deductible
CDHP POS EPO PPO HMO FFS
Preventive Care Visit Utilization
Health Plan
0%
10%
20%
30%
40%
50%
60%
In 2018, preventive care visit utilization by health
insurance plan ranged from 40% to 48%. PCV rates were
higher for the POS with capitation plan (48%) and lowest
for the fee for service plan (40%) when compared to other
health plans.
Figure 17. Preventive Care Visit Utilization, by Health Plan, 2018
Primary Care in the United States 367. Preventive Care Visits

Patients with Preventive Care Visits, Primary Care
and Non-Primary Care Providers
Primary care providers billing for PCV encounters
encompass physicians in family practice, internal
medicine, pediatrics, and obstetrics and gynecology, as
well as nurse practitioners (NP) and physician assistants
(PA) in primary care. Non-primary care providers were
also included (e.g., endocrinologist, cardiologist) if they
billed for preventive care visits. We included geriatricians
to be complete, but as our cohort does not include patients
65 years and older, there were not many PCVs billed
by geriatricians (about 0.05%) in this report. Provider
types/specialties were derived from the claims-based
classications of the provider who billed the service.
A total of 71,558,728 patients had preventive care visits
in 2018. Family practice and pediatricians saw the largest
number of patients for preventive care visits, accounting
for 27% and 26% of the total number of all patients who
had preventive care visits, respectively. With regard to
non-physician providers, NP had 3% and PA had 1% of all
patients who had preventive care visits. Family practice,
internal medicine, pediatrician, geriatric medicine,
nurse practitioner, physician assistant, obstetrics and
gynecology accounted for approximately 95% of all
patients who had preventive care visits. Non-preventive
care provider or other type of practitioner accounted for
14% of the total number of patients who had preventive
care visits. (Provider type % sum can be greater than
100% because beneciaries can have more than one
preventive care visit per year.)
Figure 18. Distribution of Patients with Preventative Care Visits Across Provider Types, 2018
Source: IBM Marketscan, 2018
Family Practice Pediatrics Obstetric &
Gynecology
Internal Medicine Non-Primary
Care Provider
Nurse Practicioner/
Physician Assistant
Proportions of Patients with
Preventative Care Visits
Provider Type
0%
5%
10%
15%
20%
25%
30%
Primary Care in the United States 377. Preventive Care Visits

Trend of Average Total Cost
of Preventive Care Visit Utilization
The PCV costs reect the total payments made by the health
plan and the patient, including out-of-pocket costs, after
any contractual discounts. The average total cost for PCVs
per member per year (PMPY) for 2018 was $182. When
compared to the average total cost for PCV PMPY in 2008
of $160, there was an increase of 14% over the timespan.
Figure 19. Trend of Average Total Cost of Preventive Care Visits, 2008–2018
Source: IBM Marketscan, 2018
The average annual PCV cost increase is approximately
1% over those 10 years and after adjusting for the 2018
consumer price index for medical care. By U.S. Census
region, the average total costs of PCV PMPY for 2018 are
$181 for the Midwest, $198 for the Northeast, $162 for
the South and $202 for the West.
Year
2008 2009 2010 2011 2012 2013 2014 2015 2016 2017 2018
$145
$150
$155
$160
$165
$170
$175
$180
$185
Average Total Preventive Care Visit Cost
(per member per year)
Primary Care in the United States 387. Preventive Care Visits
VIII. References
1. World Health Organization. Coronavirus Disease (COVID-19) Situation Report - 174. 2020.
https://www.who.int/docs/default-source/coronaviruse/situation-reports/20200712-covid-
19-sitrep-174.pdf?sfvrsn=5d1c1b2c_2. Accessed July 13, 2020.
2. Centers for Disease Control and Prevention. Coronavirus Disease 2019: Cases in the U.S.
Published Aug 3, 2020. https://www.cdc.gov/coronavirus/2019-ncov/cases-updates/cases-
in-us.html. Accessed Aug 4, 2020.
3. Excess Deaths Associated with COVID-19. https://www.cdc.gov/nchs/nvss/vsrr/covid19/
excess_deaths.html. Accessed August 5, 2020
4. The need to atten the 4 curves of COVID-19. https://www.ibm.com/blogs/watson-health/
atten-the-curves-of-covid-19/ Accessed August 5, 2020
5. Rubin R. COVID-19’s Crushing Effects on Medical Practices, Some of Which Might Not
Survive. JAMA. 2020;324(4):321–323. doi:10.1001/jama.2020.11254
6. Torales J, O’Higgins M, Castaldelli-Maia JM, Ventriglio A. The outbreak of COVID-19
coronavirus and its impact on global mental health. Int J Soc Psychiatry. 2020;66(4):317-
320. doi:10.1177/0020764020915212
7. COVID-19 is affecting Black, Indigenous, Latinx, and other people of color the most. https://
covidtracking.com/race. Accessed August 5, 2020
8. Provisional Drug Overdose Death Counts. https://www.cdc.gov/nchs/nvss/vsrr/drug-
overdose-data.htm. Accessed August 5, 2020
9. Provisional Death Counts for Coronavirus Disease 2019 (COVID-19) https://www.cdc.gov/
nchs/nvss/vsrr/covid19/health_disparities.htm. Accessed August 5, 2020
10. Kanter GP, Segal AG, Groeneveld PW. Income Disparities In Access To Critical Care Services.
Health Aff (Millwood). 2020;39(8):1362-1367. doi:10.1377/hlthaff.2020.00581
11. Primary Care Collaborative. Quick COVID-19 Primary Care Survey: Series 15, Fielded June
26-29, 2020. https://static1.squarespace.com/static/5d7ff8184cf0e01e4566cb02/t/5efcd6
35282fcf7d1f1282ff/1593628214171/C19+Series+15+National+Executive+Summary.pdf.
Accessed July 9, 2020.
12. Moore MA, Coffman M, Jetty A, Klink K, Petterson S, Bazemore A. Family Physicians Report
Considerable Interest in, but Limited Use of, Telehealth Services. J Am Board Fam Med.
2017;30(3):320-330. doi:10.3122/jabfm.2017.03.160201.
13. Center for Connected Health Policy. Telehealth Coverage Policies in the Time of COVID-19.
Published April 30, 2020. https://www.cchpca.org/resources/covid-19-telehealth-coverage-
policies. Accessed July 13, 2020.
14. Mehrotra A, Chernew M, Linetsky D, Hatch H, Cutler D. The Impact of the COVID-19
Pandemic on Outpatient Visits: A Rebound Emerges. To the Point (blog), Commonwealth
Fund. Published May 19, 2020. https://doi.org/10.26099/ds9e-jm36. Accessed July 13, 2020.
15. Basu S, Phillips RS, Phillips R, Peterson LE, Landon BE. Primary Care Practice Finances In
The United States Amid The COVID-19 Pandemic. Health Affairs. Published online June 25,
2020:10.1377/hlthaff.2020.00794. doi:10.1377/hlthaff.2020.00794.
16. Kimball S. Doctors face pay cuts, furloughs and supply shortages as coronavirus
pushes primary care to the brink. CNBC. Published May 25, 2020. https://www.cnbc.
com/2020/05/25/coronavirus-family-doctors-face-pay-cuts-furloughs-and-supply-
shortages.html. Accessed July 16, 2020.
17. Phillips RL, Bazemore A, Baum A. The COVID-19 Tsunami: The Tide Goes Out Before It
Comes In. Health Affairs Blog. Published April 17, 2020. 10.1377/hblog20200415.293535.
Accessed July 8, 2020.
18. Centers for Disease Control and Prevention. Coronavirus Disease 2019: Racial and Ethnic
Minority Groups. Published February 11, 2020. https://www.cdc.gov/coronavirus/2019-
ncov/need-extra-precautions/racial-ethnic-minorities.html. Accessed July 16, 2020.
19. Nania R. Blacks, Hispanics Hit Harder by the Coronavirus, Early U.S. Data Show. AARP.
Published May 8, 2020. http://www.aarp.org/health/conditions-treatments/info-2020/
minority-communities-covid-19.html. Accessed July 16, 2020.
20. National Academy of Sciences, Engineering, and Medicine. Implementing High-Quality
Primary Care. https://www.nationalacademies.org/our-work/implementing-high-quality-
primary-care. Accessed July 27, 2020.
21. Bazemore A, Petterson S, Levin Z. Comparing Spending on Medical Care in the United States
and Other Countries. JAMA. 2018;320(8):839-839. doi:10.1001/jama.2018.8004
22. World Health Organization. The World Health Report 2000: Health Systems: Improving
Performance. Geneva, Switzerland; 2000. https://www.who.int/whr/2000/en/whr00_
en.pdf?ua=1. Accessed July 8, 2020.
23. Hartman M, Martin AB, Benson J, Catlin A. National Health Care Spending In 2018: Growth
Driven By Accelerations In Medicare And Private Insurance Spending. Health Affairs.
2019;39(1):8-17. doi:10.1377/hlthaff.2019.01451.
24. Stange KC. The Problem of Fragmentation and the Need for Integrative Solutions. Ann Fam
Med. 2009;7(2):100-103. doi:10.1370/afm.971.
25. World Health Organization. Declaration of Alma-Ata International Conference on Primary
Health Care, Alma-Ata, USSR, 6–12 September 1978; https://www.who.int/publications/
almaata_declaration_en.pdf. Accessed July 8, 2020.
26. Institute of Medicine. Primary Care: America’s Health in a New Era. Washington, DC:
National Academy Press; 1996. doi:10.17226/5152.
27. Stareld B, Shi L, Macinko J. Contribution of Primary Care to Health Systems and Health.
Milbank Quarterly. 2005;83(3):457-502. doi:10.1111/j.1468-0009.2005.00409.x
28. American Medical Association. AMA Physician Masterle. https://www.ama-assn.org/
practice-management/masterle/ama-physician-masterle. Accessed July 7, 2020.
29. Council on Graduate Medical Education. Twentieth Report: Advancing Primary Care.
Rockville, MD; 2010. https://www.hrsa.gov/sites/default/les/hrsa/advisory-committees/
graduate-medical-edu/reports/archive/2010.pdf. Accessed July 8, 2020.
30. Makaroff LA, Green LA, Petterson S, Bazemore A. Trends in Physician Supply and
Population Growth. Am Fam Physician. 2013;87(7). https://www.aafp.org/afp/2013/0401/
od3.html. Accessed July 8, 2020.
Primary Care in the United States 39
31. Dall T, Reynolds R, Jones K, Chakrabarti R, Iacobucci W. The Complexities of Physician
Supply and Demand: Projections from 2017 to 2032. Washington, DC: Prepared for the
Association of American Medical Colleges; 2019. https://aamc-black.global.ssl.fastly.net/
production/media/ler_public/31/13/3113ee5c-a038-4c16-89af-294a69826650/2019_
update_-_the_complexities_of_physician_supply_and_demand_-_projections_from_2017-
2032.pdf. Accessed July 7, 2020.
32. Colwill JM, Cultice JM, Kruse RL. Will Generalist Physician Supply Meet Demands Of An
Increasing And Aging Population? Health Affairs. 2008;27(Supplement 1):w232-w241.
doi:10.1377/hlthaff.27.3.w232.
33. National Commission on Certication of Physician Assistants, Inc. 2018 Statistical Prole
of Certied Physician Assistants: An Annual Report of the National Commission on
Certication of Physician Assistants. April 2019. http://www.nccpa.net/research. Accessed
on April 28, 2020.
34. Agency for Healthcare Research and Quality. The Number of Nurse Practitioners and
Physician Assistants Practicing Primary Care in the United States. Rockville, MD. Content
last reviewed September 2018. https://www.ahrq.gov/research/ndings/factsheets/primary/
pcwork2/index.html. Accessed on April 28, 2020.
35. American Academy of Physician Assistants. 2013 AAPA Annual Survey Report. 2014.
https://www.aapa.org/wp-content/uploads/2016/12/Annual_Server_Data_Tables-S.pdf.
Accessed July 13, 2020.
36. Organisation for Economic Co-operation and Development. Women make up most of the
health sector workers but they are under-represented in high-skilled jobs. March 2017.
Available from: https://www.oecd.org/gender/data/women-make-up-most-of-the-health-
sector-workers-but-they-are-under-represented-in-high-skilled-jobs.htm. Accessed April
28, 2020.
37. American Association of Medical Colleges. 2018 Physician Specialty Data Report:
Percentage of Active Physicians Who Are Female, 2017. https://www.aamc.org/data-reports/
workforce/interactive-data/2018-physician-specialty-report-data-highlights. Accessed July
8, 2020.
38. Flexner A. Medical education in the United States and Canada. A report to the Carnegie
Foundation for the Advancement of Teaching. The Carnegie Foundation, Bulletin Number
Four, 1910.
39. Organisation for Economic Co-operation and Development. Health at a Glance 2019: OECD
Indicators. Paris, France; 2019. https://doi.org/10.1787/b33ab4c1-en. Accessed July 8,
2020.
40. Young A, Chaudhry HJ, Pei X, Arnhart K, Dugan M, Steingard SA. FSMB Census of Licensed
Physicians in the United States, 2018. J Med Regul. 2019;105(2):7-23. doi:10.30770/2572-
1852-105.2.7.
41. Liaw WR, Jetty A, Petterson SM, Peterson LE, Bazemore AW. Solo and Small Practices: A
Vital, Diverse Part of Primary Care. Ann Fam Med. 2016;14(1):8-15. doi:10.1370/afm.1839.
42. U.S. Census Bureau, Population Division. Table 2. Cumulative Estimates of Resident
Population Change for the United States, Regions, States, and Puerto Rico and Region and
State Rankings: April 1, 2010 to July 1, 2018 (NST-EST2018-02). Released Dec 2018.
43. Centers for Medicare & Medicaid Services. Medicare Fee-For-Service Public Provider
Enrollment Data. Medicare Provider Enrollment, Chain, and Ownership System (PECOS).
https://data.cms.gov/public-provider-enrollment. Accessed July 28, 2020.
44. U.S. Census Bureau, Population Division. Table 1. Annual Estimates of the Resident
Population for the United States, Regions, States, and Puerto Rico: April 1, 2010 to July 1,
2019 (NST-EST2019-01). Released date: December 2019.
45. American Community Survey. 2014-2018 ACS 5-Year Estimates. United States Census
Bureau. https://www.census.gov/programs-surveys/acs/data/summary-le.html. Accessed
July 20, 2020.
46. Rural-Urban Commuting Area Codes. United States Department of Agriculture: Economic
Research Service. https://www.ers.usda.gov/data-products/rural-urban-commuting-area-
codes/. Accessed July 20, 2020.
47. Petterson S, McNellis R, Klink K, Meyers D, Bazemore A. The State of Primary Care in the
United States: A Chartbook of Facts and Statistics. January 2018.
48. Centers for Disease Control and Prevention. National Center for Health Statistics.
Ambulatory Health Care Data. National Ambulatory Medical Care Survey (NAMCS). 2016.
https://www.cdc.gov/nchs/ahcd/index.htm. Accessed July 8, 2020.
49. Pourat N, Davis AC, Chen X, Vrungos S, Kominski GF. In California, Primary Care Continuity
Was Associated With Reduced Emergency Department Use And Fewer Hospitalizations.
Health Affairs. 2015;34(7):1113-1120. doi:10.1377/hlthaff.2014.1165.
50. Mundt MP, Gilchrist VJ, Fleming MF, Zakletskaia LI, Tuan W-J, Beasley JW. Effects of Primary
Care Team Social Networks on Quality of Care and Costs for Patients With Cardiovascular
Disease. Ann Fam Med. 2015;13(2):139-148. doi:10.1370/afm.1754.
51. Medical Expenditure Panel Survey (MEPS). Agency for Healthcare Research and Quality.
https://meps.ahrq.gov/mepsweb/. Accessed July 20, 2020.
52. Bazemore A, Petterson S, Peterson LE, Phillips RL. More Comprehensive Care Among
Family Physicians is Associated with Lower Costs and Fewer Hospitalizations. Ann Fam
Med. 2015;13(3):206-213. doi:10.1370/afm.1787.
53. Centers for Disease Control and Prevention. National Center for Chronic Disease Prevention
and Health Promotion (NCCDPHP). Chronic Disease in America. Last reviewed October 23,
2019. https://www.cdc.gov/chronicdisease/resources/infographic/chronic-diseases.htm.
Accessed July 8, 2020.
54. Coutinho AJ, Cochrane A, Stelter K, Phillips RL, Peterson LE. Comparison of Intended
Scope of Practice for Family Medicine Residents With Reported Scope of Practice
Among Practicing Family Physicians. JAMA. 2015;314(22):2364-2372. doi:10.1001/
jama.2015.13734.
55. Weidner AKH, Phillips RL, Fang B, Peterson LE. Burnout and Scope of Practice in New
Family Physicians. Ann Fam Med. 2018;16(3):200-205. doi:10.1370/afm.2221.
56. Institute of Medicine. Dening Primary Care: An Interim Report. Washington, DC: The
National Academies Press. 1994. https://doi.org/10.17226/9153.
57. Primary Care collaborative. History: Major milestones for primary care and the medical
home. https://www.pcpcc.org/content/history-0. Accessed August 4, 2020.
58. Moore M, Peterson L, Coffman M, Jabbarpour Y. Care Coordination and Population
Management Services Are More Prevalent in Large Practices and Patient-centered Medical
Homes. J Am Board Fam Med. 2016;29(6):652-653. doi:10.3122/jabfm.2016.06.160180.
59. Jabbarpour Y, Jetty A, Dai M, Magill M, Bazemore A. The Evolving Family Medicine Team. J
Am Board Fam Med. 2020;33(4):499-501. doi:10.3122/jabfm.2020.04.190397.
60. Centers for Medicare and Medicaid Services. National Health Expenditures (NHE) Fact
Sheet. Last updated March 24, 2020. https://www.cms.gov/Research-Statistics-Data-and-
Systems/Statistics-Trends-and-Reports/NationalHealthExpendData/NHE-Fact-Sheet.
Accessed July 8, 2020.
61. Jabbarpour Y, Greiner A, Jetty A, et al. Investing in Primary Care: A State-Level Analysis.
Patient-Centered Primary Care Collaborative and the Robert Graham Center; July 2019.
https://www.graham-center.org/content/dam/rgc/documents/publications-reports/reports/
Investing-Primary-Care-State-Level-PCMH-Report.pdf. Accessed July 20, 2020.
62. Organisation for Economic Co-operation and Development. Realising the full potential of
primary health care. 2019. https://www.oecd.org/health/health-systems/OECD-Policy-Brief-
Primary-Health-Care-May-2019.pdf. Accessed July 20, 2020.
63. Baillieu R, Kidd M, Phillips R, et al. The Primary Care Spend Model: a systems approach to
measuring investment in primary care. BMJ Glob Health. 2019;4(4):e001601. doi:10.1136/
bmjgh-2019-001601
64. Medical Group Management Association (MGMA). Cost and Revenue Survey. 2015.
65. Doximity. 2019 Physician Compensation Report, Third Annual Study. March 2019.
https://s3.amazonaws.com/s3.doximity.com/press/doximity_third_annual_physician_
compensation_report_round4.pdf. Accessed July 8, 2020.
66. MGMA. New MGMA Research Finds Physician Compensation Increased in 2019. Published
May 21, 2020. https://www.mgma.com/news-insights/press/new-mgma-research-nds-
physician-compensation-inc. Accessed July 13, 2020.
67. Jaspen B. Doctor Pay Hits $266K For Primary Care, $443K For Specialists. Forbes. Published
July 12, 2019. https://www.forbes.com/sites/brucejapsen/2019/07/12/doctor-pay-hits-266k-
for-primary-care-443k-for-specialists/#71debf843bff. Accessed July 13, 2020.
Primary Care in the United States 408. References
68. PRNewswire. According to New SullivanCotter Survey Results, Physician Compensation
Programs are Evolving to Address an Increasingly Complex Operating Environment.
Published Dec 3, 2019. https://www.prnewswire.com/news-releases/according-to-new-
sullivancotter-survey-results-physician-compensation-programs-are-evolving-to-address-
an-increasingly-complex-operating-environment-300968011.html. Accessed July 13, 2020.
69. Berwick D, Nolan T, Whittington J. The Triple Aim: Care, Health, And Cost. Health Affairs.
2008;27(3):759-769. doi:10.1377/hlthaff.27.3.759.
70. Bodenheimer T, Sinsky C. From Triple to Quadruple Aim: Care of the Patient Requires Care
of the Provider. The Annals of Family Medicine. 2014;12(6):573-576. doi:10.1370/afm.1713.
71. Smith M, Saunders R, Stuckhardt L, McGinnis JM, Committee on the Learning Health
Care System in America; Institute of Medicine, eds. Best Care at Lower Cost: The Path to
Continuously Learning Health Care in America. Washington (DC): National Academies Press
(U.S.); 2013.
72. Affordable Care Act (ACA) - HealthCare.gov Glossary. HealthCare.gov. https://www.
healthcare.gov/glossary/affordable-care-act/. Published 2020. Accessed Jun 17, 2020.
73. LHI Infographic Gallery | Healthy People 2020. Healthypeople.gov. https://www.
healthypeople.gov/2020/leading-health-indicators/LHI-Infographic-Gallery#Nov-2019.
Published 2020. Accessed June 17, 2020.
74. Health Insurance Coverage of the Total Population. KFF. https://www.kff.org/other/state-
indicator/total-population/. Published 2020. Accessed Jun 17, 2020.
75. Petterson S, McNellis R, Klink K, Meyers D, Bazemore A. The State of Primary Care in the
United States: A Chartbook of Facts and Statistics. January 2018. Figure 10.
76. Child and Adolescent Well-Care Visits - NCQA. NCQA. https://www.ncqa.org/hedis/
measures/child-and-adolescent-well-care-visits/. Published 2020. Accessed June 17, 2020.
77. Colorectal Cancer Screening - NCQA. NCQA. https://www.ncqa.org/hedis/measures/
colorectal-cancer-screening/. Published 2020. Accessed June 17, 2020.
78. Ferrante J, Balasubramanian B, Hudson S, Crabtree B. Principles of the Patient-Centered
Medical Home and Preventive Services Delivery. The Annals of Family Medicine.
2010;8(2):108-116. doi:10.1370/afm.1080
79. Flocke S, Stange K, Zyzanski S. The Association of Attributes of Primary Care With the
Delivery of Clinical Preventive Services. Med Care. 1998;36(SUPPLEMENT):AS21-AS30.
doi:10.1097/00005650-199808001-00004.
80. Nordin J, Solberg L, Parker E. Adolescent Primary Care Visit Patterns. The Annals of Family
Medicine. 2010;8(6):511-516. doi:10.1370/afm.1188.
81. See Methods Appendix: Methods for Preventive Care Visit Utilization in the United States.
82. See Methods Appendix: MarketScan Commercial Database (ESI: Employer Sponsored
“Health” Insurance).
83. Babitsch B, Gohl D, von Lengerke T. Re-revisiting Andersen’s Behavioral Model of
Health Services Use: a systematic review of studies from 1998-2011. Psychosoc Med.
2012;9:Doc11. doi:10.3205/psm000089
84. Andersen R. Revisiting the Behavioral Model and Access to Medical Care: Does it Matter? J
Health Soc Behav. 1995;36(1):1. doi:10.2307/2137284.
85. See Methods Appendix: Methods for Preventive Care Visit Utilization in the United States.
Primary Care in the United States 418. References
Estimating the numbers of primary care physicians
The methods used for estimating the number of primary
care physicians are based on the 2019 American Medical
Association (AMA) Physician Masterle and described
in literature.
1
The following section describes similar
methods used to update those estimates based on the
2019 AMA Physician Masterle. Primary care physicians
were identied by selecting physicians in direct patient
care with a primary, self-designated specialty of family
medicine, general practice, general internal medicine,
general pediatrics, or geriatrics. Note that it is assumed
that physicians reporting these specialties have not further
specialized. In the AMA Masterle, physicians who rst
trained in internal medicine and then obtained further
training are not still classied in internal medicine.
Retirement: Undercounting and Correction
Due to the difculty in determining when a physician
retires, the AMA Physician Masterle undercounts
retirees. There are various ways to correct this problem.
Workforce estimates from the Association of American
Medical Colleges (AAMC)
2
or Health Resources and Services
Administration (HRSA)
3
adjust AMA counts downward
using results from a study of physicians over the age of 50,
which includes a question about retirement intentions.
The approach used in this chartbook adjusted AMA counts
based on a comparison of the age distribution of physicians
in the AMA Physician Masterle with the subset of these
physicians who could be matched in the National Plan and
Provider Enumeration System (NPPES) database.
Physician counts were decreased by 3% for those 55 to 59
years, 8.7% for those 60 to 64 years, 20.1% for those 65 to
69 years, 26.2% for those 70 to 74 years, 38.4% for those 75
to 79 years, 54.3% for those 80 to 84 years, 70.6% for those
85 to 89 years, 81.4% for those 90 to 98 years, and 100% for
those 99 years and older.
Hospitalists
A second correction made to the data is the exclusion
of physicians with a primary care specialty working as
hospitalists and those in non-primary care settings.
We used an estimate, based on work by Kuo and
colleagues, that about 20% of general internists worked
as hospitalists.
4
We used data from the American Board
of Family Medicine (ABFM) about time allocated to
different activities by board certied family physicians to
determine what percentage of those devoted 80% or more
of their time to emergency or urgent care.
5
Based on this
analysis, we assumed that about 5% of family physicians,
pediatricians, and geriatricians worked in non-primary
care settings. After these modications, our estimate of
the size of the workforce was reduced by about 27,000
(from 256,281 to 228,936). In its estimate of the size of the
primary care workforce, HRSA relied on gures from the
Society of Hospital Medicine, which estimated that there
were 28,000 hospitalists in practice in 2010.
3
HRSA made
no correction for primary-care trained physicians working
in urgent or emergency care.
Estimating the Number of Nurse Practitioners and
Physician Assistants in Primary Care
Data from the April 2020 Provider Enrollment, Chain
and Ownership System (PECOS) were used to estimate
the number of nurse practitioners (NP) and physician
assistants (PA) in primary care.
6
This data were linked
with 2017 CMS Physician and Other Supplier Public Use
File data that include information about services provided
by providers.
7
PECOS data include information about
practices (identied by the organization’s National Provider
Identiers), so it is possible, based on the physicians’
specialty, to identify both single- and multi-specialty
practices. We identied primary care practices as those
composed of family physicians, general practitioners,
general internists, pediatricians, and geriatricians.
Physicians working mainly as hospitalists (as identied
Methods Appendix
Primary Care in the United States 42
in the Physician and Other Supplier le) were reclassied
as non-primary care. All NPs/PAs practicing in a primary
care practice were assumed to be primary care. For multi-
specialty practices, it was assumed that share of NPs/PAs
in primary care mirrored the share of its physicians in
primary care.
NPs/PAs working mainly with behavioral health providers
(social workers and psychologists) were classied as
non-primary care. Based on organization type in the
PECOS data, we classied NPs/PAs working in FQHC and
rural health clinics as primary care, and those working in
skilled nursing facilities and critical access hospitals as
non-primary care. We also used the organization’s name
to identify retail clinics and reclassied their providers as
non-primary care. Finally, we used Physician and Other
Supplier to identify practices that were overwhelmingly
billing services in hospitals, emergency departments,
home health, assisted living and nursing facilities. NPs/
PAs employed by these practices were reclassied as non-
primary care. NPs/PAs that worked in practices with no
physicians or behavioral health providers and who were
not reclassied based on available data were assumed to be
practicing in primary care.
Methods for Preventive Care Visit Utilization in the
United States
The study included data from individuals with employer-
sponsored insurance coverage from the IBM MarketScan
Commercial Research Database, which includes more than
25% of all ESI beneciaries in the United States, with over
253 million unique patients.
This cross-sectional retrospective descriptive study
examined administrative claims data for members
enrolled for 12 continuous months (excluding individuals
using hospice services), aged 0-64 years in the individual
years 2008-2018, whose preventive care is managed by
family practice, internal medicine, pediatrician, geriatric
medicine, obstetrics and gynecology, nurse practitioners
and physician assistants or non-primary care providers.
Preventive care visits (PCV) were dened by outpatient
visits with Current Procedural Terminology (CPT) codes
between 99381-99386 and between 99391-99397. We
described primary care visit utilization overall and
stratied by several factors of interest including year, age,
sex, U.S. Census region, rural versus urban, primary care
provider and health plan type. PCV utilization is dened
as the proportion of PCV encounters. When stratied
by a variable, the proportion is calculated within each
factor (e.g., proportion of all women who have had a PCV
encounter, proportion of all adolescents in the age group
15-17 years who have had a PCV encounter). We also
examined the average total cost for preventive care visit per
member per year overall and by U.S. Census region. The
PCV costs reect the total payments made by the health
plan and the patient after any contractual discounts.
Commercial insurance weights were applied to the
study population data to reect the national population
of individuals with employer-sponsored insurance. The
weights were constructed using the Public Use Microdata
Sample of the American Community Survey conducted by
the United States Census Bureau. Consumer Price Index
(CPI) adjustment was applied for cost estimates to account
for rate of ination.
Primary Care in the United States 43Methods Appendix
Description of Data Sources
American Board of Family Medicine
Recertication Survey
The American Board of Family Medicine (ABFM) requires
completion of a practice demographic questionnaire
when Diplomates apply for a recertication exam. The
questionnaire collects data on “practice content and scope
of practice, practice organization and structure, presence
of other health care professionals, and use of electronic
health records.”
8
Family physicians must recertify at
regular intervals (recently changed to every 10 years),
and as such the demographic questionnaire surveys a
representative and reliable sample of recertifying family
physicians annually.
American Medical Association Physician Masterle
The AMA Physician Masterle is a proprietary data set
maintained by the American Medical Association (AMA)
that includes a near complete listing of all physicians in
the U.S. More than 1.4 million physicians, residents, and
medical students in the U.S. have current and historical
data in the AMA Physician Masterle. The AMA Physician
Masterle includes detailed information about each
individual, including their age, gender, self-reported
specialty, practice address, type of medical degree (MD
or Doctor of Osteopathic Medicine, DO), practice type,
specialty, and home address.
9
The Robert Graham Center
holds AMA Physician Masterle data for each year between
2000 and 2019 with the exception of 2003. The Robert
Graham Center geo-codes the addresses in the le (98
percent match rate) and can readily match the addresses
with other geographic data.
Centers for Medicare and Medicaid Services National
Plan and Provider Enumeration System
The Centers for Medicare & Medicaid Services (CMS)
National Plan and Provider Enumeration System (NPPES)
Downloadable File (2008-Present) is a freely available
public data set that contains rich information on health
care providers, including the National Provider Identier
(NPI), practice address, and practice arrangements.
10
The
Health Insurance Portability and Accountability Act of 1996
(HIPAA) mandated that the required identier for Medicare
services, the unique provider identication number
(UPIN), be replaced by the NPI. Other payers, including
commercial health care insurers, also use the NPI. The
NPI is a 10-position, intelligence-free numeric identier
(10-digit number). In October 2006, CMS began issuing
NPIs. By May 23, 2007, all HIPAA covered entities, such as
providers completing electronic transactions, health care
clearinghouses, and large health plans, were required to
use only the NPI to identify covered health care providers.
One of the advantages of the NPPES data is that it is not
restricted to physicians, permitting an analysis of nurse
practitioners (NPs), physician assistants (PAs), and certied
nurse midwives. The NPPES data also contain more precise
physician address information than the AMA Physician
Masterle data. A drawback of the NPPES data is the lack
of an indicator for currently active providers. Although
the NPPES data identies NPs and PAs, the data does not
include a clear identier of NPs and PAs who provide
primary care. Address information can be used to create an
identier for nurse practitioners and physician assistants
who are located with other primary care providers.
Methods AppendixPrimary Care in the United States 44
Medical Expenditure Panel Survey
The Medical Expenditure Panel Survey (MEPS) comprises
surveys of households, health care and insurance providers,
and nursing homes.
11
MEPS Household Component
(MEPS-HC) is a set of large-scale surveys of families and
individuals, their medical providers, and employers
across the U.S. The MEPS-HC survey collects nationally
representative data on demographic characteristics, health
conditions, health status, use of medical care services,
charges and payments, access to care, satisfaction with
care, health insurance coverage, income, and employment.
Interviews are conducted with one member of each family
who reports on the health care experiences for the entire
family. Starting in 1996, a new household MEPS sample
has been drawn each year from the respondents to the
National Health Interview Survey (NHIS) of the preceding
year. After a preliminary contact, that sample, or “panel” is
interviewed ve times over the next two and a half years.
Each panel represents a new sample and each round within
a panel represents interviews during one of ve, discrete,
six-month time periods. Since new panels are formed
in subsequent years, the panels overlap, increasing the
effective sample size at a given time.
12
MarketScan Commercial Database (ESI:
Employer Sponsored “Health” Insurance)
The IBM® MarketScan® Commercial Database is a medical
and pharmacy insurance claims database that includes
information on over 40 million active employees, early
retirees, and COBRA (Consolidated Omnibus Budget
Reconciliation Act) continuers and their dependents
insured by approximately 150 employer-sponsored plans.
The database contains information on enrollment and
demographic data in addition to outpatient and inpatient
services, type of health plan, and cost of services.
Medical Group Management Association
The Medical Group Management Association (MGMA) is
a for-prot agency that surveys medical professionals to
create reports mostly relating to cost or compensation
in the medical eld.
13
The Physician Compensation and
Productivity Report describes the salaries of physician and
non-physician providers. The report includes information
about specialty, geographic regions, practice settings, years
in specialty, and method of compensation. The data has
over 121,000 providers from 140 medical specialties.
14
National Ambulatory Medical Care Survey
The National Ambulatory Medical Care Survey (NAMCS)
measures physician-patient encounters to get reliable
information about ambulatory care services in the U.S.
and has been conducted annually since 1989. The survey
collects physicians’ diagnoses, patients’ symptoms,
and medications ordered or provided, as well as patient
demographics and services provided.
15
The survey is
administered by the U.S. Census Bureau for the Centers
for Disease Control and Prevention (CDC).
16
The physicians
who are interviewed must be non-federal ofce-based
physicians that are primarily engaged in direct patient care.
The survey samples 20-100% of the patient encounters a
physician has during a one-week period, depending on the
size of practice.
17
Methods AppendixPrimary Care in the United States 45
Methods Appendix
Methods Appendix References
1. Petterson SM, Liaw WR, Phillips RL, Rabin DL, Meyers DS, Bazemore AW. Projecting U.S.
Primary Care Physician Workforce Needs: 2010-2025. Ann Fam Med. 2012;10(6):503-509.
doi:10.1370/afm.1431
2. Dall T, Reynolds R, Jones K, Chakrabarti R, Iacobucci W. The Complexities of Physician
Supply and Demand: Projections from 2017 to 2032. Washington, DC: Prepared for the
Association of American Medical Colleges; 2019. https://aamc-black.global.ssl.fastly.net/
production/media/ler_public/31/13/3113ee5c-a038-4c16-89af-294a69826650/2019_
update_-_the_complexities_of_physician_supply_and_demand_-_projections_from_2017-
2032.pdf. Accessed July 7, 2020.
3. U.S. Department of Health and Human Services, Health Resources and Services
Administration, National Center for Health Workforce Analysis. Projecting the Supply
and Demand for Primary Care Practitioners Through 2020. U.S. Department of Health
and Human Services; 2013. https://bhw.hrsa.gov/sites/default/les/bhw/nchwa/
projectingprimarycare.pdf. Accessed July 7, 2020.
4. Kuo Y-F, Sharma G, Freeman JL, Goodwin JS. Growth in the Care of Older Patients by
Hospitalists in the United States. New England Journal of Medicine. 2009;360(11):1102-
1112. doi:10.1056/NEJMsa0802381.
5. Petterson S, Peterson L, Phillips RL, et al. One in Fifteen Family Physicians Principally
Provide Emergency or Urgent Care. J Am Board Fam Med. 2014;27(4):447-448. doi:10.3122/
jabfm.2014.04.130307.
6. Centers for Medicare & Medicaid Services. Medicare Fee-For-Service Public Provider
Enrollment Data. Medicare Provider Enrollment, Chain, and Ownership System (PECOS).
https://data.cms.gov/public-provider-enrollment. Accessed August 12, 2020.
7. Centers for Medicare & Medicaid Services. Medicare Provider Utilization and Payment Data:
Physician and Other Supplier. https://www.cms.gov/Research-Statistics-Data-and-Systems/
Statistics-Trends-and-Reports/Medicare-Provider-Charge-Data/Physician-and-Other-
Supplier. Accessed August 12, 2020.
8. Peterson LE, Fang B, Phillips RL, Avant R, Puffer JC. The American Board of Family
Medicine’s Data Collection Method for Tracking Their Specialty. J Am Board Fam Med.
2019;32(1):89-95. doi:10.3122/jabfm.2019.01.180138
9. American Medical Association. AMA Physician Masterle. https://www.ama-assn.org/
practice-management/masterle/ama-physician-masterle. Accessed July 7, 2020.
10. Centers for Medicare & Medicaid Services. Data Dissemination. Announcing Changes
to the National Plan and Provider Enumeration System (NPPES) Downloadable File.
https://www.cms.gov/Regulations-and-Guidance/Administrative-Simplication/
NationalProvIdentStand/DataDissemination. Accessed July 7, 2020.
11. Medical Expenditure Panel Survey Background. Agency for Healthcare Research and
Quality. https://meps.ahrq.gov/mepsweb/communication/household_participant_back.jsp.
Accessed July 7, 2020.
12. Medical Expenditure Panel Survey: MEPS-HC Panel Design and Data Collection Process.
Agency for Healthcare Research and Quality. https://www.meps.ahrq.gov/survey_comp/
hc_data_collection.jsp. Accessed July 7, 2020.
13. Medical Group Management Association. Healthcare Industry Data & Analytics. https://
www.mgma.com/data. Accessed July 7, 2020.
14. Medical Group Management Association. Physician and Provider Compensation Data.
https://www.mgma.com/data/benchmarking-data/provider-compensation-data. Accessed
July 7, 2020.
15. Centers for Disease Control and Prevention. NAMCS/NHAMCS - Ambulatory Health Care
Data. https://www.cdc.gov/nchs/ahcd/index.htm. Accessed July 7, 2020.
16. Centers for Disease Control and Prevention. NAMCS/NHAMCS - Data Collection and
Processing. https://www.cdc.gov/nchs/ahcd/ahcd_data_collection.htm. Accessed July 7,
2020.
17. Centers for Disease Control and Prevention. NAMCS/NHAMCS - Scope and Sample Design.
https://www.cdc.gov/nchs/ahcd/ahcd_scope.htm. Accessed July 7, 2020.
Primary Care in the United States 46

