
First to “Read” the News:
News Analytics and High Frequency Trading
Bastian von Beschwitz*
Federal Reserve Board
Donald B. Keim**
Wharton School
Massimo Massa***
INSEAD
October 23, 2015
Abstract
We investigate whether providers of news analytics affect the stock market. We exploit a unique
identification strategy based on revisions between different product releases of a major provider of news
analytics. We document a causal effect of news analytics on the market, irrespective of the informational
content of the news. Coverage in news analytics speeds up the market reaction in terms of stock price
response and trading volume, but temporarily increases illiquidity and can result in temporary price
distortions that might increase volatility and reduce market stability. Furthermore, we document that traders
learn dynamically about the precision of news analytics.
JEL classification: G10, G12, G14
Keywords: Liquidity, Stock Price Reaction, News Analytics, Information, High Frequency
Trading.
* Bastian von Beschwitz, Federal Reserve Board, International Finance Division, 20th Street and Constitution Avenue N.W.,
Washington, D.C. 20551, tel. +1 202 475 6330, e-mail: bastian.vo[email protected] (corresponding author).
** Donald B. Keim, Wharton School, University of Pennsylvania, Philadelphia, PA 19104; [email protected]
*** Massimo Massa, INSEAD, Finance Department, Bd de Constance, 77305 Fontainebleau Cedex, France, tel. + 33-(0)160-
724-481, email: massimo[email protected]
An earlier version of this paper was titled "Media-Driven High Frequency Trading : Evidence from News Analytics". We are
grateful to RavenPack for providing their data, and Malcolm Bain in particular for his expertise on different RavenPack releases.
Thanks also to the technical personnel at WRDS, especially Mark Keintz, for making the construction of the intraday-market
indexes possible. We thank Joseph Engelberg, Nicholas Hirschey, Todd Gormley, Markus Leippold, Joel Peress, Ryan Riordan,
Paul Tetlock, Sarah Zhang and conference participants at the NBER Microstructure Meeting, European Winter Finance Summit,
FIRS, and DGF for valuable comments. We acknowledge the financial support of the Wharton-INSEAD Center for Global
Research and Education. All remaining errors are our responsibility.
The views in this paper are solely the responsibility of the authors and should not be interpreted as reflecting the views of the
Board of Governors of the Federal Reserve System or of any other person associated with the Federal Reserve System.

1
1. Introduction
The recent decade has witnessed three major phenomena. The first has been the rise of algorithmic
and high frequency trading (HFT).
1
HFT now accounts for nearly 50% of trading volume (Gerig, 2015)
and the race for higher execution speeds has driven latency of the fastest traders down to the nanosecond
level (Gai, Yao and Ye, 2013). The second is the rise of algorithmic processing of news releases (“news
analytics”). The third is an increase in the number of “flash crashes” – i.e., sudden strong deviations of
prices from fundamentals that are quickly reversed (e.g. Brogaard et al. (2015), Golub, Keane and Poon
(2012)). This raises the question of whether there is a link between these phenomena. In particular, given
that one of the main benefits of financial markets is the aggregation of information and assimilation into
prices, which role does the information generated by algorithmic news processing play in a world
dominated by HFT?
The question is tricky as HFTs trade mainly in reaction to quotes and prices – i.e., they react to
information that is already inside the market system. In contrast, news analytics allow its users to react
faster to events that are not yet reflected in asset prices. For example, RavenPack, a major provider of news
analytics whose data we use in this study, uses computer algorithms to determine for each article in the
Dow Jones Newswire its relevance to each company mentioned in it, and whether the news story is positive
or negative. This processing is completed and then electronically delivered to RavenPack’s subscribers
within a third of a second. While this is slow compared to the speed with which HFTs can react to price
movements, news analytics companies such as RavenPack provide the fastest way to react to information
that is not yet reflected in asset prices.
In this paper, we study this phenomenon by directly focusing on how news analytics has affected the
way financial markets incorporate public information. In particular, two considerations are of interest. On
the upside, news analytics likely increase the speed with which markets incorporate information and thus
increase their efficiency. On the downside, when algorithms “read” news inaccurately, this can lead to
unintended consequences as trading programs automatically initiate trades on an incorrect assessment of
the news content. For example, in April 2013, an incorrect twitter feed about a White House explosion
caused a mini flash crash. Some quickly blamed algorithmic trading for the reaction, while others argued
that human traders were mainly responsible.
2
In any case, news reading algorithms might be more likely to
misinterpret news than human traders. This raises the question whether news analytics have contributed to
1
Throughout the paper, we will use the term HFT to refer to any kind of algorithmic trading. For example, our
definition includes hedge funds which trade algorithmically, but are not co-located.
2
See for example “The Trading Robots Really Are Reading Twitter”- http://finance.yahoo.com/news/trading-robots-
really-reading-twitter-124443495.html and “#hashcrash: The anatomy of an investment panic”
http://goinfront.com/blog/article/497
2
some of the mini flash crashes that we observe or whether these worries are unfounded. While the question
of how news analytics affect the stock market is important, especially for policy considerations, its effect
is not easy to isolate because the response to news analytics normally cannot be distinguished from the
reaction to the news itself.
In this paper, we are able to address this identification issue by exploiting a unique identification
strategy based on differences between older and newer versions of RavenPack. We use the back-filled
analytics of increasingly more sophisticated versions of Ravenpack to proxy for the informational content
of the news and we use the actual analytics of the old version – i.e., the one that was released at the time –
to proxy for the “observed” (and not necessarily correct) informational content of the news. The differences
between the old and new version enable us to study the causal impact of news analytics on stock prices.
We test the following hypotheses: First, we ask whether inaccuracies in news analytics lead to price
distortions analogous to “mini” flash crashes – i.e., whether they trigger price reactions that are
subsequently reversed (Hypothesis 1). Second, we ask whether news analytics increase the speed with
which traders react to public signals and thus the speed at which the market incorporates information,
leading to higher market efficiency (Hypothesis 2). Third, we investigate whether there is an impact on
market liquidity. We consider two competing effects of news analytics on liquidity. On the one hand, news
analytics improve information efficiency because trading on it is partially revealing (e.g., Kyle 1985). On
the other hand, news analytics also increase information asymmetry between the users of news analytics
and other traders, inducing the non-users of news analytics to reduce liquidity provision after a news release
to avoid being picked off by informed order flow (e.g. Kim and Verrecchia (1994)). If the first information
improvement effect prevails, news analytics increase liquidity (Hypothesis 3a), while if the information
asymmetry effects prevails, news analytics will decrease liquidity (Hypothesis 3b). Finally, we ask whether
high frequency traders dynamically learn about the signal precision of news analytics. If this is the case, we
expect a stronger price reaction to news analytics in stocks in which news analytics have been more
informative in the past (Hypothesis 4).
To identify the relation between news analytics and stock market behavior, we rely on the differences
between different versions of RavenPack. We focus on differences in the “relevance score”, which
measures the importance of an article for a certain company. The relevance score is very important: highly
relevant articles that are positive (negative) are followed by positive (negative) stock returns, while there is
almost no reaction to articles with a low relevance score. Differences in relevance scores between the old
and new versions are due to an improved performance of the algorithm in identifying companies in the
article and determining the article’s relevance to the company.
3
We use these differences in relevance scores to define three categories of articles: High-relevance
articles Released as High-relevance articles (HRH); Low-relevance articles Released as High-relevance
articles (LRH); and High-relevance articles Released as Low-relevance articles (HRL).
To study Hypothesis 1, we focus on LRH articles – i.e., articles that have been incorrectly labelled as
having high relevance in the old version of RavenPack. We find that these articles do indeed have a short
term impact on returns, but the effect is not persistent. The market initially overreacts to the incorrect
information, realizes the inaccuracy, and quickly corrects after 30 seconds. This price distortion is
analogous to a “mini” flash crash, thus confirming Hypothesis 1 and the causal effect of Ravenpack on
stock prices.
To test the remaining hypotheses, we focus on the comparison between HRH and HRL articles. These
two article groups are of similar relevance according to the most recent version of RavenPack, but only the
HRH articles were consistently classified, and released to the market, as highly relevant. On the other hand,
HRL articles were originally released as not relevant in the old version and thus should not affect stock
prices. Comparing the market response to HRH and HRL articles provides another way to assess the causal
effect of RavenPack.
We find that the market reacts differently to HRH and HRL articles. The share of stock price reaction
concentrated in the first 5 seconds after an article compared to the total reaction over 120 seconds is
significantly greater for articles that were released as highly relevant (HRH) than for those highly-relevant
articles that the old technology mislabelled as having low relevance (HRL). This difference in speed of the
stock price response is 1.3 percentage points or 10% relative to the mean.
Not only does the market react faster, but it also reacts in the sentiment direction indicated by
Ravenpack. Indeed, the sentiment direction of an article as determined by RavenPack predicts the stock
price reaction to the article better when RavenPack consistently identifies the article as having high
relevance (HRH) then when the old technology mislabelled it as having low relevance (HRL). This implies
that traders use RavenPack to trade in the direction of the sentiment indicator provided by the news
analytics.
In addition to the faster stock price response, we also document an increase in the share of trade volume
concentrated in the first 5 seconds compared to the two minutes after an article. This increase is consistent
with the theoretical prediction that investors with a speed advantage trade aggressively on signals that they
can exploit before other traders (e.g., Foucault, Hombert, and Rosu (2013)). Taken together, these findings
confirm Hypothesis 2.
4
Next, we find that a stock becomes more illiquid immediately after the release of an HRH article (i.e.,
consistently identified as relevant). Both the illiquidity measure of Amihud (2002) and the effective spread
increase more in the five seconds after an HRH article relative to the five seconds after an HRL articles.
This finding confirms Hypothesis 3b and rejects Hypothesis 3a.
Finally, we document that high frequency traders dynamically learn about the signal precision of
RavenPack. More specifically, the causal effect of RavenPack on 5-second announcement returns is
stronger if RavenPack has been more informative in the past – i.e., if RavenPack’s sentiment scores
accurately predicted 2-minute announcement returns in the past for that industry. A one standard deviation
increase in informativeness almost doubles the causal effect of RavenPack’s sentiment score on 5-second
stock price returns. These findings suggest that algorithmic traders learn dynamically about the precision
of RavenPack, and that they rely more heavily on RavenPack’s sentiment scores if these scores have been
informative in the past. Such learning could be programmed into their algorithms (machine learning) or can
come from manually updating their algorithms over time. This finding confirms Hypothesis 4.
A series of robustness checks confirm our results. First, one potential concern could be that our results
are driven by the fact that HRH articles are systematically different from HRL articles. We address this
issue in two ways. First, we show that the long-run stock price reaction to HRH and HRL articles is very
similar and that they are not significantly different in a number of characteristics. Second, we use the fact
that RavenPack has back-filled the data of all versions to February 2004 to conduct placebo tests during the
time before RavenPack went live. If our results were driven by general differences between the two article
types, rather than a causal impact of RavenPack, then our tests should find significant price reactions before
RavenPack went live. However, for all tests we report insignificant differences in price reactions (between
HRH and HRL articles) before RavenPack went live, suggesting that general differences between the HRH
and HRL articles are not driving our results. Moreover, the stock price reactions to HRH and HRL articles
start to diverge exactly at the moment when RavenPack went live and the increase in the difference between
HRH and HRL articles is significant. All of this suggests a direct causal impact of RavenPack on the stock
market.
Overall, our tests show that news analytics have a significant impact on the market in terms of returns,
trading volume and liquidity in a manner predicted by several models. This effect goes beyond the
underlying influence of the news itself. Our study, however, can only detect the effect of RavenPack. There
are, of course, other providers of news analytics, and high frequency traders may conduct algorithmic news
processing in house. Thus, the total effect of algorithmic news processing is likely much larger than the
effect of RavenPack that we measure in this paper.

5
Importantly, our results have normative implications relating to recent discussions about the regulation
of high-speed sources of information and the effects of algorithmic trading.
3
We show that news analytics
allow the market to incorporate information more quickly and be more efficient, but that they induce
distortionary liquidity effects.
4
Furthermore, inaccuracies in news analytics can lead to stock price
reactions, which are unrelated to fundamental news and are quickly reversed – i.e., they lead to price
distortions analogous to “mini” flash crashes. Such distortions can increase volatility and reduce market
stability.
Our results contribute to three major strands of literature. First, we contribute to the growing empirical
literature on high frequency trading.
5
Several papers show that high frequency traders in general improve
price efficiency (e.g. Brogaard, Hendershott and Riordan (2014), Chaboud et al. (2013), Boehmer, Fong
and Wu (2015)). In contrast to these studies, we are able to examine one specific channel of their
informational advantage and provide evidence of an increased speed of price adjustment to that information.
Second, our paper is the first to show the causal impact of news analytics on stock markets. Thus, our
paper differs from the existing literature that investigates the correlation between the market and news
analytics (e.g. Riordan, Storkenmaier, Wagener, and Zhang (2013), Gross-Klugmann and Hautsch (2011),
Sinha (2012), Zhang (2013)) without passing judgment on whether there is a causal impact of news
analytics on the market.
Third, our results are consistent with recent models of high frequency trading in which some traders
have an informational advantage. For example, Foucault, Hombert, and Rosu (2013) model a situation in
which a speculator receives information one period ahead of the market maker in a set-up similar to Kyle
(1985); in Martinez and Rosu (2013) some agents have a short lived informational advantage; and in Dugast
and Foucault (2014), speculators face a trade-off between processing a signal faster or more accurately.
Faster traders in these models make markets more informationally efficient, but also more unstable. We
find support for both effects in our analysis.
3
“FBI joins SEC in computer trading probe”, Financial Times March 5, 2013.
4
It is questionable, whether the increased efficiency yields sufficient welfare gains to justify the investments in fast
trading technology. For a theoretical paper on the welfare effects of high frequency trading see Biais, Foucault and
Moinas (2015). Also, improved price efficiency can lead to lower incentives to gather private information (Weller,
2015).
5
Examples of this literature include Hendershott and Riordan (2013), Hendershott, Jones, and Menkveld (2011),
Baron, Brogaard and Kirilenko (2014), Menkveld (2013), Jovanovic and Menkveld (2010), Riordan and Storkenmaier
(2012), Boehmer, Fong, and Wu (2015), Hasbrouck and Saar (2013), Benos and Sagade (2012), Clark-Joseph (2013),
Hirschey (2013), Brogaard et al. (2014). A survey of this literature is provided by Jones (2013).

6
2. Test design, identification strategy, and data sources
In this section we first describe the RavenPack news analytics data and how it is used in our identification
strategy and tests. After a brief description of our stock market data, we then present summary statistics for
the variables used in our tests. Detailed definitions of all variables are in Appendix 1.
2.1 RavenPack
RavenPack provides real-time news analytics based on the Dow Jones Newswire. This service analyzes all
the articles on the Dow Jones Newswire with a computer algorithm and delivers article-level relevance and
sentiment metrics to its users. It determines which companies are mentioned in the article, how relevant the
article is to the company and reports different sentiment indicators about whether the article is good or bad
news for the company. The latency – i.e. the time from the release of the Dow Jones Newswire to the release
of the RavenPack metrics – is approximately 300 milliseconds. RavenPack claims it has the “timeliest
company sentiment indicators in the marketplace.”
6
As such, RavenPack is ideally suited for the use of
algorithmic and high frequency traders engaging in algorithmic news trading. In this paper, we use a broad
definition of HFT, which includes both, specialized high frequency trading firms that are co-located and
other professional traders that engage in algorithmic trading. For example, numerous hedge funds have
been subscribers to RavenPack since its inception.
7
2.1.1 Ravenpack – definition of variables
We extract from RavenPack the following variables. Article Category is a variable determining the topic
of the article and the role played by the company in the article. For example, Article Category might be
“acquisition – completed – acquirer” for a company announcing the completion of an acquisition of another
company or “rating – change – negative – rater” for a rating company that just downgraded another
company. The identification of the news topic is based on a purely algorithmic approach, and a large
percentage of articles cannot be classified in this way. Article Category Identified is a dummy variable
equal to 1 if Article Category is identified by RavenPack, and zero otherwise.
There are two major sentiment scores in RavenPack. The Composite Sentiment Score (CSS) is based
on several individual RavenPack sentiment measures. It takes a value ranging from 100 (positive) to 0
(negative), where 50 is a neutral article. It is available for each article. The Event Sentiment Score (ESS) is
coded in the same way as CSS, but only available if the category of the article can be identified. We
6
“RavenPack Enables Trading Programs with Sentiment on 10,000 Global Equities,” RavenPack press release from
May 28, 2009.
7
Confidential discussions with RavenPack managers provided us with a very consistent overview of market
penetration, suggesting that major institutional investors are in fact users of this service.

7
aggregate these two scores into a single sentiment variable called Sentiment Direction, which is first based
on ESS and uses CSS only if ESS is either missing or equal to 50 (neutral).
Relevance is an index provided by RavenPack that indicates the relevance of an article to the company.
This takes values ranging from 0 (least relevant) to 100 (most relevant). If the type of the article can be
identified and the company plays an important role in the main context of the story – e.g. is an acquirer or
announces a buyback – then the Relevance score is 100. If the company is mentioned in the title, but the
type of article cannot be identified, then Relevance ranges between 90 and 100. If the company is
mentioned, but plays an unimportant role, then it gets a low Relevance score. For example, a bank advising
an acquisition typically gets a score around 20. We would not expect such articles to affect the bank’s or
news agency’s stock prices very much.
In line with this, RavenPack recommends “filtering for Relevance greater than or equal to 90 as this
helps reduce noise in the signal”. To examine this claim, Figure 1 plots the market reaction to news as a
function of the Relevance Score. We report the cumulative returns from t-30 to t+120 seconds around the
news events from April 1, 2009 to September 10, 2012. We multiply the returns by the sentiment direction
of the article. The articles with Relevance greater than 90 do indeed have an important effect on stock prices,
but we find there is no reaction to articles with Relevance below 90. Thus, we will refer to articles with
Relevance below 90 as having low relevance. This analysis suggests that RavenPack is good at filtering out
the relevant news for a company and identifying the sentiment of an article.
2.1.2 Ravenpack – test design using different product versions
RavenPack released its first version (v. 1.0) to the market on April 1, 2009,
8 9
and a revised version of the
service (v. 2.0) with additional features on June 6, 2011. The most recent version we use (v. 3.0) was
released on September 10, 2012. RavenPack has provided us with data from each of the release-specific
algorithms, each having been back-filled to February 2004. Importantly, the stock-specific metrics from
these three releases can sometimes differ. RavenPack doesn’t change the overall definition of its algorithm
over time, so as not to distort its customers’ trading strategies which might be based on the specific way a
variable is defined. However, corrections have been made to the way companies are identified in an article
8
Even though the official release date of the RavenPack service was May 2009, some customers had access to the
service as early as from April 1, 2009. Thus, we refer to April 1, 2009 as the introduction of RavenPack. Before April
2009 RavenPack had a pre-existing service that also released sentiment information on the Dow Jones News Wire.
However, this service was meant more for longer term news analysis, such as charting sentiment over several days.
The prior service was not provided timely enough to be used at high frequency.
9
RavenPack 1.0 was actually released on Sept 6, 2010. A predecessor to v.1.0, that was similar to v.1.0, is the version
that was released on April 1, 2009. This predecessor version was not made available to us, but RavenPack confirmed
that it was very similar to RavenPack 1.0.

8
and how the relevance of an article to a company is determined.
10
This means that there are articles which
might have been associated with a company in one RavenPack release, but not in another. These differences
in the relevance of articles to companies in the different versions will provide the basis for our tests.
Assuming that the most recent version of RavenPack (v. 3.0, which we hereafter refer to as New
RavenPack) is the most accurate, we can infer which articles should have been marked relevant for which
companies. At the same time, using the information in RavenPack 1.0 and RavenPack 2.0 (we will refer to
those versions as Old RavenPack), we can observe which articles were originally released to the market as
relevant. This difference allows us to study the causal effect of coverage in RavenPack on the stock market.
Our analysis can be thought of as assuming two types of traders: HFTs that subscribe to RavenPack
and human traders that rely on reading the article to determine its content. Further, we assume that human
traders have an advantage in the precision with which they can derive a signal from the news, while HFTs
have an advantage in terms of speed. This means that RavenPack allows traders to trade faster on a less
precise signal. In the short run when only HFTs can react to news, RavenPack will have the largest impact,
while in the long run, human traders determine the price reaction, because their signal is more precise.
In the empirical implementation we have to choose specific time intervals to constitute the short and
the long run. We choose the short run to be 5 seconds, because this is long enough to capture the full reaction
of HFTs (including slower HFTs that are not co-located and might not trade in the millisecond
environment), while this time is too short for a human trader to read an article, process it and make a trading
decision based on it. We choose two minutes as the long run, because this should be enough time to read
an article and trade on it, while longer time windows will be more affected by noise. We provide robustness
checks in which we use 10 seconds for the short run window and 5 minutes for the long-run window.
We define the following article types that we also list in Panel A of Table 1. High relevance article
Released as High relevance article (HRH) is defined as an article that was classified as relevant in both
Old and New RavenPack. We predict that such an article creates a fast and persistent market reaction. High
relevance article Released as Low relevance article (HRL) is defined as an article with high relevance in
New RavenPack, but low relevance in Old RavenPack. Low relevance means either that the article was not
at all assigned to the company or that the relevance score was below 90. We expect such an article to have
a similar long run market reaction as an HRH article, because it is of similar relevance according to New
RavenPack. However, we would expect a slower market reaction as it was not released to the market as a
relevant article originally. Low relevance article Released as High relevance article (LRH) is defined as an
10
In addition, the number of companies covered by RavenPack has also increased between releases. There are 156
companies (3%), which are only covered in New RavenPack. We ensure by using company fixed effects that this
difference in coverage is not driving our results.

9
article that was released to investors as having high relevance, but has low relevance according to New
RavenPack. For these article, we would expect an initial overreaction of high frequency traders which might
later be reversed by human traders. Examples of all three article groups are provided in Appendix 4. A
fourth article category is Low relevance articles Released as Low relevance articles (LRL), these are articles
that have a relevance score below 90 in both versions.
11
We do not expect much market reaction to these
articles.
These predictions allow for two potential empirical set-ups: First, we could study overreaction by
comparing how the market reacts differently depending on whether a low relevance article was released as
having high or low relevance, i.e. we can compare LRH and LRL. Second, we could study underreaction
by comparing how the market reacts differently depending on whether a high relevance article was released
as having high or low relevance, i.e. we can compare HRH and HRL.
In both cases, we would assume that Old RavenPack contains no information on the relevance of the
article over and above that contained in New RavenPack. This is a fairly strong assumption. Fortunately,
this assumption is testable. Because we have data from 2004 and RavenPack went “live” in 2009, we can
examine the market impact to the different types of articles during the time period when RavenPack could
not have had any causal market impact, because it was not yet “live”. To do this, we regress absolute return
and turnover in the two minutes after the article on dummy variables equal to 1 for HRH, HRL and LRH
(with LRL being the omitted category). To control for firm- and time-specific effects, we include firm, date
and hour of the day fixed effects.
The results are presented in Panel B of Table 1. In addition to the three coefficients, we also test for
the statistical significance of the difference between HRH and HRL articles. The coefficient of LRH is
fairly large and significantly positive for both absolute returns and turnover, suggesting that LRH articles
are significantly more important than LRL articles. This implies that a test of overreaction comparing LRH
and LRL articles is not possible, because the two article types are fundamentally different. Thus, instead of
comparing LRH and LRL articles, we will rely on graphical evidence to compare the reaction to LRH
articles before and after RavenPack went “live”.
However, the difference between the coefficients for HRH and HRL articles is small and insignificant
for both turnover and absolute returns. Therefore, we conduct most of our tests based on the comparison
between these two groups. To ensure further that differences in importance between HRH and HRL are not
driving our results, we control for any potential differences between these groups by examining the speed
11 LRL articles also include articles that have a relevance score below 90 in either Old RavenPack or New RavenPack
and are not assigned to the company in the other version.

10
of market reaction, i.e. the size of the short run reaction relative to the long-run reaction. Furthermore, we
conduct placebo checks for all our tests showing that our results are not driven by differences in HRH and
HRL articles, but by the causal effect of RavenPack.
2.2 Stock market data
We use intraday quotes and trade data from TAQ.
12
We use the TAQ National Best Bid and Offer (NBBO)
file provided by WRDS for quotes. As a first step, we aggregate the trading volume at the frequency of one
second, and compute second-by-second returns from the end-of-second bid-ask midpoint. We use bid-ask
midpoints rather than trading prices to avoid the effects of bid-ask bounce. Even after this aggregation, the
data for all the stocks in our 8-year sample is by far too large to be used in a standard panel set-up. Most
microstructure studies thus have to limit their attention to a small number of stocks over a short time period.
Because we are only interested in the market reaction around a company’s news, we can limit our attention
to a few minutes around the news. This simplification allows us to study all US common stocks over the
full 8-year sample period.
To control for the overall market movements taking place during this period, we compute a second-
by-second intraday market index from the total TAQ universe. We compute second-by-second returns,
turnover and value-weighted volatility for the market index. We also compute returns for industry-specific
indices for the 12 Fama French industries. The details of the index construction are explained in Appendix
2. To control for stock-specific information, we use the CRSP daily stock file and compute the prior month’s
return, volatility, turnover, Amihud (2002) illiquidity measure, and market capitalization.
We employ the following filters: To be included in our sample, a stock must be covered in CRSP and
TAQ, must have SHRCD 10 or 11, must have a beginning of the day stock price of at least $1 and must
have a beginning of the day percentage bid-ask spread of less than 10%. We exclude articles that occur
outside trading hours or in the first or last 20 minutes of trading in the day. To avoid distortions from
overlapping windows around articles, we exclude stale news defined as articles for which the company had
an article in the prior 15 minutes. We also exclude four companies that appear in articles mainly as
information providers: McGraw-Hill, NASDAQ, CME and Moody’s. Because we need an initial bid-ask
midpoint to compute a first return and because we want to avoid a stock’s turnover influencing the stock
price we measure, we use seconds t−480 to t−1 as a burn-in period. Only articles for which the stock has a
quote in those 8 minutes before the article are included in our analysis.
2.3 Summary statistics and comparison between HRH and HRL
12
We use the usual filters of excluding all trades with zero size, negative prices, correction code different from 0 and
bid ask quotes where the bid is above the asked.
11
In Table 2, Panel A, we report the number of article-firm combinations classified as HRH and HRL, both
before and after RavenPack went live. In parentheses, we report the percentage of the total observations in
that line. In Panel B, we report the number of companies included in articles in each classification. Since
many companies have articles in both classifications, the number of observations in the two classifications
does not add up to the total. The number of articles is not dramatically different before and after the
introduction of RavenPack; indeed, there are fewer HRL articles after the introduction of RavenPack. This
suggests that our results are not driven by a spurious connection between the number of articles and the
existence of RavenPack.
The final sample consists of 321,912 article-firm combinations, starting with the release of RavenPack
1.0, over the period April 1, 2009 to September 10, 2012. In Panel A of Table 3, we report descriptive
statistics for all our variables for the combined sample of articles classified as HRH and articles classified
as HRL.
One concern with our analysis is that the information content of HRH and HRL articles might be
different. Therefore, we compare their difference in terms of observable variables in Panel B. For this
purpose, we regress each article characteristic on a dummy variable equal to 1 if the article is HRH (we
refer to this variable as D(HRH)) as well as the fixed effects used in our regression, namely: Relevance,
Category, Hour and Date Fixed Effects. We report the coefficient of D(HRH) as well as a t-statistic
clustered on the firm level. There is no statistical significant difference between the two groups in terms of
firm size, sentiment scores, time since the last article, turnover and illiquidity. Most importantly, we find
no evidence that HRH are more important than HRL articles. The absolute returns both over the 2 minutes
following an article and on the full trading day of the article are actually (insignificantly) lower for HRH
articles. This suggests that HRH articles are not generally more important. The only significant differences
between HRH and HRL articles are that stocks that are the subjects of HRH articles have a slightly lower
return (0.03%) and volatility (1.5%) in the prior month than those associated with HRL articles, and that
HRH articles cover fewer firms per article. However, these differences are small in economic terms (0.05,
0.09 and 0.22 standard deviations). In addition, we account for these differences with control variables in
all our regressions. The fact that HRH and HRL articles are similar alleviates worries that our results are
driven by differences in the article types. In addition, we run placebo tests to confirm that unobservable
differences are not driving our results.
3. Results
Here we present the empirical results of our paper. Each subsection is dedicated to one of the hypotheses
outlined in the introduction.
12
3.1 News analytics and temporary price distortions
In this section we examine Hypothesis 1, whether inaccuracies in news analytics lead to price distortions
analogous to “mini” flash crashes, i.e. to an overreaction in stock price that is afterwards reversed. As
explained in Section 1.1.2, we expect the market to overreact to LRH articles, i.e. articles that New
RavenPack identifies as having low relevance, but that were released as having high relevance in Old
RavenPack.
We first consider graphical evidence. In Figure 2, we compare the market reaction of articles
consistently released as relevant (HRH) with those released as relevant, but having low relevance in New
RavenPack (LRH). We focus on the cumulative return from t−30 to t+120 seconds around the news events.
We multiply returns with the sentiment direction of the article to be able to combine positive and negative
news in one analysis. We exclude articles with neutral sentiment. Figure 2 shows that the market overreacts
to LRH articles. In the short-run these articles have a price reaction that is very similar to HRH articles.
However, after approximately 30 seconds – a reasonable time for a fast human trader to process the article
– the stock price reaction to LRH articles starts to revert. After approximately 2 minutes, most of the short-
run reaction to these articles has reversed. In contrast, articles classified as HRH have a longer-term effect
on price, lasting more than two minutes. This finding is consistent with a causal effect of RavenPack that
leads high frequency traders to trigger an initial overreaction to the article that is then corrected by human
traders, a price distortion analogous to a flash crash (even though much smaller in magnitude).
Next, we provide a multivariate analysis. The problem in studying LRH articles in a regression set-up
is that we do not have an appropriate control group for these articles as they are more relevant than LRL
articles, but less relevant than HRH articles (see Panel B of Table 1). Therefore, we use LRH articles from
the period before RavenPack went “live” as the control group. While these articles should be of similar
relevance as LRH articles after RavenPack went “live”, they could not have had any causal effect on stock
prices as RavenPack at that time was not yet released to investors. In particular, we study whether LRH
articles have a stronger short run stock price impact and a larger reversal after RavenPack goes “live”, as
compared to before.
The results are presented in Table 4. We regress the stock price reaction to the article on an interaction
between the Sentiment Direction and a dummy equal to 1 after RavenPack went “live” in April 2009. In
addition, we include various combinations of control variables and fixed effects. To control for stock-
specific information, we use its market capitalization, return, volatility and turnover measured over the prior
month, and our illiquidity measure based on Amihud (2002). For brevity, the coefficients on these control
variables are only reported in the Internet Appendix. To control for characteristics of the news

13
announcement, we include the sentiment and article-specific variables defined in section 1.1.1. Appendix
1 contains a description of all the variables.
In regressions 1 to 3, we use the short-run stock return from 1 second before to 5 second after the
article as the dependent variable. We find that the short run stock return is significantly more positively
correlated with the sentiment of the article after RavenPack went “live” in 2009. Given that LRH articles
should not have changed in relevance after the introduction of RavenPack, this finding implies that there is
an overreaction to these articles. Indeed, it seems plausible that HFTs trade in the direction of the sentiment
of the article, because RavenPack (incorrectly) labelled the article as highly relevant.
Next, we study whether this overreaction is subsequently reversed. For this purpose, we use the stock
price reaction from 6 to 120 seconds after the article as the dependent variable. We find that it is more
negatively correlated with the article sentiment after RavenPack went “live”, consistent with a reversal.
While this result is not statistically significant, the negative magnitude of this coefficient is about the same
as the positive magnitude of the coefficient in the regression above, implying that almost all of the short
run overreaction is reversed in the two minutes after the article. The fact that this result is not significant
can be explained by the small sample size due to the fact that we exclusively focus on LRH articles.
13
Taken together, our graphical and regression analyses of LRH articles results confirm Hypothesis 1
that inaccuracies in news analytics can cause short term overreaction that is afterwards reversed, a return
pattern characteristic similar to a flash crash.
3.2 News analytics and speed of stock price response
In this section, we study Hypothesis 2, whether news analytics improve market efficiency by increasing the
speed with which stock prices and traders react to news. We first provide some graphical evidence and then
we provide a multivariate analysis.
3.2.1 Preliminary graphical evidence
As a first step, we conduct a purely time-series analysis and examine whether the market reaction to news
is faster after RavenPack was introduced in April 2009. For this purpose, we focus only on the articles that
are reported as highly relevant in both versions (HRH) and compare the market reaction for these articles
in the time before and after RavenPack went live. We study the reaction in terms of cumulative returns
13
We observe significant effects of the constituents of the interaction in this regression. The positive and significant
effect of Sentiment Direction is expected and shows that (even before the release of RavenPack) the market reacted
to the sentiment of the article. The negative coefficient on RavenPack Release is surprising but not very meaningful
as it shows that the average market reaction to articles was more negative after April 2009 (maybe due to the
aftermath of the financial crisis).
14
within the first 120 seconds after an article. We multiply returns by the sentiment direction to be able to
combine positive and negative news in one analysis.
We report the results in Figure 3. Because the news before and after the release of RavenPack differ
in average importance, we standardize the average cumulative returns in each group by the total average
cumulative return for that group after 120 seconds. Thus, the graph shows how much of the total reaction
happens within a certain time period. In Panel A, we compare this share of stock price reaction before and
after RavenPack went live. We see that there is a faster reaction after the introduction of RavenPack. After
10 seconds, 35.7% of the total reaction is incorporated into prices when RavenPack is live, while it is only
28.4% before April 2009.
For a better illustration, we display the difference between the two series in Panel B. It is striking to
see that the faster reaction in the post-RavenPack time period occurs mainly in the first 5 seconds after an
article is released, a time period in which only a computer could react to an article. From seconds 5 to 20,
the difference stays more or less constant. After 20 to 30 seconds, it starts to decline and it is reduced to
zero after 60 seconds, a time in which a fast human trader could react to an article. This finding suggests
that the speed of reaction to news increases after April 2009. While these observations are consistent with
news analytics improving market efficiency by increasing the speed of the market response after an article,
the increase in market efficiency after April 2009 is not necessarily due only to newswire services such as
RavenPack. Rather, it might also be caused by the rise of high frequency trading or any other phenomenon
happening at the same time. The ideal experiment would be to randomly select a set of articles each day
and not report news analytics for them. In our regression analysis in the next section, we come close to this
idea by studying relevant articles that were released as having low relevance in Old RavenPack (HRL
articles). This allows us to control for general time effects.
3.2.2 Regression analysis – speed of stock price response
In the rest of the paper, we will focus on the articles that are highly relevant according to New RavenPack,
but have been released as having low relevance in Old RavenPack (HRL). For these articles we have a good
control group in the form of articles that have been reported as having high relevance in both versions
(HRH). Comparing the market reaction to those two article groups allows us to see whether the market
underreacts to relevant news when RavenPack does not classify it as relevant as we expect. In this case, the
market will react quicker to a relevant article that is also reported as highly relevant (HRH).
We consider two alternative analyses for market reaction. First, we examine whether stock prices
respond faster to HRH articles irrespective of the direction of the reaction. Then we study whether the
sentiment of HRH articles predicts the directional stock price response better than HRL articles. For the

15
first analysis, we define Speed of Stock Price Response as:
,
,
,
over the
120 seconds around the news event.
14
This variable measures the amount of the two-minute price change
that takes place in the first five seconds after the release of the news. It is in the spirit of DellaVigna and
Pollet (2008). It captures the degree of under-reaction by decomposing the market reaction into its short-
and long-term components. The higher the value of Speed of Stock Price Response, the more the reaction
to the news event concentrates in the first few seconds after the event – i.e., the less under-reaction.
In Table 5, we present the result of regressions of Speed of Stock Price Response on D(HRH), which
is a dummy variable that takes the value of one if the article was released as highly relevant to the market
and zero if it was (incorrectly) released as having low relevance (HRL). In regressions 1 to 3, we estimate
our main specification during the time in which RavenPack was live (Apr 1, 2009 – Sept 10, 2012). In
regressions 4 to 6, we estimate a placebo test during the period before RavenPack was live. The models are
estimated at the article level, thus allowing for both HRH and HRL articles that were released for the same
firm or on the same day. This allows us to control in all regressions for unobserved heterogeneity with firm
fixed effects and daily fixed effects. In addition, we also add fixed effects for the article category (e.g.
mergers and acquisitions), the relevance score (from 90 to 100) and the hour during the day in which the
article was released in regressions 2, 3, 5, and 6. In regressions 3 and 6, we add as additional controls the
absolute return, turnover and volatility each for industry and market and for the two horizons from t−1 to
t+5 and t−1 to t+120 seconds around the article. All standard errors are clustered at the firm level.
The results for regressions 1 to 3 show a positive and significant relation between Speed of Stock Price
Response and D(HRH), indicating that the stock price response is much quicker for a HRH article than for
a HRL article. This result holds across all the different specifications and samples. It is not only statistically
significant, but also economically relevant. If we focus on the main specification (specification 3), we find
that HRH articles increase the Speed of Stock Price Response by 1.3 percentage points or 10% relative to
the mean. We find similar results if we compute Speed of Stock Price Response using market-adjusted and
industry-adjusted returns (reported in the Internet Appendix). This finding supports Hypothesis 2 that news
analytics increase market efficiency by increasing the speed of reaction to news.
One potential concern in this set-up is that our results are driven by the two article categories (i.e.,
HRH and HRL) having different informational content, i.e. the HRH articles being systematically more
relevant. To address this issue, we use the fact that RavenPack has back-filled the data to February 2004. If
14
We use Abs
Returnt1,t5
AbsReturnt6,t120 rather than Abs
Returnt1,t120
in the
denominator to constrain the variable between 0 and 1 rather than to allow it to approach infinity in cases where
Abs
Returnt1,t120
is close to zero.
16
our results are driven by general differences in the two categories, then there should be a difference in stock
price reaction before RavenPack went live. In regressions 4 to 6, we report the results of this placebo test
in the time period where RavenPack was not yet released to investors (February 1, 2004 ‒ March 31, 2009).
In contrast to the results in regressions 1 to 3 for the period when RavenPack was “live”, the placebo test
does not show a statistically significant relation between D(HRH) and the Speed of Stock Price Response,
thereby confirming that our main test is appropriate.
Another potential concern is that there might be a general trend in the difference of informational
content between HRH and HRL articles, and that this trend is driving our results rather than the causal
effect of RavenPack coverage on the market. To address this concern, we examine the relation between
Speed of Stock Price Response and D(HRH) for different years before and after the introduction of
RavenPack. To implement this analysis, we follow Gormley and Matsa (2011) and plot in Figure 4 the
point estimates of a modified version of regression 3 in Table 5. In this modified regression set-up, we
allow the effect of D(HRH) to vary by year. The control variables and the fixed effects are the same as in
the main specification. Because RavenPack went “live” in the second quarter of 2009, we assign the first
quarter of every year to the prior year. This way, years 2004 to 2008 were entirely before the release of
RavenPack, while years 2009 to 2011 were completely after the release of RavenPack. We report the plot
for this specification with one-year dummy variables in Panel A. In Panel B, we report the same regression
but interacting D(HRH) with two-year dummy variables (with the first quarter shifted backwards as
described above). We report 95% confidence intervals for the coefficients in both panels. In Panel C, we
report the simple difference between Speed of Stock Price Response for HRH and HRL articles without any
controls over different years (with the first quarter shifted backwards).
It is evident in the plots that the release of RavenPack magnifies the reaction to differences in versions.
Before the introduction of RavenPack, the difference between HRH and HRL hovers around zero and there
is no obvious time trend. After the introduction of RavenPack, the difference is much larger. This suggests
the delivery of news analytics by RavenPack has an impact on the market that is separate and distinct from
the underlying informational content of the news. It also suggests that our results are not driven by a
spurious trend.
3.2.3 Regression analysis – directional stock price response
We now ask whether there is a relation between the stock price response and the sentiment direction of the
news. That is, does the magnitude of the RavenPack-related stock price response (via correctly-labelled
HRH articles) depend on whether the news is positive, negative, or neutral?

17
For this purpose, we ask whether the sentiment indicator in RavenPack better predicts the short run
stock price reaction if an article is correctly classified as relevant (HRH) in RavenPack. We regress stock
returns measured over the interval 1 second before to 5 seconds after the article on D(HRH), Sentiment
Direction, the interaction between D(HRH) and Sentiment Direction, and the fixed effects and control
variables defined previously. We adopt the same econometric specification as before, but exclude any
sentiment-related control variables as the effect of sentiment will be captured by Sentiment Direction. We
report the results in Table 6. In Regressions 1 to 3, we estimate our main specification during the period
when RavenPack was live (Apr 1, 2009 – Sept 10, 2012). The results show a positive and significant relation
between returns and the interaction between D(HRH) and Sentiment Direction. That is, the RavenPack-
induced stock price reaction is significantly different for positive versus negative news stories.
This result holds across all the different specifications. Similar results for market and industry adjusted
returns are reported in the Internet Appendix. As before, the placebo test in Regressions 4 to 6 indicates
there is not a statistically significant effect on returns during the period before RavenPack was live. These
results confirm that news analytics have a directional impact on stock prices over and above the one of the
underlying news.
3.3 News analytics and trade volume response
In the previous section, we saw that news analytics increase the speed at which prices adjust after news is
publicly released via the Dow Jones Newswire. While the Dow Jones Newswire constitutes a public signal,
RavenPack allows its subscribers to react to these public signals faster. Such a speed advantage in the
reaction time to news is modelled in Foucault, Hombert, and Rosu (2013). Their model predicts that
investors trade very aggressively when they receive a signal earlier than other market participants.
Therefore, we investigate whether the faster stock price response to an HRH article is accompanied by
a faster trade volume response as well. We define Speed of Trade Volume Response as:
,
,
.
The variable is defined using the same intervals as Speed of Stock Price Response. It captures the amount
of trade volume that is concentrated in the first 5 seconds after the news event relative to the trading volume
in the two minutes following the news event. We regress Speed of Trade Volume Response on D(HRH)
using the same fixed effects and control variables defined above. The specification is identical to the
specification for Speed of Stock Price Response employed in Table 5.
We report the results in Table 7. In regressions 1 to 3, we estimate our main specification during the
period in which RavenPack was live (Apr 1, 2009 – Sept 10, 2012). As in the case of Speed of Stock Price
Response, we find a strong positive and significant relation between Speed of Trade Volume Response and
D(HRH). This result holds across all specifications. Speed of Trade Volume Response is 0.5 percentage

18
points larger for HRH articles than for HRL articles, or 9% relative to the mean. In regressions 4 to 6, we
estimate a placebo test in the period in which RavenPack was not yet released to investors (Feb 1, 2004 –
Mar 31, 2009). As was the case for Speed of Stock Price Response, the placebo test shows no significant
difference in the speed of trade volume response between HRH and HRL articles during the period before
RavenPack went live.
Overall, the results in these last two sections show that both stock prices react faster and traders trade
more aggressively afterarticles that are covered in RavenPack, confirming that news analytics have a
measurable impact on the stock market in addition to the information content of the news itself and improve
price efficiency, as posited by Hypothesis 2.
3.4 News analytics and market liquidity
In this section, we examine Hypotheses 3a and 3b on the effect of news analytics on liquidity. The results
in the previous two sections suggest that news analytics improve stock market efficiency by increasing the
speed of reaction to news, which should lead to an increase in liquidity. We now ask whether the positive
information effect is swamped by the higher information asymmetry created by the fact that only a subset
of traders uses news analytics. If this is the case, we expect a reduction in stock liquidity (Kim and
Verrecchia (1994)).
We investigate this issue by regressing the change on market liquidity on our D(HRH) dummy as and
a set of control variables defined as in the previous specifications. We use two proxies for liquidity, the
Amihud (2002) measure and the effective spread. The Amihud illiquidity measure is defined as:
AmihudIlliquidity
∑
|
|
,
where r
it
is the return for stock i during second t; dolvol
it
is the dollar volume for stock i during second t;
and N
ij
is the number of seconds in which stock i traded during interval j. Effective spread is defined as:
EffectiveSpread
∑
∗
,
where buys
it
(sells
it
) is the number of stocks bought (sold) for stock i during second t;
is the last
execution price for stock i during second t;
is the last bid-ask midpoint for stock i during second
t and N
ij
is the number of seconds in which stock i traded during interval j.
Because these liquidity measures are positively autocorrelated, we standardize them with respect to
their average computed before the article is released. Specifically, we compute:
,
,
,
; and

19
,
,
,
.
The regression set-up is the same as in Tables 5 and 6.
We report tests of this hypothesis in Table 8. During the time period where RavenPack was live (Panel
A), we observe an increase in both Amihud illiquidity and effective spread if an article is correctly released
as relevant (HRH), while there is no significant effect in the placebo sample (Panel B). These results show
that illiquidity increases (liquidity decreases) more after a news release delivered via RavenPack. This
confirms Hypothesis 3b that the increase in information asymmetry causes a reduction in liquidity, while it
is inconsistent with Hypothesis 3a.
3.5 Learning about precision in news analytics
The underlying premise of our analysis is that the users of Ravenpack use news analytics in an “informed
way”. In this section we directly test this premise. In particular, we are interested in whether they are
dynamically learning about the signal precision of RavenPack. Such learning could be programmed into
their algorithms (machine learning) or can come from manually updating their algorithms over time. If
algorithmic traders learn about the precision of RavenPack, we would expect them to rely more on
RavenPack’s sentiment indicators if these indicators were more informative in the past. If that is the case,
there should be a stronger stock price reaction to news analytics in stocks in which news analytics have
been informative in the past (Hypothesis 4).
We test Hypothesis 4 by regressing the short run stock price response on a triple interaction between
Sentiment Direction, D(HRH) and Past Informativeness. Thus, we test whether the causal effect of
RavenPack on 5-second announcement returns documented in Table 6 is stronger if RavenPack has been
more informative in the past. For an article related to industry k, we define Past Informativeness as the
average signed two-minute post-article return for all articles related to industry k during the previous six
months. This measure is higher if Sentiment Direction more accurately predicted two-minute post-article
returns in the past for that industry.
15
The results are reported in Table 9. In our main test in Panel A, we define Past Informativeness over
six months and use the 12 Fama-French industry classifications. We find a significant increase of the causal
effect of RavenPack sentiment information on 5 second stock returns if Past Informativeness is high. A one
15
We confirm in Appendix 3 that the sentiment scores of articles with higher Past Informativeness do indeed better
predict two-minute post-article returns. We show that Sentiment Direction of articles with a one standard deviation
higher Past Informativeness predict a higher stock price response of 0.72 bp (1.15*0.627=0.72). This corresponds to
an increase of 37% relative to the mean (0.72/1.92=37%).

20
standard deviation increase in Past Informativeness increases this effect by 57% to 100% relative to the
average result reported in Table 6.
16
In regressions 4 to 6 of Panel A, we show in a placebo test that this
effect does not happen before Ravenpack went live. In Panel B, we report robustness checks using different
definitions of Past Informativeness. In particular, we use 30 industries instead of the 12 Fama-French
industries and 3 months instead of 6 months. In all cases, we find that the results are similar to those in
Panel A.
In total, these results suggest that algorithmic traders learn dynamically about the precision of
RavenPack and base their trades more on RavenPack’s sentiment scores, if these scores have been
informative in the past, thereby confirming Hypothesis 4.
4. Additional robustness checks
In this section, we consider some robustness checks for our main results in Tables 5, 6 and 7.
4.1 Difference in difference specification
We begin by considering a difference-in-difference analysis. Until now we have mainly focused on the
significant effect of RavenPack on the stock market during the period when it was live. The placebo tests
in Section 3 showed no effect for the pre-RavenPack period. However, it is possible that the placebo tests
might not find significant results because of weak power. Even if this is unlikely as the pre-RavenPack
sample is longer than the sample period for our main tests, we provide robustness checks for the placebo
specification. We estimate a difference-in-difference specification for our entire sample period (February
1, 2004 ‒ September 10, 2012) to study whether the difference between the pre- and post-RavenPack
periods is statistically significant.
We report the results in Table 10. In Regressions 1-2 and 3- 4, the dependent variables are Speed of
Stock Price Response and Speed of Trade Volume Response, respectively. In Regressions 1 to 4, the
explanatory variable of interest is the interaction between D(HRH) and RavenPack Release. RavenPack
Release is a dummy variable taking the value of 1 after the release of RavenPack on April 1, 2009, and zero
otherwise. In regression 5 and 6, the dependent variable is the return from 1 second before to 5 seconds
after the article. The explanatory variable of interest is the triple interaction between D(HRH), RavenPack
16
For Past Informativeness 6 month 12 FF: effect of 1 standard deviation: 0.225∗1.15 0.25, which is relative
to the average effect from Table 7:
.
.
57%
For Past Informativeness 6 month 30 FF: effect of 1 standard deviation: 0.319∗1.46 0.46, which is relative to
average effect from Table 7:
.
.
100%
21
Release and Sentiment Direction. In terms of fixed effects and control variables the regressions follow the
original specifications in Tables 5, 6 and 7. We exclude the intermediate specification for brevity, but report
it in the Internet Appendix.
The results in Table 10 are consistent with our previous findings. They confirm that the effect of the
difference between HRH and HRL articles increases significantly after RavenPack went live. More
specifically, the results in Regressions 1 to 4 show a strong positive and significant relation between both
the Speed of Stock Price Response and the Speed of Trade Volume Response and the interaction between
RavenPack Release and D(HRH). The results in regressions 5 and 6 show an increase in the effect of
Sentiment Direction on returns for articles classified as HRH after RavenPack went live. These results are
in line with our previous findings that our results represent a causal effect of RavenPack on the market
rather than a spurious correlation.
4.2 Alternative placebo tests
Our base sample for the placebo test is Feb 2004 − Apr 2009. This time period includes the financial crisis
and the introduction of Regulation National Market System (Reg NMS), both of which had a significant
impact on the market. Thus, it might be that our findings of no significant result in the placebo tests are
related to these events. To address this issue, we conduct additional tests, which are reported in Table 11.
In Panel A, we exclude the financial crisis and focus only on the period Feb 1, 2004 to Dec 31, 2007. In
Panel B, we exclude the period before the introduction of Reg NMS. Reg NMS included several changes
to market structure, one of the most important of which was the introduction of the trade-through rule (Rule
611), which essentially imposed a price priority rule across all markets (O’Hara and Ye (2011)). It has been
argued that Reg NMS led to an increase in high frequency trading (Hasbrouck and Saar (2013)) and
increased fragmentation of U.S. markets (O’Hara and Ye (2011)). Implementation of Rule 611 started on
July 9, 2007 (Chung and Chuwonganant (2012)). Accordingly, we reduce our placebo sample and just focus
on the period from July 9, 2007 to April 1, 2009.
In Regressions 1 to 4, the dependent variables are Speed of Stock Price Response and Speed of Trade
Volume Response and the explanatory variable of interest is D(HRH). In regression 5 and 6, the independent
variable is the return from 1 second before to 5 seconds after the article and the explanatory variable of
interest is the interaction between D(HRH) and Sentiment Direction. For both alternative placebo tests and
for all the different dependent variables, there is no significant effect associated with RavenPack articles
classified as HRH and the coefficients of interest are generally small. This suggests that the absence of
significant results in our placebo sample in Section 2 is not driven by inclusion of the financial crisis or the
pre-Regulation NMS time period, and suggests that our results are not due to confounding events, but are
directly related to RavenPack having accurately delivered its news-related metrics to customers.
22
4.3 “Old RavenPack” definition: RavenPack 1.0 versus RavenPack 2.0
In our main specification, Old RavenPack included both RavenPack 1.0 and RavenPack 2.0. A concern is
that the difference in reaction before and after the release of New RavenPack is driven by the transition
from v.1.0 to v.2.0 in July 2011. Therefore, our next robustness check focuses only on RavenPack 1.0. We
re-estimate the same specifications as before, but include only the period when RavenPack1.0 was live, i.e.
April 1, 2009 to July 6, 2011. We report the results in Panel C of Table 11 using the same regression set-
up as in Panels A and B. All specifications confirm the previous results and are similar in terms of economic
magnitude.
4.4 Alternative length of event window
In our analyses we compare the stock price reaction in the short run, during which only high frequency
traders can react to an article, to the stock price reaction in the long run during which human traders will
have read, processed and traded on the article. In all of our prior analyses, we used 5 seconds as the short-
run window and 120 seconds as the long-run window. In Table 12, we show robustness to choosing different
windows lengths. In particular, we use 10 seconds as the alternative short window and 300 seconds as the
alternative long window. In Panel A, we show that HRH articles have a faster Speed of Stock Price
Response using all three possible additional combinations of event windows: 10 seconds / 120 seconds; 5
seconds / 300 seconds; and 10 seconds / 300 seconds. The results are statistically significant at the 1%
threshold for all three specifications and even increase somewhat in economic magnitude. In Panel B, we
repeat the same analysis for Speed of Stock Price Response. Once again the results are significant in all
specifications. Finally, in Panel C we provide a robustness check on the analysis of how well the sentiment
direction of an article predicts the short run stock return depending on whether the article is HRH (vs HRL).
We show replacing the 5 second stock return with the 10 second stock return slightly increases the effect
while staying significant at the 5% threshold.
Overall, our robustness tests confirm our findings that RavenPack has an impact on the market that is
distinct from the underlying informational content of the news. The findings are not due to spurious
correlation or other confounding effects.
5. Conclusion
We study how news analytics companies affect the stock market and, in particular, liquidity and market
efficiency. We exploit an identification strategy based on differences in classifications between different
product versions of RavenPack, a major provider of news analytics for algorithmic and high frequency
traders. Comparing the market reaction to similar news items depending on whether the news has been
23
correctly released to customers or not, we are able to determine the causal effect of news analytics on stock
prices, irrespective of the informational content of the news.
We document that news analytics have a significant impact on the market that is separate from the
information contained in the news. The speed of adjustment of both stock prices and trade volume in
response to the information contained in a highly-relevant article is faster if the article was originally
released by RavenPack as being relevant than if it was released as not relevant. However, in these cases we
also find that liquidity is lower after the article. Thus, we observe two effects of news analytics on the stock
market. On the positive side, news analytics improve market efficiency by speeding up market reaction to
news. On the negative side, because only a subset of traders has access to this information, news analytics
increase information asymmetry in the market and thus reduce liquidity.
We also consider the market response to low relevance articles that were released as having high
relevance. We find that the market temporarily overreacts to these articles. Much of the initial price reaction
to these articles corrects starting 30 seconds after the article. Thus, we show that inaccuracies in news
analytics can lead to price distortions analogous to mini flash crashes. Furthermore, we provide evidence
that algorithmic traders learn about the informativeness of news analytics dynamically. A series of
econometric robustness checks (e.g., difference-in-difference specifications, different samples, placebo
tests) confirm the results.
Our findings have normative implications in terms of the recent regulatory debate on high-speed
information and the effects of algorithmic and high-frequency trading. We show that news analytics
improve price efficiency, but at the cost of reducing liquidity and potentially distortionary price effects.
24
References
Amihud, Y., 2002. Illiquidity and Stock Returns: Cross-Section and Time-Series Effects. Journal of Financial Markets
5, 31–56.
Baron, Matthew, Jonathan Brogaard and Andrei Kirilenko, 2014, The Risk and Return in High Frequency Trading,
Working Paper.
Benos, Evangelos and Satchit Sagade, 2012, High-frequency trading behaviour and its impact on market quality:
evidence from the UK equity market, Working Paper.
Biais, Bruno, Thierry Foucault and Sophie Moinas, 2015, Equilibrium Fast Trading, Journal of Financial Economics.
Boehmer, Ekkehart, Kingsley Fong, and Julie Wu, 2015, International evidence on algorithmic trading, Working
Paper.
Brogaard, Jonathan, Terrence Hendershott, and Ryan Riordan, 2014, High frequency trading and price Discovery,The
Review of Financial Studies, 27, n. 8. .
Brogaard, Jonathan, Björn Hagströmer, Lars Norden, and Ryan Riordan, 2014, Trading fast and slow: colocation and
market quality, Working Paper.
Brogaard, Jonathan, Al Carrion, Thibaut Moyaert, Ryan Riordan, Andriy Shkilko, Konstantin Sokolov, 2015, High-
Frequency Trading and Extreme Price Movements, Working Paper.
Chaboud, Alain, Ben Chiquoine, Erik Hjalmarsson, and Clara Vega, 2013, Rise of the Machines: Algorithmic Trading
in the Foreign Exchange Market, Journal of Finance, forthcoming.
Chan, W. S., 2003, Stock price reaction to news and no-news Drift and reversal after headlines, Journal of Financial
Economics, 702, 223-260.
Chung, Kee H., and Chairat Chuwonganant, 2012, Regulation NMS and Market Quality, Financial Management, 41,
285-317.
Clark-Joseph, Adam D., 2013, Exploratory Trading, Working Paper.
Das, Sanjiv R., and Mike Y. Chen, Yahoo! for Amazon: Sentiment Extraction from Small Talk on the Web,
Management Science 53, 1375-1388.
DellaVigna, S., and Pollet, J., 2009, Investor Inattention, Firm Reaction, and Friday Earnings Announcements, Journal
of Finance, 64, 709-749.
Dugast, Jerome and Thierry Foucault, 2014, False News, Informational Efficiency, and Price Reversals, Working
Paper.
Foucault, Thierry, Johan Hombert and Ioanid Rosu, 2013, News Trading and Speed, Working Paper.
Gai, Jiading, Chen Yao and Mao Ye, 2013, The Externalities of High Frenquency Trading, Working Paper.
Garcia, Diego, Sentiment during Recessions, Journal of Finance 68, 1267–1300.
Gerig, Ausin, 2015, High-Frequency Trading Synchronizes Prices in Financial Markets, Working Paper.
Golub, Anton, John Keane and Ser-Huang Poon, 2012, High Frequency Trading and Mini Flash Crashes, Working
Paper.
Gormley, Todd A., and David A. Matsa, 2011, Growing Out of Trouble? Corporate Responses to Liability Risk,
Review of Financial Studies 24, 2781-2821.
Groß-Klußmann, Axel and Nikolaus Hautsch, 2011, When machines read the news: Using automated text analytics
to quantify high frequency news-implied market reactions, Journal of Empirical Finance, 18, 321-340.
Hagströmer, Björn , Nordén, Lars, 2013. The diversity of high frequency traders, Journal of Financial Markets, 16,
741-770.
Hasbrouck, Joel and Gideon Saar, 2013, Low-Latency Trading, Journal of Financial Markets 16, 646–679.
25
Hendershott, Terrence and Ryan Riordan, 2013, Algorithmic Trading and the Market for Liquidity, Journal of
Financial and Quantitative Analysis 48, 1001-1024.
Hendershott, Terrence, Charles M. Jones and Albert J. Menkveld, 2011, Does Algorithmic Trading Improve
Liquidity?, Journal of Finance, 66, 1-33.
Hirschey, Nicholas, 2013, Do High-Frequency Traders Anticipate Buying and Selling Pressure?, Working Paper.
Hu, Grace X., Jun Pan and Jiang Wang, 2013, Early Peek Advantage?, Working Paper.
Jegadeesh, Narasimhan, and Di Wu, 2013, Word power: A new approach for content analysis, Journal of Financial
Economics 110, 712-729.
Jones, Charles, 2013, What do we know about high-frequency trading?, Working Paper.
Jovanovic, Boyan and Albert J. Menkveld, 2011, Middlemen in Limit-Order Markets, Working Paper.
Kim, Oliver and Robert E. Verrecchia, 1994, Market liquidity and volume around earnings announcements, Journal
of Acccounting and Economics.
Kyle, Albert, 1985. Continuous auctions and insider trading, Econometrica 53, 1315-1336.
Martinez, Victor H., and Ioanid Rosu 2013, High Frequency Traders, News and Volatility, Working Paper.
Menkveld, Albert, 2013, High frequency trading and the new market makers, Journal of Financial Markets, 16, 712-
740.
O’Hara, Maureen and Mao Ye, 2011, Is market fragmentation harming market quality?, Journal of Financial
Economics, 100, 459–474.
Riordan, Ryan, Andreas Storkenmaier, Martin Wagener and S. Sarah Zhang, 2013, Public information arrival: Price
discovery and liquidity in electronic limit order markets, Journal of Banking and Finance, 37, 1148-1159.
Riordan, Ryan and Andreas Storkenmaier, 2012, Latency, liquidity and price discovery, Journal of Financial Markets,
15, 416-437.
Sinha, Nitish Rajan, 2012, Underreaction to News in the US Stock Market, Working Paper.
Weller, Brian, 2015, Efficient Prices at Any Cost: Does Algorithmic Trading Deter Information Acquisition?,
Working Paper.
Zhang, Sarah S., 2013, Need for Speed: An Empirical Analysis of Hard and Soft Information in a High Frequency
World, Working Paper.

26
Figure 1: Market reaction by Relevance Score
This figure displays the cumulative signed return from t-30 to t+120 seconds around the news events from 1 April 2009 to 10 September 2012.
Signed returns are returns are multiplied with the sentiment direction of the article. We exclude articles with neutral sentiment. Low Relevance
refers to articles with a Relevance Score below 90 in both RavenPack versions, while High Relevance refers to articles that have a Relevance Score
greater or equal than 90 in both RavenPack versions.
Cumulative signed return
‐1
‐0.5
0
0.5
1
1.5
2
2.5
‐300 306090120
CumulativeSignedReturn(BasisPoints)
LowRelevance
HighRelevance

27
Figure 2: Difference in Stock Price Response between HRH and LRH Articles
This figure displays the cumulative return from t-30 to t+120 seconds around the news events during the period when RavenPack was live, April
1, 2009 to September 10, 2012. Returns are multiplied with the sentiment direction of the article. We exclude articles with neutral sentiment. HRH
refers to articles that have a relevance scores greater or equal 90 in both RavenPack versions, while LRH refers to articles that had a relevance score
greater or equal 90 in the old RavenPack version while having Relevance below 90 in the new RavenPack version.
‐1.5
‐1
‐0.5
0
0.5
1
1.5
2
2.5
‐300 306090120
CumulativeReturn(BasisPoints)
LRH
HRH

28
Figure 3: Difference in market reaction after RavenPack is live
The figure in Panel A displays the share of the total stock price response to news within the first 120 seconds after an article. We compare the
reaction to articles before (Feb 2004 – Mar 2009) and after RavenPack went live (April 2009 to 10 September 2012). Returns are multiplied with
the sentiment direction of the article. We exclude articles with neutral sentiment. We standardize the average cumulative return within each group
by dividing it by the total average cumulative return for that group after 120 seconds. We only include articles that are consistently reported as
relevant (HRH) in both versions. In Panel B, we display the difference between the two series from Panel A.
Panel A: Share of Stock Price Reaction before vs. after RavenPack is live
Panel B: Difference in Share of Stock Price Reaction before vs. after RavenPack is live
0.0%
10.0%
20.0%
30.0%
40.0%
50.0%
60.0%
70.0%
80.0%
90.0%
100.0%
0 102030405060708090100110120
ShareofStockPriceResponse
BeforeRavenpack
(Feb2004‐Mar
2009)
AfterRavenpack
(Apr2009‐Aug
2012)
‐5.0%
‐3.0%
‐1.0%
1.0%
3.0%
5.0%
7.0%
9.0%
0 102030405060708090100110120
DifferenceinShareofStockPriceResponse
DifferenceAfter
vs.Before
Ravenpack

29
Figure 4: Difference in Speed of Stock Price Response (HRH vs. HRL) Over
Time
The figure in Panel A reports the point estimates from an OLS regression of Speed of Stock Price Response (
,
,
,
)
on D(HRH) interacted with yearly dummy variables from 2004 to 10 September 2012. We assign the first quarter of a year to the prior year, i.e.
the 2009 dummy covers a time period from 1 April 2009 to 1 April 2010. Controls and fixed effects are the same as in table 4 regression 3. The
vertical line indicates the introduction of RavenPack on 1 April 2009. In Panel B, we report the same regression but interacting the HRH dummy
variable with two-year dummy variables (with the first quarter shifted backwards). In Panel C, we report the difference between Speed of Stock
Price Response for HRH and HRL articles over different years (with the first quarter shifted backwards).
Panel A: Estimate of coefficient on D(HRH) interacted with yearly dummies
Panel B: Estimate of coefficient on D(HRH) interacted with two-year dummies
‐3
‐2
‐1
0
1
2
3
4
2004 2005 2006 2007 2008 2009 2010 2011 2012
SpeedofStockPriceResponse
Coefficients
95%CI
‐1.5
‐1
‐0.5
0
0.5
1
1.5
2
2.5
3
3.5
4
04 05‐06 07‐08 09‐10 11‐12
SpeedofStockPriceResponse
Coefficients
95%CI

30
Panel C: Comparing the difference in mean
‐1
‐0.5
0
0.5
1
1.5
2
2.5
3
2003 2004 2005 2006 2007 2008 2009 2010 2011
ShareofStockPriceReaction
Difference

31
Table 1: Overview of Four Article Types
In Panel A, we present our predictions for the market reaction to different articles. In Panel B, we present the results of article-level regressions that
examine the market reaction to different types of articles in the time period where RavenPack was not yet sold to investors (February1, 2004 –
March 31, 2009). The dependent variables are the absolute returns and turnover in the two minutes after the article. Returns are based on mid-
quotes. The explanatory variable of interest are D(HRH), D(HRL) and D(RLH), which are dummy variables for these article categories (LRL is
the omitted category. At the bottom of the table we display the t-statistic for the difference between HRH and HRL articles. All standard errors are
clustered at the firm level. T-statistics are below the parameter estimates in parenthesis; ***, **, * indicate significance at the 1%, 5%, and 10%
level, respectively.
Panel A: Predictions for the market reaction of the different article types
New RavenPack
High Relevance Article Low Relevance Article
Old RavenPack
High Relevance Article
HRH: Fast and persistent market reaction
LRH: Fast market reaction that
mean-reverts (overreaction).
Low Relevance Article
HRL: Slow market reaction (underreaction) LRL: No stock price reaction
Panel B: Stock price reaction to the different article types BEFORE RavenPack went “live”
Dependent Variable: Absolute Return t−1,t+120 Turnover t−1,t+120
D (HRH) 3.235
***
0.335
***
(36.37) (33.75)
D (HRL) 3.118
***
0.325
***
(11.74) (9.08)
D (LRH) 2.494
***
0.311
***
(9.24) (9.34)
Number of Observations 2214726 2214726
R
2
0.151 0.184
Hour Fixed Effects Yes Yes
Date and Firm Fixed Effects Yes Yes
Difference coefficients of D(HRH) and D(HRL) 0.117 0.010
(t-stat) (0.43) (0.29)

32
Table 2: Number of observations
This table displays the number of articles and companies in subsamples of our data. The before-RavenPack sample consists of articles from February
1, 2004 to March 31, 2009. The after-RavenPack sample consists of articles from April 1, 2009 to September 10, 2012. . HRH refers to articles that
have a relevance scores greater or equal 90 in both RavenPack versions, while HRL refers to articles that had a Relevance smaller than 90 in the
old RavenPack version while having Relevance greater or equal than 90 in the new RavenPack version. In Panel A, we report the number of article-
firm combinations in each category. In parenthesis we report the percentage of the total in the respective line. In Panel B, we report the number of
companies that articles in the group span. Since many companies have articles in both groups, the two groups do not add up to the total.
Panel A: Number of articles
HRL HRH Total
Before RavenPack release
17,621 464,543 482,164
(3.7%) (96.3%) (100%)
After RavenPack release
7,342 314,570 321,912
(2.3%) (97.7%) (100%)
Total
24,963 779,113 804,076
(3.1%) (96.9%) (100%)
Panel B: Number of companies
HRL HRH Total
Before RavenPack release
1,774 5,016 5,188
(34.2%) (96.7%) (100.0%)
After RavenPack release
1,294 3,978 4,011
(32.3%) (99.2%) (100.0%)
Total
2,370 5,200 5,385
(44.0%) (96.6%) (100.0%)

33
Table 3: Summary Statistics – Relevant articles, Apr 2009 to Sept 2012
This table displays summary statistics for the 321,912 article-company combinations after RavenPack went “live” (April 1, 2009 to September 10,
2012). These article-company observations are classified as relevant in the new RavenPack (i.e. they are HRH or HRL). Market capitalization is
the number of shares outstanding multiplied by the prior day closing price. Average volatility prior month is the average squared return in the 20
trading days before the article. Average turnover prior month is the mean of trading volume divided by shares outstanding in the 20 trading days
before the article. Absolute return t−1, t+5 is the absolute stock return from 1 second before to 5 seconds after the article. Speed of Stock Price
Response is defined as
,
,
,
. Turnover t−1, t+5 is trading volume divided by shares outstanding from 1 second
before to 5 seconds after the article. Speed of Trade Volume Response is defined as
,
,
. Return on trading day is the stock return over
the entire trading day that the article was released. Absolute return on trading day is its absolute value. Time since last company article is the time
since the company was last mentioned in an article. Number of firms in article defines the number of companies mentioned in the article. Composite
Sentiment Score is a sentiment score that is provided by RavenPack and takes a value from 100 (positive) to 0 (negative). Absolute Composite
Sentiment Score is defined as Abs (Composite Sentiment Score – 50). Neutral Composite Sentiment Score is a dummy variable equal to 1 if the
Composite Sentiment Score equals 50. Article Category Identified is a dummy variable equal to 1 if the article category (e.g. merger and acquisitions)
is identified by RavenPack. Event Sentiment Score is a sentiment score that is provided by RavenPack and takes a value from 100 (positive) to 0
(negative); this is available only for articles for which the category is identified. Absolute Event Sentiment Score is defined as Abs (Event Sentiment
Score – 50). Neutral Event Sentiment Score is a dummy variable equal to 1 if the Event Sentiment Score equals 50. In Panel A, we report descriptive
statistics. In Panel B we report the difference between articles that were consistently released as relevant in both RavenPack versions (HRH) and
those that were released as having low relevance (HRL). The difference is defined as the regression coefficient of D(HRH) in a regression of the
respective variable on D(HRH) and Relevance, Category, Hour and Date Fixed Effects. D(HRH) is a dummy equal to 1 if the article is HRH. We
also report t-statistics for the coefficient clustered at the firm level. ***, **, * indicate significance at the 1%, 5%, and 10% level, respectively.
Panel A: Descriptive Statistics
Mean 25
th
Percentile Median 75
th
Percentile
Standard
Deviation
Market capitalization ($ million) 13185.0 157.4 1782.9 30027.4 37016.1
Average return prior month (%) 0.12 -0.57 0.10 0.79 0.65
Average volatility prior month (%) 9.69 1.19 4.79 20.4 17.7
Average turnover prior month (%) 1.17 0.27 0.83 2.29 1.23
Absolute Return t−1,t+5 (basis points) 1.95 0 0 4.43 9.46
Absolute Return t−1,t+120 (basis points) 11.4 0 5.00 27.4 21.7
Speed of Stock Price Response (%) 13.2 0 0 50 24.7
Signed Return t−1,t+5 (basis points) 0.60 -1.38 0 1.97 10.2
Signed Return t−1,t+120 (basis points) 1.89 -15.1 0 18.5 25.6
Turnover t−1,t+5 (basis points) 0.041 0 0 0.084 0.14
Turnover t−1,t+120 (basis points) 0.86 0 0.24 1.81 2.22
Speed of Trade Volume Response (%) 5.80 0 0 16.8 13.9
Return on trading day (%) 0.23 -3.29 0.056 3.92 4.02
Absolute return on trading day (%) 2.48 0.22 1.45 5.65 3.18
Time since last company article (hours) 32.2 0.49 6.42 103.1 57.6
Number of companies in article 2.14 1 1 3 4.30
Composite Sentiment Score 50.0 47 50 52 4.19
Absolute Composite Sentiment Score 2.07 0 2 5 3.65
Neutral Composite Sentiment Score 0.47 0 0 1 0.50
Article category identified 0.35 0 0 1 0.48
Event Sentiment Score 51.8 37 50 67 12.9
Absolute Event Sentiment Score 3.83 0 0 13 6.71
Neutral Event Sentiment Score 0.69 0 1 1 0.46
Past Informativeness 6 month 12FF 1.67 0.58 1.39 3.46 1.15
Past Informativeness 3 month 12FF 1.58 0.41 1.22 3.29 1.23
Past Informativeness 6 month 30FF 1.69 0.39 1.34 3.66 1.46
Number of Observations 321,912

34
Panel B: Comparison between Accurately Classified as Relevant (HRH) vs. Misclassified (HRL)
Standard Deviation
Difference between
HRH and LRH after
fixed effects
T- Statistic
Difference in terms
of Standard
Deviations
Market capitalization ($ million) 37016.1 -921.79 -0.25 -0.0249
Average return prior month (%) 0.65 -0.0319
***
-3.05 -0.04908
Average volatility prior month (%) 17.7 -1.526* -1.70 -0.08621
Average turnover prior month (%) 1.23 -0.0773 -0.94 -0.06285
Average illiquidity prior month (percentile) 26.4 -2.0874 -0.84 -0.07907
Absolute Return t−1,t+120 (basis points) 21.7 -0.3433 -0.77 -0.01582
Turnover t−1,t+120 (basis points) 2.22 0.0731 1.19 0.032928
Return on trading day (%) 4.02 -0.0953 -1.58 -0.02371
Absolute return on trading day (%) 3.18 -0.1242 -0.93 -0.03906
Time since last company article (hours) 57.6 3.32 1.24 0.057639
Number of companies in article 4.30 -0.95*** -3.23 -0.22093
Composite Sentiment Score 4.19 -0.0679 -0.63 -0.01621
Absolute Composite Sentiment Score 3.65 0.0105 0.06 0.002877
Neutral Composite Sentiment Score 0.50 -0.0353 -0.67 -0.0706
Event Sentiment Score 12.9 -0.7440 -1.09 -0.05767
Absolute Event Sentiment Score 6.71 -0.0986
*
-1.77 -0.01469
Neutral Event Sentiment Score 0.46 -0.0020 -0.97 -0.00435

35
Table 4: Overreaction to News Analytics (LRH articles)
This table contains the results of article-level regressions that examine how well the sentiment direction of LRH articles predicts stock returns
before and after the release of RavenPack. In regressions 1 to 3, the dependent variable is the return from 1 second before to 5 seconds after the
article (measured in basis points). In regressions 4 to 6, we study the return from 6 to 120 seconds after the article to determine a potential reversal
of the short run reaction. Returns are based on mid-quotes. The explanatory variable of interest is an interaction between RavenPack Release and
Sentiment Direction. RavenPack Release is a dummy variable equal to 1 during the time in which RavenPack was “live” (April 1, 2009 – September
10, 2012) and equal to 0 before RavenPack was “live” (February1, 2004 – March 31, 2009). Sentiment Direction is a variable indicating the
sentiment of the article derived from RavenPack sentiment indices; it takes the value +1 for positive sentiment, 0 for neutral sentiment and −1 for
negative sentiment. In all regressions we include the following firm specific control variables: Company size, Return prior month, Volatility prior
month, Turnover prior month, Illiquidity prior month. In regressions 2, 3, 5 and 6 we add fixed effects for the article category (e.g. mergers and
acquisitions), the relevance score (from 90 to 100) and the hour during the day in which the article was released. In regressions 3 and 6, we include
absolute return, turnover, and volatility each for industry and market from t−1 to t+5 seconds around the article. All variables are defined in
Appendix 1. All standard errors are clustered at the firm level. T-statistics are below the parameter estimates in parenthesis; ***, **, * indicate
significance at the 1%, 5%, and 10% level, respectively.
Dependent Variable: Return t−1, t+5 Return t+6, t+120
(1) (2) (3) (4) (5) (6)
RavenPack Release * Sentiment Direction 0.465
**
0.533
**
0.563
***
-0.602 -0.666 -0.660
(2.31) (2.48) (2.60) (-1.24) (-1.32) (-1.31)
RavenPack Release -0.252 -0.258 -0.309 -1.739
***
-1.659
***
-1.643
***
(-1.50) (-1.44) (-1.62) (-3.92) (-3.71) (-3.42)
Sentiment Direction 0.258
**
0.098 0.099 1.532
***
1.517
***
1.538
***
(2.28) (0.80) (0.81) (5.10) (4.58) (4.64)
Article category identified -1.177
***
-1.217
***
0.043 -0.316
(-3.14) (-3.04) (0.04) (-0.27)
Time since last article 0.112
**
0.107
**
0.373
***
0.357
***
(2.40) (2.30) (2.91) (2.78)
Number of firms in article -0.179
**
-0.171
**
-0.397
*
-0.415
*
(-2.19) (-2.12) (-1.70) (-1.79)
Number of Observations 20588 20588 20588 20588 20588 20588
R
2
0.003 0.009 0.014 0.007 0.013 0.018
Relevance, Category and Hour Fixed Effects No Yes Yes No Yes Yes
Market control variables No No Yes No No Yes
Firm specific control variables Yes Yes Yes Yes Yes Yes

36
Table 5: Speed of Stock Price Response to News Articles
This table contains the results of article-level regressions that examine the effect of an article covered in RavenPack on stock price, measured by
absolute returns. The dependent variable is Speed of Stock Price Response (in percent) defined as
,
,
,
and
measured in seconds around an article. Returns are based on mid-quotes. The explanatory variable of interest is D(HRH), a dummy variable equal
to 1 if an article was consistently released as highly relevant in both RavenPack versions and 0 if it was originally released as having low relevance
(HRL). In regressions 1 to 3, we estimate the various specification during the time in which RavenPack was “live” (April 1, 2009 – September 10,
2012). In regressions 4 to 6, we run a placebo test for the time period where RavenPack was not yet sold to investors (February1, 2004 – March 31,
2009). In all regressions we include firm and date fixed effects and the following firm specific control variables: Company size, Return prior month,
Volatility prior month, Turnover prior month, Illiquidity prior month. In regressions 2, 3, 5 and 6 we add fixed effects for the article category (e.g.
mergers and acquisitions), the relevance score (from 90 to 100) and the hour during the day in which the article was released. In regressions 3 and
6, we include additional controls: the absolute return, turnover, and volatility each for industry and market and for the two horizons from t−1 to t+5
and t−1 to t+120 seconds around the article. All variables are defined in Appendix 1. All standard errors are clustered at the firm level. T-statistics
are below the parameter estimates in parenthesis; ***, **, * indicate significance at the 1%, 5%, and 10% level, respectively.
Dependent Variable: Speed of Stock Price Response
Main Test - RavenPack is “live” Placebo Test - Before RavenPack is “live”
(1) (2) (3) (4) (5) (6)
D(HRH) 1.469
***
1.333
***
1.321
***
-0.048 -0.058 -0.012
(3.50) (3.15) (3.19) (-0.16) (-0.20) (-0.04)
Absolute Composite Sentiment Score -0.004 -0.002 -0.032
**
-0.032
**
(-0.22) (-0.11) (-2.29) (-2.31)
Neutral Composite Sentiment Score -0.107 -0.115 -0.338
***
-0.357
***
(-0.87) (-0.96) (-3.30) (-3.52)
Article category identified 0.522 1.395 -3.574 -4.141
(0.10) (0.28) (-0.54) (-0.68)
Absolute Event Sentiment Score 0.098
***
0.089
***
0.021
*
0.022
*
(5.13) (4.78) (1.70) (1.85)
Neutral Event Sentiment Score -0.818 -0.958 -1.202
***
-1.150
***
(-1.29) (-1.56) (-2.92) (-2.82)
Time since last article 0.099
***
0.086
**
0.069
***
0.062
**
(2.85) (2.54) (2.72) (2.44)
Number of firms in article -0.060 -0.058 -0.149
***
-0.170
***
(-0.70) (-0.69) (-2.65) (-3.06)
Number of Observations 249065 249065 249065 400303 400303 400303
R
2
0.035 0.039 0.084 0.032 0.033 0.049
Relevance, Category and Hour Fixed Effects No Yes Yes No Yes Yes
Date and Firm Fixed Effects Yes Yes Yes Yes Yes Yes
Market control variables No No Yes No No Yes
Firm specific control variables Yes Yes Yes Yes Yes Yes

37
Table 6: Directional Stock Price Response to Article Sentiment
This table contains the results of article-level regressions that examine how well the sentiment direction of an article predicts the 5-second return
reaction to an article depending on whether the article is covered in RavenPack. The dependent variable is the return from 1 second before to 5
seconds after the article (measured in basis points). Returns are based on mid-quotes. The explanatory variable of interest is an interaction between
D(HRH) and Sentiment Direction. D(HRH) is a dummy variable equal to 1 if an article was consistently released as highly relevant in both
RavenPack versions and 0 if it was originally released as having low relevance (HRL). Sentiment Direction is a variable indicating the sentiment
of the article derived from RavenPack sentiment indices; it takes the value +1 for positive sentiment, 0 for neutral sentiment and −1 for negative
sentiment. In regressions 1 to 3, we estimate the various specification during the time in which RavenPack was “live” (April 1, 2009 – September
10, 2012). In regressions 4 to 6, we run a placebo test for the time period where RavenPack was not yet sold to investors (February1, 2004 – March
31, 2009). In all regressions we include firm and date fixed effects and the following firm specific control variables: Company size, Return prior
month, Volatility prior month, Turnover prior month, Illiquidity prior month. In regressions 2, 3, 5 and 6 we add fixed effects for the article category
(e.g. mergers and acquisitions), the relevance score (from 90 to 100) and the hour during the day in which the article was released. In regressions 3
and 6, we include absolute return, turnover, and volatility each for industry and market from t−1 to t+5 seconds around the article. All variables are
defined in Appendix 1. All standard errors are clustered at the firm level. T-statistics are below the parameter estimates in parenthesis; ***, **, *
indicate significance at the 1%, 5%, and 10% level, respectively.
Dependent Variable: Return t-1, t+5
Main Test - RavenPack is “live” Placebo Test - Before RavenPack is “live”
(1) (2) (3) (4) (5) (6)
D(HRH) * Sentiment Direction 0.407
***
0.452
***
0.452
***
0.081 0.116 0.114
(3.09) (3.39) (3.40) (0.79) (1.10) (1.09)
D(HRH) 0.187
*
0.125 0.125 0.137 0.103 0.102
(1.86) (1.19) (1.18) (1.28) (0.94) (0.93)
Sentiment Direction 0.118 -0.010 -0.009 0.421
***
0.184
*
0.187
*
(0.92) (-0.08) (-0.07) (4.23) (1.81) (1.84)
Article category identified 1.151
**
0.932
*
0.304 0.370
(1.97) (1.86) (0.70) (0.84)
Time since last article 0.043
***
0.043
***
0.237
***
0.239
***
(3.38) (3.40) (13.20) (13.28)
Number of firms in article -0.150
***
-0.145
***
-0.221
***
-0.220
***
(-5.05) (-4.90) (-9.37) (-9.31)
Number of Observations 321860 321860 321860 481939 481939 481939
R
2
0.063 0.066 0.069 0.057 0.062 0.063
Relevance, Category and Hour Fixed Effects No Yes Yes No Yes Yes
Date and Firm Fixed Effects Yes Yes Yes Yes Yes Yes
Market control variables No No Yes No No Yes
Firm specific control variables Yes Yes Yes Yes Yes Yes

38
Table 7: Speed of Trade Volume Response to News Articles
This table contains the results of article-level regressions that examine the effect of an article covered in RavenPack on the market for a stock,
measured by turnover. The dependent variable is Speed of Trade Volume Response (in percent), which is defined as the turnover from 1 second
before the article to 5 second after the article divided by the turnover from 1 second before the article to 120 seconds after the article. The explanatory
variable of interest is D(HRH), a dummy variable equal to 1 if an article was consistently released as highly relevant in both RavenPack versions
and 0 if it was originally released as having low relevance (HRL). In regressions 1 to 3, we estimate the various specification during the time in
which RavenPack was “live” (April 1, 2009 – September 10, 2012). In regressions 4 to 6, we run a placebo test for the time period where RavenPack
was not yet sold to investors (February1, 2004 – March 31, 2009). In all regressions we include firm and date fixed effects and the following firm
specific control variables: Company size, Return prior month, Volatility prior month, Turnover prior month, Illiquidity prior month. In regressions
2, 3, 5 and 6 we add fixed effects for the article category (e.g. mergers and acquisitions), the relevance score (from 90 to 100) and the hour during
the day in which the article was released. In regressions 3 and 6, we include additional controls: the absolute return, turnover, and volatility each
for industry and market and for the two horizons from t−1 to t+5 and t−1 to t+120 seconds around the article. All variables are defined in Appendix
1. All standard errors are clustered at the firm level. T-statistics are below the parameter estimates in parenthesis; ***, **, * indicate significance
at the 1%, 5%, and 10% level, respectively.
Dependent Variable: Speed of Trade Volume Response
Main Test - RavenPack is “live” Placebo Test - Before RavenPack is “live”
(1) (2) (3) (4) (5) (6)
D(HRH) 0.656
***
0.516
**
0.533
**
0.033 -0.002 0.022
(3.12) (2.40) (2.52) (0.24) (-0.02) (0.16)
Absolute Composite Sentiment Score -0.008 -0.006 -0.018
***
-0.017
**
(-0.94) (-0.74) (-2.65) (-2.52)
Neutral Composite Sentiment Score -0.171
**
-0.164
**
-0.085 -0.089
*
(-2.55) (-2.48) (-1.64) (-1.70)
Article category identified -4.034
***
-3.973
***
-0.716 -0.690
(-2.93) (-3.37) (-0.47) (-0.45)
Absolute Event Sentiment Score 0.060
***
0.056
***
0.023
***
0.024
***
(5.70) (5.37) (3.57) (3.70)
Neutral Event Sentiment Score -0.973
***
-1.018
***
-0.394
*
-0.368
*
(-2.84) (-3.01) (-1.82) (-1.71)
Time since last article 0.109
***
0.101
***
0.091
***
0.087
***
(5.74) (5.38) (6.01) (5.83)
Number of firms in article -0.107
***
-0.112
***
-0.168
***
-0.173
***
(-2.61) (-2.75) (-6.35) (-6.55)
Number of Observations 272215 272215 272215 418252 418252 418252
R
2
0.029 0.032 0.059 0.026 0.027 0.038
Relevance, Category and Hour Fixed Effects No Yes Yes No Yes Yes
Date and Firm Fixed Effects Yes Yes Yes Yes Yes Yes
Market control variables No No Yes No No Yes
Firm specific control variables Yes Yes Yes Yes Yes Yes

39
Table 8: The Effect of News Articles on Liquidity
This table contains the results of article-level regressions that examine the effect of an article being covered in RavenPack on illiquidity. In
regressions 1 to 3, the dependent variable is Change in Amihud Illiquidity defined as
,
,
,
in seconds
around the article. In regressions 4 to 6, the dependent variable is Change in Effective Spread defined as
,
,
,
in seconds around the article. The explanatory variable of interest is D(HRH), a dummy variable
equal to 1 if an article was consistently released as highly relevant in both RavenPack versions and 0 if it was originally released as having low
relevance (HRL). In Panel A, we estimate our main specification during the time in which RavenPack was live (April 1, 2009 – September 10,
2012). In Panel B, we run a placebo test in the time period where RavenPack was not yet being sold to investors (February 1, 2004 – March 31,
2009). In all regressions we include firm and date fixed effects and the following firm specific control variables: Company size, Return prior month,
Volatility prior month, Turnover prior month, Illiquidity prior month. In regressions 2, 3, 5 and 6, we add fixed effects for the article category (e.g.
mergers and acquisitions), the relevance score (from 90 to 100) and the hour during the day in which the article was released. In regressions 3 and
6, we include additional controls: the absolute return, turnover, and volatility each for industry and market from t−1 to t+5 seconds around the
article. All variables are defined in Appendix 1. All standard errors are clustered at the firm level. T-statistics are below the parameter estimates in
parenthesis; ***, **, * indicate significance at the 1%, 5%, and 10% level, respectively.
Panel A: Main Specification – RavenPack is “live”
Dependent Variable: Change in Effective Spread Change in Amihud Illiqudity
(1) (2) (3) (4) (5) (6)
D(HRH) 0.009
*
0.013
***
0.013
***
0.016
**
0.014
**
0.014
**
(1.91) (2.76) (2.77) (2.35) (2.03) (1.98)
Absolute Composite Sentiment Score 0.000
**
0.000
**
-0.000 -0.000
(2.15) (2.33) (-0.86) (-0.37)
Neutral Composite Sentiment Score -0.004
***
-0.004
***
0.001 0.001
(-2.80) (-2.84) (0.23) (0.36)
Article category identified -0.120 -0.127 -0.042 -0.039
(-1.47) (-1.50) (-0.49) (-0.45)
Absolute Event Sentiment Score 0.001
***
0.001
***
0.001
**
0.001
**
(3.51) (3.46) (2.29) (2.25)
Neutral Event Sentiment Score -0.017
**
-0.018
**
-0.022
**
-0.023
**
(-2.22) (-2.36) (-2.07) (-2.24)
Time since last article -0.004
***
-0.005
***
0.003
***
0.003
***
(-11.16) (-11.80) (5.09) (3.72)
Number of firms in article 0.014
***
0.014
***
-0.006
***
-0.005
***
(15.02) (15.18) (-4.65) (-4.02)
Number of Observations 252306 252306 252306 115953 115953 115953
R
2
0.162 0.165 0.171 0.095 0.097 0.126
Relevance, Category and Hour Fixed Effects No Yes Yes No Yes Yes
Date and Firm Fixed Effects Yes Yes Yes Yes Yes Yes
Market control variables No No Yes No No Yes
Firm specific control variables Yes Yes Yes Yes Yes Yes

40
Panel B: Placebo Test - Before RavenPack is “live”
Dependent Variable: Change in Effective Spread Change in Amihud Illiqudity
(1) (2) (3) (4) (5) (6)
D(HRH) -0.000 0.005 0.004 0.009 0.007 0.006
(-0.11) (1.62) (1.51) (1.42) (1.13) (1.05)
Absolute Composite Sentiment Score 0.000
***
0.000
***
-0.000 -0.000
(2.90) (2.90) (-1.04) (-0.99)
Neutral Composite Sentiment Score -0.002
**
-0.002
*
-0.005
**
-0.005
**
(-1.99) (-1.94) (-2.24) (-2.21)
Article category identified -0.008 -0.007 0.031 0.020
(-0.14) (-0.12) (0.34) (0.23)
Absolute Event Sentiment Score 0.001
***
0.001
***
0.001
***
0.001
***
(7.59) (7.83) (2.82) (3.11)
Neutral Event Sentiment Score -0.013
***
-0.011
***
-0.005 -0.004
(-3.14) (-2.63) (-0.54) (-0.45)
Time since last article -0.002
***
-0.003
***
0.005
***
0.005
***
(-9.80) (-10.94) (8.63) (7.82)
Number of firms in article 0.008
***
0.008
***
-0.008
***
-0.008
***
(15.63) (14.85) (-7.84) (-8.07)
Number of Observations 411981 411981 411981 178496 178496 178496
R
2
0.156 0.161 0.167 0.070 0.072 0.081
Relevance, Category and Hour Fixed Effects No Yes Yes No Yes Yes
Date and Firm Fixed Effects Yes Yes Yes Yes Yes Yes
Market control variables No No Yes No No Yes
Firm specific control variables Yes Yes Yes Yes Yes Yes

41
Table 9: Directional Stock Price Response conditional on Past Informativeness of
RavenPack
This table contains the results of article-level regressions that examine how well the past performance of RavenPack affects the stock price impact
of RavenPack. The dependent variable is the return from 1 second before to 5 seconds after the article (measured in basis points). Returns are based
on mid-quotes. The explanatory variable of interest is a triple interaction between D(HRH) and Sentiment Direction and Past Informativeness. Past
Informativeness is the average signed return (in basis points) from t-1 to t+120 seconds around articles over the previous 6 month for stocks within
the same industry. D(HRH) is a dummy variable equal to 1 if an article was consistently released as highly relevant in both RavenPack versions
and 0 if it was originally released as having low relevance (HRL). Sentiment Direction is a variable indicating the sentiment of the article derived
from RavenPack sentiment indices; it takes the value +1 for positive sentiment, 0 for neutral sentiment and −1 for negative sentiment. In Panel A,
we estimate our main specification using Past Informativeness measured over the previous six months and using the 12 industry categories of Fama
French. In regressions 1 to 3, we estimate the various specification during the time in which RavenPack was “live” (April 1, 2009 – September 10,
2012). In regressions 4 to 6, we run a placebo test for the time period where RavenPack was not yet sold to investors (February1, 2004 – March 31,
2009). In Panel B, we report a robustness check using 30 FF industry categories (instead of 12) and Past Informativeness measured over the previous
three months (instead of a six). In all regressions we include firm and date fixed effects and the following firm specific control variables: Company
size, Return prior month, Volatility prior month, Turnover prior month, Illiquidity prior month. In regressions 2, 3, 5 and 6, we add fixed effects
for the article category (e.g. mergers and acquisitions), the relevance score (from 90 to 100) and the hour during the day in which the article was
released. In regressions 3 and 6, we add additional controls: the absolute return, turnover, and volatility each for industry and market and for the
two horizons from t−1 to t+5 seconds around the article. Control variables are defined in Appendix 1. All standard errors are clustered at the firm
level. T-statistics are below the parameter estimates in parenthesis; ***, **, * indicate significance at the 1%, 5%, and 10% level, respectively.
Panel A: Main Test
Dependent Variable:
Return t−1, t+5
Main Test - RavenPack is “live” Placebo Test - Before RavenPack is “live”
(1) (2) (3) (4) (5) (6)
Past Informativeness 6 month 12FF * D(HRH)
* Sentiment Direction
0.221
***
0.213
***
0.225
***
-0.178
*
-0.165 -0.168
(2.92) (2.77) (2.85) (-1.71) (-1.60) (-1.63)
Past Informativeness 6 month 12FF *
Sentiment Direction
-0.025 -0.034 -0.049 0.354
***
0.311
***
0.310
***
(-0.35) (-0.46) (-0.65) (3.51) (3.10) (3.10)
Past Informativeness 6 month 12FF * D(HRH) 0.044 0.026 0.037 0.050 0.049 0.051
(0.77) (0.45) (0.63) (0.57) (0.56) (0.58)
D(HRH) * Sentiment Direction 0.020 0.075 0.056 0.497
**
0.507
**
0.512
**
(0.11) (0.42) (0.31) (2.50) (2.51) (2.55)
Past Informativeness 3 month 12FF -0.078 -0.055 -0.145
**
-0.043 -0.031 -0.098
(-1.29) (-0.90) (-2.29) (-0.48) (-0.35) (-1.11)
D(HRH) 0.112 0.083 0.064 0.002 -0.030 -0.037
(0.83) (0.61) (0.46) (0.01) (-0.17) (-0.21)
Sentiment Direction 0.155 0.048 0.075 -0.393
**
-0.531
***
-0.525
***
(0.90) (0.27) (0.42) (-2.04) (-2.71) (-2.69)
Article category identified 1.262
**
1.044
**
0.336 0.422
(2.14) (2.07) (0.76) (0.94)
Time since last article 0.043
***
0.044
***
0.239
***
0.240
***
(3.40) (3.44) (13.12) (13.19)
Number of firms in article -0.152
***
-0.146
***
-0.222
***
-0.220
***
(-5.09) (-4.93) (-9.32) (-9.26)
Number of Observations 321860 321860 321860 472827 472827 472827
R
2
0.064 0.066 0.070 0.058 0.063 0.064
Relevance, Category and Hour Fixed Effects No Yes Yes No Yes Yes
Date and Firm Fixed Effects Yes Yes Yes Yes Yes Yes
Market control variables No No Yes No No Yes
Firm specific control variables Yes Yes Yes Yes Yes Yes

42
Panel B: Robustness check: Different measures of Past Informativeness
Dependent Variable: Return t−1, t+5
(1) (2) (3) (4) (5) (6)
Past Informativeness 6 month 30FF *
D(HRH) * Sentiment Direction 0.305
***
0.313
***
0.319
***
(3.13) (3.21) (3.25)
Past Informativeness 6 month 30FF *
Sentiment Direction -0.152 -0.169
*
-0.178
*
(-1.61) (-1.79) (-1.88)
Past Informativeness 6 month 30FF *
D(HRH) -0.024 -0.028 -0.028
(-0.68) (-0.80) (-0.79)
Past Informativeness 6 month 30FF 0.019 0.026 -0.001
(0.57) (0.78) (-0.03)
Past Informativeness 3 month 12FF *
D(HRH) * Sentiment Direction 0.196
***
0.188
**
0.192
**
(2.66) (2.52) (2.51)
Past Informativeness 3 month 12FF *
Sentiment Direction -0.031 -0.040 -0.044
(-0.44) (-0.56) (-0.60)
Past Informativeness 3 month 12FF *
D(HRH) -0.001 -0.017 -0.006
(-0.02) (-0.32) (-0.12)
Past Informativeness 3 month 12FF -0.063 -0.046 -0.112
**
(-1.23) (-0.87) (-2.07)
D(HRH) * Sentiment Direction -0.133 -0.103 -0.115 0.082 0.137 0.132
(-0.79) (-0.62) (-0.67) (0.47) (0.78) (0.74)
D(HRH) 0.242
**
0.188
*
0.188
*
0.194 0.158 0.141
(2.23) (1.68) (1.66) (1.50) (1.20) (1.06)
Sentiment Direction 0.384
**
0.288
*
0.305
*
0.167 0.058 0.065
(2.36) (1.77) (1.84) (0.98) (0.33) (0.37)
Article category identified 1.253
**
1.036
**
1.240
**
1.029
**
(2.13) (2.05) (2.13) (2.07)
Time since last article 0.043
***
0.043
***
0.043
***
0.044
***
(3.40) (3.43) (3.40) (3.44)
Number of firms in article -0.152
***
-0.146
***
-0.151
***
-0.146
***
(-5.09) (-4.93) (-5.06) (-4.91)
Number of Observations 321860 321860 321860 321860 321860 321860
R
2
0.064 0.066 0.070 0.063 0.066 0.070
Relevance, Category and Hour Fixed Effects No Yes Yes No Yes Yes
Date and Firm Fixed Effects Yes Yes Yes Yes Yes Yes
Market control variables No No Yes No No Yes
Firm specific control variables Yes Yes Yes Yes Yes Yes

43
Table 10: Difference in Difference Analysis
This table contains the results of article-level regressions implementing a difference in difference set-up for our whole sample from February 1,
2004 to September 10, 2012 as a robustness check to tables 3 to 5. In regressions 1 and 2, the dependent variable is Speed of Stock Price Response
(in percent), defined as
,
,
,
and measured in seconds around an article. In regressions 3 and 4, the dependent
variable is Speed of Trade Volume Response (in percent), defined as the turnover from 1 second before the article to 5 second after the article
divided by the turnover from 1 second before the article to 120 seconds after the article. In regressions 1 to 4, the explanatory variable of interest is
the interaction between D(HRH) and RavenPack Release. D(HRH) is a dummy variable equal to 1 if an article was consistently released as highly
relevant in both RavenPack versions and 0 if it was originally released as having low relevance (HRL). RavenPack Release is a dummy variable
taking the value of 1 for articles after RavenPack went “live” on April 1, 2009, and zero otherwise. In regressions 5 and 6, the dependent variable
is the return (in percent) measured from 1 second before to 5 seconds after the article. The explanatory variable of interest is a triple interaction
between HRH, RavenPack Release and Sentiment Direction, where Sentiment Direction is a variable indicating the sentiment of the article derived
from RavenPack sentiment indices. It takes the value +1 for positive sentiment, 0 for neutral sentiment and −1 for negative sentiment. In all
regressions we include firm and date fixed effects and the following firm specific control variables: Company size, Return prior month, Volatility
prior month, Turnover prior month, Illiquidity prior month. In regressions 2, 4, and 6, we add fixed effects for the article category (e.g. mergers
and acquisitions), the relevance score (from 90 to 100) and the hour during the day in which the article was released as well as additional controls:
the absolute return, turnover, and volatility each for industry and market from t−1 to t+5 seconds around the article. In regression 2 and 4, we also
include those values for t−1 to t+120 seconds around the article. All variables are defined in the Appendix. All standard errors are clustered at the
firm level. T-statistics are below the parameter estimates in parenthesis; ***, **, * indicate significance at the 1%, 5%, and 10% level, respectively.
Dependent Variable:
Speed of Stock Price
Response
Speed of Trade Volume
Response
Return t-1, t+5
(1) (2) (3) (4) (5) (6)
RavenPack Release * D(HRH) * Sentiment
Direction
0.336
**
0.330
**
(2.11) (2.06)
RavenPack Release * D(HRH) 1.702
***
1.713
***
0.501
*
0.476
*
0.101 0.109
(3.71) (3.81) (1.71) (1.66) (0.73) (0.77)
RavenPack Release * Sentiment Direction -0.314
**
-0.294
*
(-2.03) (-1.89)
D(HRH) * Sentiment 0.072 0.114
(0.70) (1.09)
D(HRH) -0.053 -0.070 0.082 0.044 0.095 0.025
(-0.19) (-0.25) (0.57) (0.31) (0.95) (0.24)
Sentiment Direction 0.430
***
0.222
**
(4.33) (2.20)
Absolute Composite Sentiment Score -0.025
**
-0.013
**
(-2.38) (-2.52)
Neutral Composite Sentiment Score -0.269
***
-0.111
***
(-3.43) (-2.70)
Absolute Event Sentiment Score 0.044
***
0.035
***
(4.45) (6.24)
Neutral Event Sentiment Score -1.019
***
-0.536
***
(-3.04) (-2.99)
Article category identified -1.660 -2.200
**
0.580
**
(-0.36) (-2.04) (2.13)
Time since last article 0.049
**
0.082
***
0.165
***
(2.43) (7.04) (13.33)
Number of firms in article -0.117
**
-0.136
***
-0.201
***
(-2.49) (-6.15) (-10.98)
Number of Observations 649368 649368 690467 690467 803799 803799
R
2
0.026 0.051 0.019 0.037 0.046 0.052
Relevance, Category and Hour Fixed Effects No Yes No Yes No Yes
Date and Firm Fixed Effects Yes Yes Yes Yes Yes Yes
Market control variables No Yes No Yes No Yes
Firm specific control variables Yes Yes Yes Yes Yes Yes

44
Table 11: Additional Robustness Checks
This table contains the results of different robustness checks. All regressions are at the article-level. In Panel A, we implement an alternative Placebo
test which excludes the financial crisis and only includes the time period from February 1, 2004 to December 31, 2007 before RavenPack was
“live”. In Panel B, we implement an alternative Placebo test which excludes the time period before the introduction of Regulation NMS. It includes
the time period from July 10, 2008 to April 1, 2009 before RavenPack was “live”. In Panel C, we implement a robustness test, in which we include
only the time when RavenPack 1 was active, i.e. from April 1, 2009 to July 6, 2011. In all cases, the dependent variable in Regressions 1 and 2 is
Speed of Stock Price Response (in percent) defined as
,
,
,
. In Regressions 3 and 4, the dependent variable is Speed
of Trade Volume Response (in percent), defined as the turnover from 1 second before the article to 5 seconds after the article divided by the turnover
from 1 second before the article to 120 seconds after the article. In Regressions 1 to 4, the explanatory variable of interest is D(HRH), a dummy
variable equal to 1 if an article was consistently released as highly relevant in both RavenPack versions and 0 if it was originally released as having
low relevance (HRL). In Regressions 5 and 6, the dependent variable is the return (measured in basis points) from 1 second before to 5 seconds
after the article. In Regressions 5 and 6, the explanatory variable of interest is an interaction between D(HRH) and Sentiment Direction, where
Sentiment Direction is a variable indicating the sentiment of the article derived from RavenPack sentiment indices. It takes the value +1 for positive
sentiment, 0 for neutral sentiment and −1 for negative sentiment. In all regressions we include firm and date fixed effects and the following firm
specific control variables: Company size, Return prior month, Volatility prior month, Turnover prior month, Illiquidity prior month. In regressions
2, 4, and 6, we add fixed effects for the article category (e.g. mergers and acquisitions), the relevance score (from 90 to 100) and the hour during
the day in which the article was released as well as additional controls: the absolute return, turnover, and volatility each for industry and market
from t−1 to t+5 seconds around the article. In regression 2 and 4, we also include those values for t−1 to t+120 seconds around the article. All
variables are defined in Appendix 1. All standard errors are clustered at the firm level. T-statistics are below the parameter estimates in parenthesis;
***, **, * indicate significance at the 1%, 5%, and 10% level, respectively.
Panel A: Alternative Placebo Test – Pre-RavenPack “live”, excluding the Financial Crisis
Dependent Variable:
Speed of Stock Price
Response
Speed of Trade Volume
Response
Return t-1, t+5
(1) (2) (3) (4) (5) (6)
RavenPack Release * D(HRH) 0.065 0.100
(0.62) (0.93)
D(HRH) -0.039 0.004 0.013 0.028 0.235
**
0.212
*
(-0.12) (0.01) (0.08) (0.18) (2.16) (1.91)
Sentiment Direction 0.383
***
0.108
(3.82) (1.04)
Absolute Composite Sentiment Score -0.032
**
-0.013
*
(-2.05) (-1.67)
Neutral Composite Sentiment Score -0.384
***
-0.050
(-3.35) (-0.84)
Absolute Event Sentiment Score 0.010 0.011
(0.75) (1.43)
Neutral Event Sentiment Score -1.087
**
-0.558
**
(-2.39) (-2.25)
Article category identified -12.770
***
-1.544 0.514
(-9.24) (-0.96) (1.39)
Time since last article 0.066
**
0.091
***
0.275
***
(2.29) (5.31) (13.35)
Number of firms in article -0.065 -0.120
***
-0.198
***
(-1.03) (-4.03) (-7.53)
Number of Observations 318018 318018 332238 332238 386563 386563
R
2
0.031 0.043 0.030 0.039 0.070 0.077
Relevance, Category and Hour Fixed Effects No Yes No Yes No Yes
Date and Firm Fixed Effects Yes Yes Yes Yes Yes Yes
Market control variables No Yes No Yes No Yes
Firm specific control variables Yes Yes Yes Yes Yes Yes

45
Panel B: Alternative Placebo Test – Pre-RavenPack “live”, excluding pre Regulation NMS period
Dependent Variable:
Speed of Stock Price
Response
Speed of Trade Volume
Response
Return t-1, t+5
(1) (2) (3) (4) (5) (6)
RavenPack Release * D(HRH) 0.144 0.164
(0.48) (0.55)
D(HRH) 0.349 0.047 0.337 0.144 -0.086 -0.096
(0.53) (0.07) (1.35) (0.57) (-0.32) (-0.35)
Sentiment Direction 0.502
*
0.338
(1.69) (1.15)
Absolute Composite Sentiment Score -0.048
*
-0.030
***
(-1.89) (-2.78)
Neutral Composite Sentiment Score -0.408
**
-0.162
*
(-2.18) (-1.85)
Absolute Event Sentiment Score 0.060
***
0.055
***
(2.68) (4.87)
Neutral Event Sentiment Score -1.976
***
-0.234
(-2.58) (-0.63)
Article category identified 4.962 -0.697 -0.629
(0.40) (-0.26) (-0.49)
Time since last article 0.091
*
0.082
***
0.111
***
(1.90) (3.13) (4.40)
Number of firms in article -0.739
***
-0.449
***
-0.201
***
(-6.77) (-9.30) (-4.48)
Number of Observations 123039 123039 128309 128309 142920 142920
R
2
0.061 0.095 0.065 0.090 0.083 0.087
Relevance, Category and Hour Fixed Effects No Yes No Yes No Yes
Date and Firm Fixed Effects Yes Yes Yes Yes Yes Yes
Market control variables No Yes No Yes No Yes
Firm specific control variables Yes Yes Yes Yes Yes Yes
Panel C: Old RavenPack Definition: RavenPack 1.0 versus RavenPack 2.0
Dependent Variable:
Speed of Stock Price
Response
Speed of Trade Volume
Response
Return t-1, t+5
(1) (2) (3) (4) (5) (6)
RavenPack Release * D(HRH) 0.720
***
0.744
***
(3.80) (3.94)
D(HRH) 1.176
**
1.194
**
0.728
***
0.622
**
0.114 0.114
(2.25) (2.30) (2.71) (2.31) (0.72) (0.70)
Sentiment Direction 0.031 -0.123
(0.16) (-0.66)
Absolute Composite Sentiment Score 0.046
*
0.018
(1.83) (1.45)
Neutral Composite Sentiment Score -0.110 -0.062
(-0.63) (-0.67)
Absolute Event Sentiment Score 0.094
***
0.049
***
(4.31) (4.08)
Neutral Event Sentiment Score -0.956 -1.389
***
(-1.29) (-3.31)
Article category identified -3.757 -4.385
***
0.814
(-1.34) (-3.29) (1.40)
Time since last article 0.151
***
0.149
***
0.092
***
(3.09) (5.75) (4.47)
Number of firms in article -0.147 -0.231
***
-0.175
***
(-1.29) (-4.41) (-4.09)
Number of Observations 123617 123617 137602 137602 160336 160336
R
2
0.050 0.096 0.054 0.084 0.090 0.097
Relevance, Category and Hour Fixed Effects No Yes No Yes No Yes
Date and Firm Fixed Effects Yes Yes Yes Yes Yes Yes
Market control variables No Yes No Yes No Yes
Firm specific control variables Yes Yes Yes Yes Yes Yes

46
Table 12: Alternative Length of Event Window
This table contains the results of robustness check to Tables 4, 5 and 7 using a different lengths for short and long term reactions. We estimate the
various specification during the time in which RavenPack was “live” (April 1, 2009 – September 10, 2012). Panel A provides a robustness check
to Table 4 and thus the dependent variable is Speed of Stock Price Response (in percent). In the main specification, this variable is defined as
,
,
,
. In Regressions 1 and 2 we instead define it as
,
,
,
. In Regressions 3 and
4 as
,
,
,
and in Regressions 5 and 6 as
,
,
,
. Panel B provides a robustness
check to Table 5 and thus the dependent variable is Speed of Trade Volume Response (in percent). In the main specification, this variable is defined
as
,
,
. In Regressions 1 and 2 we instead define it as
,
,
. In Regressions 3 and 4 as
,
,
and in Regressions
5 and 6 as
,
,
. Panel C provides a robustness check to Table 7. In Table 7, we examine how well the sentiment direction of an article
predicts the 5-second return reaction to an article depending on whether the article is covered in RavenPack. In Panel C, we use the 10-second
return reaction instead. Whenever market control variables is indicated as “Yes”, we include as additional controls: the absolute return, turnover,
and volatility each for industry and market for the respective horizons used as dependent variables. All variables are defined in Appendix 1. All
standard errors are clustered at the firm level. T-statistics are below the parameter estimates in parenthesis; ***, **, * indicate significance at the
1%, 5%, and 10% level, respectively.
Panel A: Speed of Stock Price Response
Window Length: 10 sec/120 sec 5 sec/300 sec 10 sec/300 sec
(1) (2) (3) (4) (5) (6)
D(HRH) 1.906
***
1.797
***
1.281
***
1.184
***
1.733
***
1.671
***
(3.79) (3.58) (4.17) (3.92) (4.44) (4.33)
Absolute Composite Sentiment Score -0.018 -0.008 -0.022
(-0.94) (-0.69) (-1.50)
Neutral Composite Sentiment Score -0.201 -0.112 -0.207
*
(-1.41) (-1.28) (-1.93)
Article category identified -5.309 -1.584 -7.592
(-0.88) (-0.32) (-1.58)
Absolute Event Sentiment Score 0.106
***
0.083
***
0.100
***
(5.16) (5.63) (6.10)
Neutral Event Sentiment Score -0.449 -1.052
**
-0.833
(-0.63) (-2.17) (-1.49)
Time since last article 0.123
***
0.091
***
0.106
***
(3.15) (3.63) (3.62)
Number of firms in article 0.138 0.031 0.097
(1.38) (0.48) (1.30)
Number of Observations 249064 249064 279646 279646 279645 279645
R
2
0.034 0.084 0.037 0.083 0.039 0.087
Relevance, Category and Hour Fixed Effects No Yes No Yes No Yes
Date and Firm Fixed Effects Yes Yes Yes Yes Yes Yes
Market control variables No Yes No Yes No Yes
Firm specific control variables Yes Yes Yes Yes Yes Yes

47
Panel B: Speed of Trade Volume Response
Window Length: 10 sec/120 sec 5 sec/300 sec 10 sec/300 sec
(1) (2) (3) (4) (5) (6)
D(HRH) 0.754
***
0.603
**
0.336
***
0.256
**
0.511
***
0.418
***
(2.61) (2.09) (3.20) (2.40) (3.43) (2.82)
Absolute Composite Sentiment Score -0.023
**
-0.004 -0.014
**
(-2.18) (-0.95) (-2.35)
Neutral Composite Sentiment Score -0.337
***
-0.114
***
-0.232
***
(-3.92) (-3.24) (-4.87)
Article category identified -1.556 -2.015
***
-0.283
(-0.40) (-3.63) (-0.11)
Absolute Event Sentiment Score 0.073
***
0.044
***
0.062
***
(5.86) (6.77) (7.88)
Neutral Event Sentiment Score -1.047
**
-0.606
***
-0.569
**
(-2.46) (-2.90) (-2.18)
Time since last article 0.133
***
0.062
***
0.084
***
(5.45) (6.01) (6.34)
Number of firms in article -0.153
***
-0.075
***
-0.119
***
(-2.89) (-3.53) (-4.19)
Number of Observations 272215 272215 293804 293804 293804 293804
R
2
0.031 0.064 0.033 0.055 0.037 0.061
Relevance, Category and Hour Fixed Effects No Yes No Yes No Yes
Date and Firm Fixed Effects Yes Yes Yes Yes Yes Yes
Market control variables No Yes No Yes No Yes
Firm specific control variables Yes Yes Yes Yes Yes Yes
Panel C: Directional Stock Price Response to Article Sentiment
Dependent Variable: Return t-1, t+10
(1) (2) (3)
D(HRH) * Sentiment Direction 0.418
**
0.480
***
0.487
***
(2.33) (2.66) (2.69)
D(HRH) 0.333
**
0.221 0.229
(2.05) (1.32) (1.36)
Sentiment Direction 0.297
*
0.154 0.149
(1.68) (0.87) (0.84)
Article category identified 0.951 0.774
(1.61) (1.47)
Time since last article 0.077
***
0.077
***
(4.91) (4.92)
Number of firms in article -0.208
***
-0.204
***
(-5.60) (-5.51)
Number of Observations 321860 321860 321860
R
2
0.067 0.070 0.072
Relevance, Category and Hour Fixed Effects No Yes Yes
Date and Firm Fixed Effects Yes Yes Yes
Market control variables No No Yes
Firm specific control variables Yes Yes Yes

48
Appendix 1: Variable Definitions
This table displays the variable definitions for all variables used in the regressions. Article variables (sentiment scores, relevant scores, etc.) are based on RavenPack 3. When we winsorize, we set outliers
to the allowed extreme value; e.g., “smaller 10” means that any value below 10 is set to 10. For all variables, winsorizing affects less than 1% of observations on either side.
Variable Name Definition Winsorizing
HRH High relevance article Released as High relevance article. Dummy variable equal to 1 if an article has a relevance of 90 or
higher in both RavenPack versions. When used in regressions, it is equal to 0 if an article has a relevance score of 90 or higher
in the new RavenPack version (RavenPack 3), but was not covered or had a relevance score below 90 in the old RavenPack
version. (the old RavenPack version is RavenPack 1 until July 6, 2011 and RavenPack 2 afterwards).
None
HRL High relevance article Released as Low relevance article. Dummy variable equal to 1 if an article has a relevance score of 90 or
higher in the new RavenPack version (RavenPack 3), but was not covered or had a relevance score below 90 in the old
RavenPack version. (the old RavenPack version is RavenPack 1 until July 6, 2011 and RavenPack 2 afterwards).
None
LRH Low relevance article Released as High relevance article. Dummy variable equal to 1 if an article has a relevance score below 90
or is not covered in the new RavenPack version (RavenPack 3), but had a Relevance Score greater or equal than 90 in the old
RavenPack version. (the old RavenPack version is RavenPack 1 until July 6, 2011 and RavenPack 2 afterwards).
None
Company size Log(prior day closing price * shares outstanding) Smaller 10
Volatility prior month Average squared return of the stock in the prior 20 trading days Larger 200%
Turnover prior month Average volume divided by shares outstanding in the prior 20 trading days Larger 100%
Return prior month Average return in the prior 20 trading days Larger 3%
& Smaller -3%
Illiquidity prior month
Percentile rank of all article-firm combinations of a day according to AmihudIlliqudity
mean
. The most illiquid firms are assigned 100 the most liquid 1.
None
Relevance Score provided by RavenPack that indicates the relevance of an article to a company and takes values from 0 (least relevant) to
100 (most relevant).
Event Sentiment Score Sentiment score that is provided by RavenPack; takes a value from 100 (positive) to 0 (negative). It is available only for articles
for which the category is identified.
None
Absolute Event Sentiment Score Abs (Event Sentiment Score – 50) None
Neutral Event Sentiment Score Dummy variable equal to 1 if Event Sentiment Score equals 50 or if it is missing. None
Composite Sentiment Score Sentiment score that is provided by RavenPack; takes a value from 100 (positive) to 0 (negative). It is available for each article. None
Absolute Composite Sentiment Score Abs (Composite Sentiment Score – 50) None
Neutral Composite Sentiment Score Dummy variable equal to 1 if Composite Sentiment Score equals 50. None
Article category identified Dummy variable equal to 1 if the category (e.g. “merger”) of the article is identified None
Number of firms in article Log ( Number of firms in article) None
Time since last article Log (Time since last article in seconds) None
Sentiment Direction Variable indicating the sentiment of the article based on RavenPack sentiment indices. It can take the values 1 (positive
sentiment), 0 (neutral sentiment) and −1 (negative sentiment). It is first based on Event Sentiment Score (ESS). If ESS is larger
50, this variable is 1, if ESS is smaller than 50, it is −1. If ESS is missing or 50, we consult Composite Sentiment Score (CSS). If
CSS is greater than 50 we set this variable to 1, if CSS is smaller than 50 we set it to −1, if CSS equals 50 we set it to zero.
None
Return t-1, t+5 Stock return from 1 second before to 5 seconds after the article. Returns are computed from mid-quotes. Larger 2%, smaller -2%
Return t+6, t+120 Stock return from 6 seconds after to 120 seconds after the article. Returns are computed from mid-quotes. Larger 2%, smaller -2%

49
Speed of Stock Price Response
1,5
1, 5
6, 120
None
Speed of Stock Price Response –
Market Adjusted
1, 5
1, 5
6, 120
Set to missing if:
1,5
6, 120 = 0.
None
Speed of Stock Price Response –
Industry Adjusted
1, 5
1, 5
6, 120
Set to missing if:
1,5
6, 120 = 0.
None
Speed of Trade Volume Response
1, 5
1, 120
None
∑
|
|
, where r
it
is the return for stock i during second t; dolvol
it
is the dollar volume for stock i during second t;
and N
ij
is the number of seconds in which stock i traded during interval j.
Larger 2
∑
∗
, where buys
it
(sells
it
) is the number of stocks bought
(sold) for stock i during second t;
is the last execution price for stock i during second t;
is the last bid-ask
midpoint for stock i during second t and Nij is the number of seconds in which stock i traded during interval j.
Larger 3
Change in Amihud Illiquidity
,
,
,
None
Change in Effective Spread
,
,
,
insecondsaroundthe article.
None
Signed Return t-1, t+120
,
∗
This variable is set to missing if Sentiment Direction is equal to zero.
Larger 2%
Past Informativeness 6 month 12FF
,
, the mean is taken over the prior six calendar months within the same industry following 12
Fama French industry classification
None
Past Informativeness 3 month 12FF Same definition as Past Informativeness 6 month 12FF, but using 3 month instead of 6 month. None
Past Informativeness 6 month 30FF Same definition as Past Informativeness 6 month 12FF, but using 30 Fama French industry classification instead of 12 Fama
French industry classification.
None
Market return t-1, t+5 Value-weighted return of all common stocks in TAQ (which are also in CRSP) from 1 second before to 5 seconds after the article.
Returns are computed from mid-quotes.
None
Industry return t-1, t+5 Value-weighted return of all common stocks in the same 12 Fama French Industry from 1 second before to 5 seconds after the
article. Returns are computed from mid-quotes.
None
Market turnover t-1, t+5 Total dollar trading volume of all common stocks in TAQ (which are also in CRSP) from 1 second before to 5 seconds after the
article divided by total market capitalization at t-2.
None
Market volatility t-1, t+5 Value weighted average squared second return of all common stocks in TAQ (which are also in CRSP) averaged from 1 second
before to 5 seconds after the article.
Larger 20 bp
Market adjusted return t-1, t+5 Return (t-1, t+5) − Market Return (t-1, t+5) Larger 2%, smaller -2%
Industry adjusted return t-1, t+5 Return (t-1, t+5) − Industry Return (t-1, t+5) Larger 2%, smaller -2%

50
Appendix 2: Intraday Market and Industry Returns
We compute second-by-second value-weighted average returns, trading volume, and value weighted
average volatility for the market and for 12 industry indices (as defined by Fama and French).
17
In
constructing these indices, we use information from the CRSP daily file, the TAQ National Best Bid and
Offer (NBBO) file provided by WRDS for second-by-second quotes and the TAQ trades file. We link TAQ
to CRSP using ticker symbols. We include in our sample all stocks that are covered in CRSP and TAQ and
have share codes of 10 or 11 in CRSP. We assign stocks to industry indexes using CRSP SIC codes (data
item SICCD) with lists obtained from Ken French’s website. At the quote and trade level we apply the
following filters: We exclude all trades with zero size, negative prices, TAQ Correction Code not equal to
0, and bid-ask quotes where the bid is above the ask. In addition, we exclude all quotes where the bid-ask
spread is larger than 30%.
Most stocks do not have quotes available for every second. Some stocks are relatively illiquid and only
have valid quotes every few minutes. To be able to compute the first return of the day, we need past quotes.
The closing quotes of the prior day are problematic in that (1) they often are not prices at which market
makers would actually be willing to trade, and (2) they are informationally “stale” as they do not incorporate
information released overnight. Therefore, we use the time from 9:00 to 9:35 as a burn-in period and use
the last valid bid-ask midquote of this time period as the initial price to compute the first return. We exclude
from the sample for that specific day all stocks that do not have a quote in this time period. We also exclude
stocks for which the midpoint of the initial quote is below $1 and for which this initial quote has a bid ask
spread of more than 10%.
18
This way we insure that our index is not driven by outliers due to large bid-ask
spreads.
We compute value-weighted average returns for the market and the 12 Fama French industry indices
by computing the second-to-second change in aggregate market capitalization for the respective samples.
We compute a company’s market capitalization by multiplying the bid-ask midpoint by the shares
outstanding from CRSP.
19
We use bid-ask midpoints rather than transaction prices to avoid bid-ask bounce.
We compute aggregate trading volume per second by summing the individual stock dollar trading volume
per second for all stocks in the respective samples. A stock’s trading volume is equal to number of shares
traded during the second multiplied by the transaction prices of the trades. We compute value-weighted
17
Thanks to the technical personnel at WRDS, especially Mark Keintz, for making the construction of these indexes
possible. The composition of the industry indexes are from Ken French’s Website.
18
The difference between the cut-off for the initial spread (10%) and the general spread cut-off (30%) is intended.
We only want to include stocks for which a typical spread is below 10% and for these stocks we treat any quote with
a spread above 30% as an outlier that needs to be removed.
19
Since the index composition changes day to day, we are not able to compute an overnight return. This is no
problem as we are only interested in intra-day returns.
51
average volatility for the market and for the 12 Fama French industries based on squared second-by-second
returns. The value weights are based on the firm’s market capitalization at the end of the prior day using
the closing price and shares outstanding in CRSP. Individual stock returns used to compute value-weighted
average volatility are based on the second-by-second change in bid-ask midpoints. If there is no quote for
a second, the return is set to 0. If the return is larger than 10%, it is set to 10%. We verify that all our filters
affect only a small number of firms or quotes.

52
Appendix 3: Verify that Past Informativeness predicts Informativeness
This table contains the results of article-level regressions that examine how well the sentiment direction of an article predicts the 120-second return
reaction to an article depending on Past Informativeness. The dependent variable is the return from 1 second before to 120 seconds after the article
(measured in basis points). Returns are based on mid-quotes. The explanatory variable of interest is an interaction between Sentiment Direction and
Past Informativeness. Sentiment Direction is a variable indicating the sentiment of the article derived from RavenPack sentiment indices; it takes
the value +1 for positive sentiment, 0 for neutral sentiment and −1 for negative sentiment. Past Informativeness is the average signed return (in
basis points) from t-1 to t+120 seconds around articles over the previous 6 months (or 3 months) for stocks within the same industry. We use either
the 12 industry categories of Fama French or the 30 industry categories of Fama French. In all regressions we include firm and date fixed effects
and the following firm specific control variables: Company size, Return prior month, Volatility prior month, Turnover prior month, Illiquidity prior
month. We also include fixed effects for the article category (e.g. mergers and acquisitions), the relevance score (from 90 to 100) and the hour
during the day in which the article was released and absolute return, turnover, and volatility each for industry and market from t−1 to t+120 seconds
around the article. All variables are defined in Appendix 1. All standard errors are clustered at the firm level. T-statistics are below the parameter
estimates in parenthesis; ***, **, * indicate significance at the 1%, 5%, and 10% level, respectively.
Dependent Variable: Return t-1, t+120
(1) (2) (3) (4)
Past Informativeness 6 month 12FF * Sentiment Direction 0.627
***
(13.61)
Past Informativeness 6 month 30FF * Sentiment Direction 0.476
***
(11.65)
Past Informativeness 3 month 12FF * Sentiment Direction 0.525
***
(12.81)
Sentiment Direction 1.923
***
0.638
***
0.941
***
0.858
***
(32.04) (7.00) (10.71) (10.16)
Past Informativeness 6 month 12FF -0.005
(-0.09)
Past Informativeness 6 month 30FF -0.027
(-0.79)
Past Informativeness 3 month 12FF -0.062
(-1.44)
Article category identified 0.593 0.821 0.894 0.762
(0.26) (0.37) (0.40) (0.35)
Time since last article 0.503
***
0.503
***
0.502
***
0.502
***
(17.69) (17.64) (17.62) (17.62)
Number of firms in article -0.544
***
-0.562
***
-0.558
***
-0.559
***
(-10.62) (-10.85) (-10.81) (-10.80)
Number of Observations 803799 794687 794687 794687
R
2
0.043 0.044 0.044 0.044
Relevance, Category and Hour Fixed Effects Yes Yes Yes Yes
Date and Firm Fixed Effects Yes Yes Yes Yes
Market control variables Yes Yes Yes Yes
Firm specific control variables Yes Yes Yes Yes
53
Appendix 4: Examples of HRL and LRH articles
Below, we give examples of articles where different RavenPack versions disagree. We report the name of
the company that the article is associated with, date and time of the article and the Relevance, Sentiment
Direction and Category information both in the Old RavenPack and in New RavenPack. We also report the
stock price response in seconds around the article as well as the article’s headline and body.
We provide two examples of HRL articles. Example A constitutes an article that was assigned to Associated
Bank in both versions, but while New RavenPack assigned the maximum relevance of 100, Old RavenPack
only assigned a lower Relevance of 61. This difference comes from the fact that New RavenPack correctly
identifies this article as a positive earnings release while Old RavenPack cannot determine its category.
However, both versions agree on the article being positive. The stock price reaction to this article is slow.
There is no price update in the first 8 seconds after the article and most of the stock price response happens
after about 60 seconds.
Example B constitutes a different type of HRL article, where the versions disagree about identifying the
company. New RavenPack assigns this article to Internet Capital Group, while Old RavenPack did not
realize that this article is about this company. The article is a buyback announcement, which is both relevant
and positive news to the company. Accordingly, New RavenPack gives it a high Relevance and a positive
Sentiment Direction. In the stock price reaction we can see that the information is only slowly incorporated
into prices and that there is not stock price response until about 30 seconds after the article.
As comparison, we present an HRH article in Example C. This article is a buyback announcement for
Genzyme Corporation. In both RavenPack versions it is identified as a relevant and positive article for this
company. A large part of the stock price reaction takes place in the first 5 seconds after the article.
Example D constitutes an LRH article. Both RavenPack versions assign this article to Netsuite. However,
they disagree about the relevance. While Old RavenPack assigns it a high Relevance of 96, New RavenPack
assigns only a 20. Reading the article, we realize that this story is mainly about another company (Suite
Cloud) and that this story seems not very relevant to Netsuite. Still, we see an immediate stock price reaction
of Netsuite, which is partially corrected after 30 seconds.

54
A. High-relevance article Released as Low-relevance article (HRL) – Example One
Company: ASSOCIATED BANC-CORP.
Date and Time: 13:18:03 on April 16, 2009
Relevance Score Sentiment Direction Category
Old RavenPack 61 Positive N/A
New RavenPack 100 Positive earnings-per-share-
positive
Headline: PRESS RELEASE: Associated Reports First Quarter Earnings of $0.28 Per Common Share, Up
from $0.11 for the Fourth Quarter of 2008
Article body:
GREEN BAY, Wis.--(BUSINESS WIRE)--April 16, 2009--
Associated Banc-Corp (NASDAQ: ASBC):
-- Net income available to common shareholders was $35.4 million for the first quarter
compared to $13.6 million for the fourth quarter of 2008
-- Net interest income for the quarter was $189.3 million compared to $191.8 million for the
fourth quarter of 2008
-- Total deposits grew by 4.7% to $15.9 billion at March 31, 2009 compared to $15.2 billion
at December 31, 2008 and were up 14.3% from $13.9 billion at March 31, 2008
-- Mortgage loans originated for sale exceeded $1 billion during the quarter
-- Provision for loan losses of $105.4 million exceeded net charge offs of $57.6 million by
$47.8 million, increasing allowance for loan losses to 1.97% of loans at March 31, 2009, up from
1.63% at December 31, 2008
-- Tangible common equity ratio remained stable at 6.10%
-- Quarterly dividend reduced to $0.05 per common share to preserve capital
(article continues for several pages and is cut here)
15.9
16
16.1
16.2
16.3
16.4
16.5
16.6
16.7
‐300 306090120
StockPrice
AssociatedBanc‐Corp.
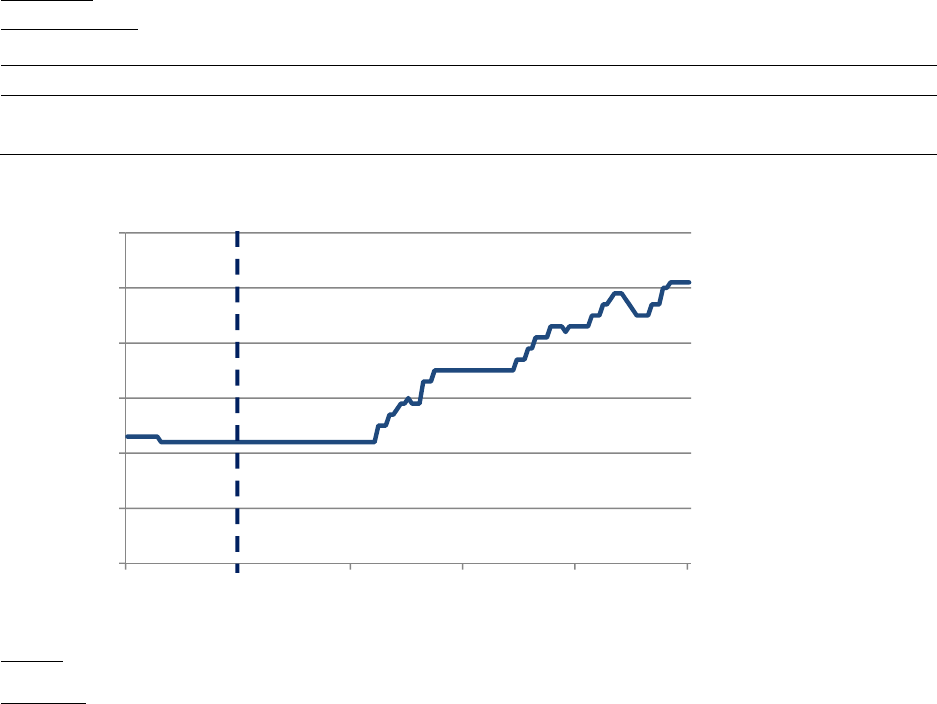
55
B. High-relevance article Released as Low-relevance article (HRL) – Example Two
Company: INTERNET CAPITAL GROUP INC.
Date and Time: 14:22:29 on January 7, 2010
Relevance Score Sentiment Direction Category
Old RavenPack N/A N/A N/A
New RavenPack 100 Positive buybacks
Headline: *DJ Internet Cap Grp Repurchased 400,000 Shrs In Qtr Ended Dec 31
Article body:
(MORE TO FOLLOW) Dow Jones Newswires (212-416-2400)
6.35
6.4
6.45
6.5
6.55
6.6
6.65
‐300 306090120
StockPrice
InternetCapitalGroup
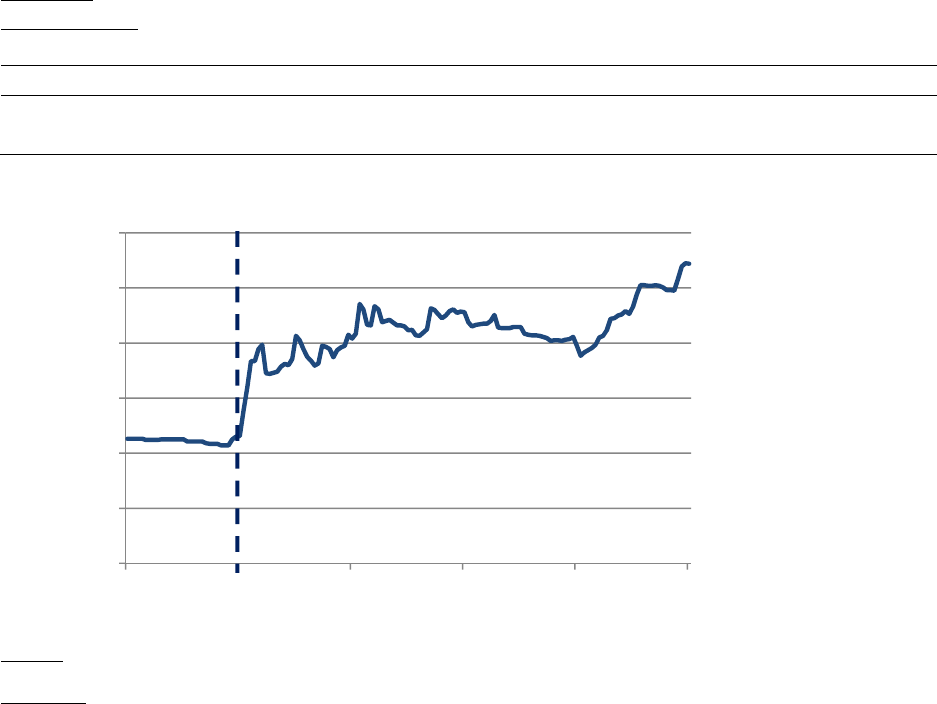
56
C. High-relevance article Released as High-relevance article (HRH)
Company: GENZYME CORPORATION
Date and Time: 13:15:02 on May 6, 2010
Relevance Score Sentiment Direction Category
Old RavenPack 100 Positive buybacks
New RavenPack 100 Positive buybacks
Headline: *PRESS RELEASE: Genzyme Announces $2 Billion Stock Repurchase
Article body:
Company Will Explore Strategic Alternatives for Three Businesses
New Initiatives Part of Plan for Growth Through 2015
CAMBRIDGE, Mass.--(BUSINESS WIRE)--May 06, 2010--
Genzyme Corp. (NASDAQ: GENZ) today announced that its Board of Directors has voted to pursue several
actions to increase shareholder value. The company will initiate a $2 billion stock buyback, under
which $1 billion of stock will be repurchased in the near term and financed with debt. The additional
$1 billion of stock will be repurchased during the next 12 months.
The company also plans to pursue strategic alternatives for its Genetic testing, Diagnostic products
and Pharmaceutical intermediates businesses. Options could include divestiture, spin-out, or
management buy-out.
(article continues for several pages and is cut here)
51
51.5
52
52.5
53
53.5
54
‐300 306090120
StockPrice
GenzymeCorporation.

57
D. Low-relevance article Released as High-relevance article (LRH)
Company: NETSUITE INC.
Date and Time: 10:28:15 on May 23, 2012
Relevance Score Sentiment Direction Category
Old RavenPack 96 Positive N/A
New RavenPack 20 Positive N/A
Headline: PRESS RELEASE: SPS Commerce Named SuiteCloud Developer Network Partner of the Year by
NetSuite
Article body:
MINNEAPOLIS, May 23, 2012 (GLOBE NEWSWIRE) -- SPS Commerce (Nasdaq:SPSC), a leading provider of
on-demand supply chain management solutions, today announced that it has been named NetSuite's
SuiteCloud Developer Network Partner for 2012. This award was given to SPS Commerce at SuiteWorld
2012 in San Francisco.
"We are honored to be recognized with this distinguished honor by NetSuite," said Archie Black,
CEO of SPS Commerce. "Our companies have worked together since 2007 to bring cloud-based
solutions to companies across the globe. Our joint customers are leveraging integrated solutions
to advance their e-commerce, retail and logistics operations. We would like to congratulate our
partners, Celigo, Retail Anywhere and Forward Hindsight, which also received awards from NetSuite
at SuiteWorld."
Pre-wired to integrate directly with NetSuite, SPS Commerce's cloud-based supply chain services
improve the way suppliers, retailers, distributors and 3PLs build their trading partner
relationships and manage and fulfill orders with pre-built integrations using 3,000 order
management models across 1,500 retailers, grocers and distributors. SPS' Retail Universe, a
social network for the supply chain, is designed to help the community's 40,000 members form new
business partnerships based on product or integration requirements.
45.3
45.35
45.4
45.45
45.5
45.55
‐300 306090120
StockPrice
Netsuite
