
30 October 2023
ESMA50-524821-2954
0
ESMA TRV Risk Analysis Orderly Markets
Evolution of EEA share market
structure since MiFID II

ESMA TRV Risk Analysis 30 October 2023 2
ESMA Report on Trends, Risks and Vulnerabilities Risk Analysis
© European Securities and Markets Authority, Paris, 2023. All rights reserved. Brief excerpts may be reproduced or translated provided the source
is cited adequately. The reporting period for this Report is 1 January 2019 to 31 December 2022, unless otherwise indicated. Legal reference for
this Report: Regulation (EU) No. 1095/2010 of the European Parliament and of the Council of 24 November 2010 establishing a European
Supervisory Authority (European Securities and Markets Authority), amending Decision No 716/2009/EC and repealing Commission Decision
2009/77/EC, Article 32 ‘Assessment of market developments, including stress tests’, ‘1. The Authority shall monitor and assess market developments
in the area of its competence and, where necessary, inform the European Supervisory Authority (European Banking Authority), and the European
Supervisory Authority (European Insurance and Occupational Pensions Authority), the European Systemic Risk Board, and the European
Parliament, the Council and the Commission about the relevant micro-prudential trends, potential risks and vulnerabilities. The Authority shall include
in its assessments an analysis of the markets in which financial market participants operate and an assessment of the impact of potential market
developments on such financial market participants.’ The information contained in this publication, including text, charts and data, exclusively serves
analytical purposes. It does not provide forecasts or investment advice, nor does it prejudice, preclude or influence in any way past, existing or future
regulatory or supervisory obligations by market participants. The charts and analyses in this report are, fully or in part, based on data not proprietary
to ESMA, including from commercial data providers and public authorities. ESMA uses these data in good faith and does not take responsibility for
their accuracy or completeness. ESMA is committed to constantly improving its data sources and reserves the right to alter data sources at any time.
The third-party data used in this publication may be subject to provider-specific disclaimers, especially regarding their ownership, their reuse by non-
customers and, in particular, their accuracy, completeness or timeliness, and the provider’s liability related thereto. Please consult the websites of
the individual data providers, whose names are given throughout this report, for more details on these disclaimers. Where third-party data are used
to create a chart or table or to undertake an analysis, the third party is identified and credited as the source. In each case, ESMA is cited by default
as a source, reflecting any data management or cleaning, processing, matching, analytical, editorial or other adjustments to raw data undertaken.
PRINT ISBN 978-92-95202-87-0, doi :10.2856/574362, EK-05-23-306-EN-C
PDF ISBN 978-92-95202-88-7, doi :10.2856/982068, EK-05-23-306-EN-N
European Securities and Markets Authority (ESMA)
Economics, Financial Stability and Risk Department
201-203 Rue de Bercy
FR-75012 Paris
risk.analysis@esma.europa.eu
ESMA - 201-203 rue de Bercy - CS 80910 - 75589 Paris Cedex 12 - France - www.esma.europa.eu
Cover photo: Image Microsoft 365

ESMA TRV Risk Analysis 30 October 2023 3
Orderly Markets
Evolution of EEA share market
structure since MiFID II
Contact: caroline.le[email protected]pa.eu
1
Summary
Since the launch of the EU capital markets union initiative, new legislative and non-legislative proposals
have aimed at fostering a single market for capital in the EU. These regulatory proposals, together with
other external events including mergers, have shaped the integration and competition level of trading
platforms. Making use of regulatory data, this article presents the evolution of the European share
market microstructure from 2019 to 2022, with a specific focus on the impact of the UK’s withdrawal
from the EU, given its pivotal role in equity markets. The important decrease in trading volumes
observed after 2021 was accompanied by four main changes: a decrease in the number of
infrastructures trading shares, even though they remain elevated; a new distribution of trading, both by
market type and by country, with a concentration of trading in a few EU countries; the relocation of
domestic trading for many European countries; and the increased specialisation of venues. Confirming
the transfer of volumes in a few countries, share trading remains highly concentrated on a few trading
venues after the UK’s withdrawal.
1
This article was written by Lorenzo Danieli and Caroline Le Moign (ESMA). The article also benefited from discussions and
analyses held at the Committee for Economic and Markets Analysis MiFID Task Force, as well as from precisions from
colleagues from the Markets and Digital Innovation Department.

ESMA TRV Risk Analysis 30 October 2023 4
Introduction
Since the launch of the EU capital markets union
(CMU) initiative in 2015, new legislative and non-
legislative proposals have been made to create a
single market for capital
2
, including reviews of the
main legislation of capital markets: the markets in
financial instruments directive (MiFID II) and the
markets in financial instruments regulation
(MiFIR)
3
. The MiFID II / MiFIR package started
applying in January 2018.
In 2020, the European Commission’s
assessment on CMU stated that ‘while progress
has been made […], EU capital markets remain
fragmented [meaning] that European citizens and
businesses are not able to fully benefit from the
sources of funding and investment that capital
markets can offer.’ Thus, an action plan was
adopted in 2020 with a focus on integrating
national capital markets into a genuine single
market, followed up in 2022 with new legislative
proposals aiming at streamlining the listing
process on EU stock exchanges and clearing
services.
In parallel, several events have affected
European equity markets in the last years, such
as the COVID-19-related market stress, and the
withdrawal of the UK from the EU. Furthermore,
equity markets also saw the increase in retail
trading activity
4
, mergers among important
exchanges
5
and the evolution of their business
models. If trading venues (TVs) continue to
compete for listings and order flow, through fee
structure or competing services (e.g. clearing and
settlement, different trading protocols), their
revenues from trade-data-related services have
become more important (Duffie et al., 2022). In
an upcoming ESMA working paper, we will test
the significance of these main changes through a
panel regression model, to test the descriptive
statistics described in this article.
The aim of our analysis is to present the evolution
of the European market structure making use of
2
See CMU-dedicated web pages on the Commission
website, presenting action plans, legislative proposals,
packages already put in place and progress reports.
3
Directive 2014/65/EU on markets in financial
instruments and amending Directive 2002/92/EC and
Directive 2011/61/EU (recast); and Regulation (EU) No
600/2014 on markets in financial instruments and
amending Regulation (EU) No 648/2012.
4
Retail traders appear to participate more in European
stock markets, both in all-to-all trading mechanisms
where they interact with all types of traders, or in venues
operating retail-specific mechanisms (Aramian and
Comerton-Forde, 2023). See ESMA (2022), Key Retail
Risk Indicators for the EU Single Market. Reflecting the
importance of retail risk monitoring, since 2020, ESMA
regulatory data, with a specific focus on share
trading since 2019
6
. In the MiFIR review
7
that has
been agreed in July 2023, one of three priorities
for the review is to ‘improv[e] the level-playing
field between execution venues’. Thus,
identifying and understanding the evolution of the
European market structure during the recent
transformative years is key to assess this
objective, and the new level of trading
concentration. On the one hand competition
among venues can lead to more innovative
services and lower fees, on the other a
fragmented trading landscape may also impact
market liquidity. This article contributes to
ESMA’s work to promote effective and stable
financial markets.
Share trading competition
in the economic literature
The literature on trading venue competition
highlights a trade-off between the positive effects
that arise from increased competition, such as
reduced spreads and increased price efficiency
(O’Hara and Ye, 2011), and negative network
externalities that arise when liquidity is dispersed
among venues.
A consolidated market leads to better execution
as more traders are present, leading to higher
liquidity (Pagano, 1989). However, where traders
are heterogeneous with respect to their beliefs
and motives, different market structures can
better serve their needs (Harris and Raviv, 1993).
Increasing electronification has brought these
views together, highlighting the crucial role of
transparency: the market is virtually
unfragmented to traders with informational
access to all venues (Gresse, 2017). But fast-
trading technology has also intensified
competition for order flow between TVs, with the
possible consequence of additional costs
stemming from the speed race to react to
information. Thus, while competition reduces
has an additional specific mandate to develop ‘retail risk
indicators for the timely identification of potential causes
of consumer and investor harm’ (Article 9(1ab) of the
revised ESMA regulation).
5
For instance, Euronext acquired Borsa Italiana in 2021
and the London Stock Exchange acquired the data
vendor Refinitiv.
6
This article is a companion analysis to the Market
Report on EU Securities Markets, which provides an
overview of all equity and bond markets.
7
See Proposal for a Regulation of the European
Parliament and of the Council amending Regulation
(EU) No 600/2014.

ESMA TRV Risk Analysis 30 October 2023 5
trading costs, an increase in the number of TVs
may also lead to more arbitrage opportunities and
heightened adverse selection for liquidity
providers, which respond to increased spreads
(Baldauf and Mollner, 2021).
Another important feature of market
fragmentation is that its benefits are not linear
depending on the characteristics of the stocks, for
example a moderate degree of fragmentation can
be liquidity maximising for large capitalisation
stocks (Degryse et al., 2015), but detrimental for
small and medium-sized enterprises (SMEs) and
other less-actively traded stocks (Lausen et al.,
2021).
Analysing the mergers, the economic literature
points towards overall positive effects on stock
liquidity, which are, however, concentrated on
stocks with large market capitalisation or foreign
exposure (Nielsson, 2009, on the Euronext
mergers during the 2000s). In terms of overall
market structure, exchange mergers do not lead
to significant increase in industry concentration in
the long term (Otchere and Abukari, 2020,
analysing six trading venue mergers in the EU
and the US).
Evolution of EEA share
market structure
Using transparency data reported from 2019 to
2022, this section analyses the evolution of the
European Economic Area (EEA) equity market
structure following the implementation of MiFID
II
8
. This dataset includes reference data from the
Financial Instruments Reference Database
System (FIRDS), and additional reference and
trading activity information from the Financial
Instruments Transparency System (FITRS)
9
.
8
The perimeter includes all EEA countries since MiFID
II / MiFIR are texts with EEA relevance. For further
information on European markets, including on all
equity and bond instruments, see ESMA (2021), EU
Securities Markets – ESMA annual statistical report.
9
See ESMA (2020), EU Securities Markets – ESMA
annual statistical report for a presentation of the data
collection and treatment. See also the ESMA website to
access the data registers.
10
The UK, which remained part of the EU single market
as part of the transition period stipulated in the EU–UK
Withdrawal Agreement, continued to submit data to the
MiFID II reporting system throughout 2020. In all the
charts, the perimeter is always described: when ‘EEA’
is mentioned, the perimeter is the current EEA
perimeter of 30 countries; when ‘EEA + UK’ is
presented, the perimeter is EEA pre-withdrawal of the
UK, meaning the EEA with 31 countries, including the
UK.
11
RMs are multilateral systems operated by a market
These figures are also compared to the US
microstructure using public and commercial data
on share trading in the US. In order to show the
impact of the UK’s withdrawal from the EU, our
analysis presents the evolution of the EEA
including UK numbers until the end of the
transition period at the end of 2020, and without
afterwards
10
. This article focuses on the
microstructure of share trading in the EEA and
does not integrate volumes traded for other
equity instruments such as exchange-traded
funds.
In the EEA and according to MiFID II / MiFIR,
shares can be traded on exchange or off
exchange. On-exchange trades can be carried
out on TVs, through a regulated market (RM) or
a multilateral trading facility (MTF). Off-exchange
trades can be carried out through a systematic
internaliser (SI) or over the counter (OTC)
11
.
The share trading obligation (STO) was
introduced in the MiFIR framework
12
in order to
increase market transparency by shifting OTC
share trading onto lit trading platforms.
Investment firms that undertake trading in shares
have to ensure that trading takes place on a RM,
MTF or SI, or a third-country TV assessed as
equivalent, except for infrequent or exceptional
trades that do not contribute to the price
discovery process.
The UK had a pivotal role in European
securities trading, and its withdrawal from the
EU brought a significant drop in overall trading in
2021. Trading volumes on UK TVs in 2019 and
2020 accounted respectively for 50 % and 69 %
of share volumes traded on exchange in the
EEA + UK. Since all EEA shares are within the
scope of the STO
13
, this meant that all EEA
shares had to be traded on EEA or equivalent
third-country venues. Thus, the end of the
transition period and the STO translated into an
operator, which bring together multiple third parties
buying and selling interests in financial instruments, in
accordance with its non-discretionary rules, and in a
way that results in a contract. MTFs are another type of
non-discretionary venue, very similar to RM, but they
can be operated by an investment firm or a market
operator. SIs are investment firms that, on an
organised, frequent, systematic and substantial basis,
deal on own account when executing client orders,
proposing a bilateral discretionary system. They offer
an avenue for trading outside a lit market, but without
the liquidity disadvantage of pure bilateral OTC
transactions.
12
Article 23 of Regulation (EU) No 600/2014.
13
ESMA clarified that in the context of Brexit, the STO
applies to all EEA shares, aside from EU investment
firms trading EEA shares on UK TVs in pound sterling –
fewer than 50 shares.

ESMA TRV Risk Analysis 30 October 2023 6
important drop in share trading in 2021, from
EUR 25.0tn in the EEA + UK to EUR 13.5tn in the
EEA (– 46 %), since many EEA shares were
mainly traded in the UK (see following sections).
In comparison, UK shares were only seldom
traded on EEA TVs, with 11% of UK share
volumes traded on EEA TVs on average in
2019/20.
This important decrease in volumes was
accompanied by four main changes of the EEA
market structure: a decrease in the number of
infrastructures trading shares, even though they
remain elevated; a new distribution of trading,
both by market type and by country; the
relocation of domestic trading; and the increased
specialisation of venues. However, the
concentration of trading on a few venues remains
elevated.
High number of EEA groups and
infrastructures, even after 2021
For TVs, the market structure in Europe
encompasses three layers of consolidation.
Exchange groups represent the highest level of
consolidation among stock exchanges (Chart 1).
They are the parent company of a set of operating
entities (from one or multiple countries) that work
with the same set of group-specific rules, single
disclosure and governance regimes, and single
tax treatment (Wright and Hamre, 2021). All
those entities are identified through international
indicators called market identifier codes (MICs)
14
.
Exchange groups are composed of market
operators that may run one or more TVs (market
segments). Operating entity MICs identify market
operators, and market segment MICs classify a
section of the market operator, usually a
specialisation in one or more specific instruments
(equity, bonds, derivatives, SME shares, etc.)
15
.
There are also cases in which a market operator
does not have a parent company and is therefore
considered as non-consolidated. Off-exchange
SIs do not have the same structure: as
investment firms, they are not part of an
exchange group but frequently operated by large
banks. By combining the information on TVs
14
For the definitions presented in the paragraph, see
International Organization for Standardization 10383
frequently asked questions, November 2020.
15
For example, the operating MIC for the Athens
Exchange Group is ‘ASEX’. Under ASEX, there are five
associated market segment MICs: ENAX (alternative
market, where investors can trade in stocks), HOTC
(OTC market), XADE (RM, where instruments available
for trading are futures, options and repos), XATH (RM,
where investors can trade – among other things – in
stocks, exchange-traded funds and bonds), XIPO
publicly available on the ESMA registers with
publicly available information on their parent
companies, it is possible to trace the ownership
structure of consolidated groups
16
.
The number of consolidated groups remains
elevated at the end of 2022, even though some
mergers have occurred since the application of
MiFID II (Chart 2). The number of groups with
EEA operators trading shares slightly declined
from 40 groups in 2019 to 37 in 2021 and 2022 –
out of which 26 groups are domiciled in the EEA,
four in the UK and seven outside the EEA (mostly
in Japan, Switzerland and the US). Among these
groups, few have only one single TV trading
share (nine in 2019 and 2020, and eight in 2021
and 2022), and the largest group included seven
market operators and 34 TVs trading shares in
2022.
On-exchange volumes from groups domiciled in
the EEA have increased from 30 % in 2019/2020
to 39 % in 2021/2022, with a comparable
decrease of volumes from groups in the UK (– 8
percentage points (ppt) from the 2019/2020
simple average to the 2021/2022 simple average)
and outside of the EEA (– 1 ppt). UK-domiciled
groups concentrate the largest share of dark
trading on exchange (57 % of trading under pre-
(specialised in initial public offerings).
16
Each TV has a legal entity identifier that enables unique
identification of legal entities participating in financial
transactions, which can be matched with ‘level 2’ data
available on the Global Legal Entity Identifier
Foundation (GLEIF) website. These data include
information on legal entities that report their ‘direct
accounting consolidated parent’ together with their
‘ultimate accounting consolidated parent’. See GLEIF
‘Level 2 data: Who owns whom’.
Chart 1
Example of on-exchange equity market structure
Consolidating
group
Country 1
Country 2
Country 3
Market
operator 1
Market
operator 2
Market
operator 3
TVa
TVb
TVc
Exchange
group
Operating
entity
Market
segment
Country 1
Market
operator 4
Non-
consolidating
TVd
TVe
TVf
TVg
TVh
TVi
TVj

ESMA TRV Risk Analysis 30 October 2023 7
trade waivers and 97 % of trading under post-
trade deferrals in 2021/2022 – see the following
subsections for definitions).
The European share trading landscape is
characterised by a high number of
infrastructures split among RMs, MTFs and SIs
(Chart 3). By the end of 2020, there were 181 TVs
(59 RMs, 122 MTFs) and 63 SIs trading shares in
the EEA + UK
17
. Among them, a large number
were domiciled in the UK (30 MTFs, two RMs and
19 SIs).
After the withdrawal of the UK from the EU, the
number of active EEA infrastructures decreased
only slightly. At the end of 2020 there were
respectively 57 RMs, 92 MTFs and 44 SIs in the
EEA. In terms of new authorisations, two new
RMs, nine new MTFs and 21 new SIs were
authorised in the EEA in 2021 and 2022, with
some of those infrastructures not or not yet
trading shares. Hence, the number of active
infrastructures stood at 158 TVs (59 RMs, 99
MTFs) and 47 SIs at the end of 2022.
17
In this article we report the number of TVs and SIs
(identified with segment MICs) on which share trading
occurred at least once during the reporting year.
18
See the US Securities and Exchange Commission
website. The four groups are Cboe Global Markets,
Intercontinental Exchange, Nasdaq and Miami
International Holdings. The four remaining exchanges
are independent, with most of them recently created,
with the explicit aim to improve transparency and
competition for smaller investors (e.g. IEX or Members
Exchange).
19
The US microstructure was always much more
The European share trading landscape appears
to be significantly more fragmented if
compared to the US markets, where only 24
national stock exchanges were active at the end
of 2022 – out of which 20 belong to only four
groups
18
. Different historical evolution and
regulatory choices help to explain the current
market structures, such as the introduction since
2005 in the US of a central data consolidation
system for pre- and post-trade transparency
information and a dynamic best execution rule
19
.
This difference is also a reflection of the
European jurisdictions that have each grown
national markets, as wells as the many types of
infrastructures in the EU regulation that can
propose specific trading characteristics (see for
instance the differences between RMs and MTFs
in the sub-section Increase in trading
specialisation of venues).
Despite the larger number of infrastructures,
trading activity in the EEA remains
comparatively low in comparison to the US.
Trading volumes in shares in the US amounted to
EUR 86.3tn in 2022, compared to EUR 13.4tn in
concentrated: in 2000, the New York Stock Exchange
and NASDAQ accounted for 95 % of US on-exchange
trading volumes. The Regulation National Market
System implemented in 2005 increased competition
between venues: by mandating connectivity between
the markets, it removed the barriers to entry and
increased competition (Haslag and Ringgenberg,
2022). By 2016, NYSE and NASDAQ accounted for
less than 30 % of US volumes. The American market
capitalisation is also more important than the European
one.
Chart 2
Number of groups trading shares, by domicile
High number, slight decrease since 2019
Chart 3
Number of venues and SIs trading shares
High number of infrastructures, also after
Brexit
0
5
10
15
20
25
30
35
40
2019 2020 2021 2022
EEA UK non EEA
Note: Number of unique groups with venues trading shares in the EEA, by
country domicile.
Sources:FITRS, GLEIF, ESMA.
0
20
40
60
80
100
120
140
160
180
200
EEA UK EEA UK EEA EEA
2019 2020 2021 2022
RM MTF SI
Note: Number of unique venues and SIs trading shares in the EEA and UK,
by type.
Sources: FITRS, ESMA.

ESMA TRV Risk Analysis 30 October 2023 8
the EEA (6.4 times less). Even before the UK’s
withdrawal, US share trading volumes were close
to three times higher than in the EEA + UK
(EUR 71.7tn compared to EUR 25tn).
Changing trading landscape after
2020
While turnover volumes were equally distributed
across market types in 2019 and 2020, the
trading landscape shows a significantly higher
share of on-exchange trading (from 53 % and
55 % in 2019 and 2020 to more than 70 % both
in 2021 and 2022). The largest change was
observed off-exchange, with the share of SI
activity more than halving since 2021 (7 % and
6 % of share turnover volumes in 2022), as the
majority of SIs that were authorised in the
EEA + UK were domiciled in the UK. OTC trading
slightly declined by 4 ppt to 22 % of total shares’
volumes in 2021 and 2022 (v 27 % in 2019 and
26 % 2020).
On-exchange volumes were almost equally
distributed between RMs and MTFs prior to the
UK’s withdrawal (29 % of overall shares’ volumes
on RMs and 27 % on MTFs in 2020), while there
has been a greater amount of activity on RMs
since then. RMs have increased their market
share, with 40 % of total share trading in the EEA
in 2021/2022, while MTFs have increased theirs
only slightly, to 32 % in 2021/2022.
The changing composition of the structure of on-
exchange trading is explained by the fact that
MTF trading was highly concentrated in the UK,
with 30 UK MTFs in 2020 out of a total of 122
MTFs in the EEA + UK, concentrating an average
of 93 % of the trading volumes on MTFs in
2019/2020 (Chart 5).
Since the UK’s withdrawal, the concentration of
MTF trading remained concentrated within three
countries, making up 95 % of MTF trading in
2022: the Netherlands (57 %), France (29 %) and
Germany (9 %). This is linked to the migration of
some of the volumes traded on UK MTFs to the
Netherlands’ MTFs (volumes multiplied by 633,
from EUR 3.5bn on average in 2019/2020 to
EUR 2.2tn on average in 2021/2022) and to
France’s MTFs (volumes multiplied by 121, from
EUR 11.6bn to EUR 1.4tn).
Turnover volumes on RMs remained more evenly
distributed among EEA countries (Chart 5). If the
two UK RMs were gathering 21 % of share
trading on EEA + UK RMs in 2019/2020,
Germany (21 % on average in 2019/2020) or
France (17 %) also had significant shares of RM
trading. After the UK’s withdrawal, domestic
trading on RMs increased in general. Germany
and France continued to have the highest share
of RM volumes on average in 2021/2022 (24 %
and 20 % respectively), followed by the
Netherlands (12 %) and Italy (11 %).
Relocation of domestic trading
The evolution of share market microstructure
after Brexit is also characterised by a change in
trading patterns related to the domicile of the
traded shares. In this article, we characterise
shares by issuer domicile, with ‘domestic share’
meaning that the domicile of the share is the
same as the domicile of the TV or SI it is traded
on; ‘other EEA share’ or EEA ‘cross-border
trading’ when the share domicile is different from
Chart 4
Annual turnover volumes by market type
On-exchange trading increased after Brexit
Chart 5
Annual trading volume by venue domicile
UK dominated MTF turnover pre-Brexit
0%
10%
20%
30%
40%
50%
60%
70%
80%
On exchange SI OTC
2019 2020 2021 2022
Note: Share of annual turnover volumes in shares by market type, in %. In
2019 and 2020 the perimeter is the EEA + UK, in 2021 and 2022 the EEA.
Sources: FIRDS, FITRS, ESMA.
0%
10%
20%
30%
40%
50%
60%
70%
80%
90%
100%
MTF RM MTF RM MTF RM MTF RM
2019 2020 2021 2022
DE FR NL IT SE UK Other
Note: Annual trading volumes in shares by market type and trading venue
domicile. Share of the total, in %.
Sources: FIRDS, FITRS, ESMA.
ESMA TRV Risk Analysis 30 October 2023 9
the domicile of the TV or SI, but from another EEA
country; and ‘non-EEA share’ when the share has
an issuer from outside the EEA
20
.
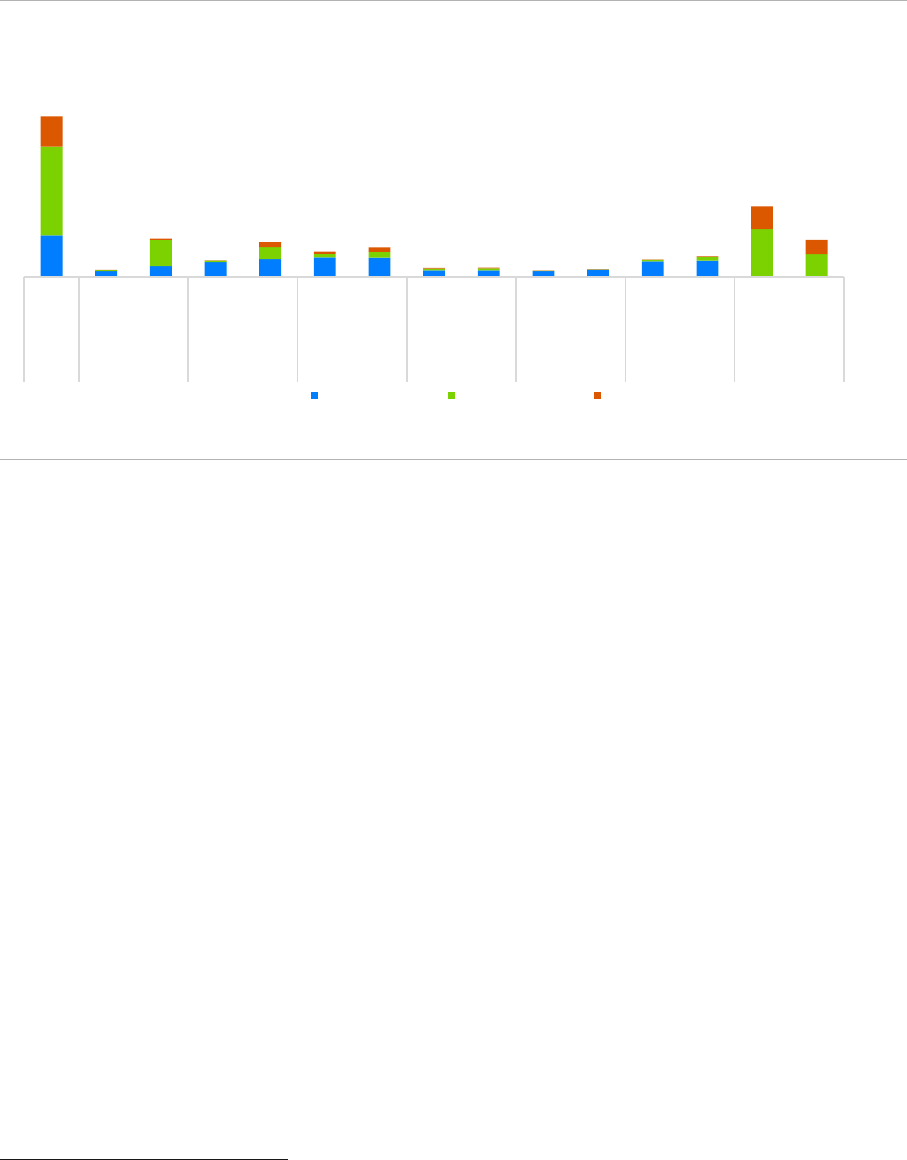
Overall, a decrease of trading of non-EEA
shares is observed after the UK’s withdrawal,
since most of those transactions took place in the
UK. Turnover of non-EEA shares decreased by
– 54 % after Brexit, from EUR 4.1tn in 2019/2020
to EUR 1.9tn in 2021/2022. This decrease is
particularly large on venues and SIs, with a
– 64 % decrease (from EUR 2.4tn to EUR 869bn)
(Chart 6). In 2019/2020, 90 % of those volumes
on venues and SIs were traded on UK TVs or SIs
(EUR 2.2tn), with other volumes in Germany
(EUR 161bn, 7 %).
In 2021/2022, non-EEA shares were mostly
traded on French (41 %) and German (37 %) TVs
and SIs. This translated into large surges of non-
EEA volumes in France, with non-EEA turnover
growing from EUR 6.5bn to EUR 361.2bn in
France, and from EUR 161bn to EUR 322.8bn in
Germany on average from 2019/2020 to
2021/2022 (multiplied by 55 and doubled
respectively). Non-EEA shares were also traded
OTC, with an increase of this trading type after
2021 (from 40 % of overall non-EEA volumes in
2019/2020 to 54 % in 2021/2022).
Similarly, intra EEA cross-border trading
decreased and migrated towards a few
countries. Before the UK’s withdrawal, 90 % of
20
The regulatory dataset does not allow the domicile of
transactions happening OTC to be characterised, thus
it is not possible to compare the domicile of the share
intra-EEA cross-border trading volumes were
observed on UK TVs and SIs, with EUR 7.2tn on
average in 2019/2020. Cross-border share
trading on TVs and SIs halved to EUR 3.7tn on
average in 2021/2022. The volumes are mainly
concentrated in the Netherlands (52 %), France
(24 %) and Germany (12 %). This new
specialisation in trading shares from other
Member States was accompanied by an increase
in EEA cross-border volumes in the Netherlands
and France (respectively multiplied by 25 and
6.5).
Another transformation is the relocation of
domestic shares trading. Before the UK’s
withdrawal, only 41 % of the volumes of the
shares issued in an EEA country were traded on
the TVs or SIs of the same country (Chart 7). For
instance, 30 % of Dutch shares volumes on
venues and SIs were traded in the Netherlands in
2019/2020, and similarly 38 % of French shares
volumes on venues and SIs were traded in
France. This means that on average in the EEA,
59 % of the domestic shares trading was
occurring in other EEA countries’ TVs and SIs in
2019/2020, with the vast majority of those
volumes in the UK (see previous chart).
issuer and the domicile of the OTC transactions. Only
venues and SIs domicile is taken into account.
Chart 6
Shares volumes by issuer and venue domicile
Decrease in non-EEA shares volumes, concentration of EEA cross-border trading
0
2
4
6
8
10
12
14
2021—2022
2019—2020
2021—2022
2019—2020
2021—2022
2019—2020
2021—2022
2019—2020
2021—2022
2019—2020
2021—2022
2019—2020
2021—2022
2019—2020
2019—2020
OTCOtherSEITDEFRNLUK
Domestic Other EEA Non-EEA
Note: Average share turnover on venues and SIs, EUR trillion, in shares with an issuer from the same country (domestic), from another EEA country (other EEA) or
outside the EEA (non-EEA), for 2019/2022 and 2021/22.
Sources: FIRDS, FITRS, ESMA.

ESMA TRV Risk Analysis 30 October 2023 10
This situation, observed on average, was not
similar in all EEA countries, with some smaller
Member States observing more than 95 % of
their domestic shares traded on their domestic
TVs and SIs in 2019/2020 (e.g. Estonia, Latvia,
Lithuania, Slovenia or Slovakia). From 2021, a
relocation of domestic share trading is observed
on average, with 61 % of volumes on TVs and SIs
traded in the same country as the issuer of the
shares. This relocation is particularly noticeable
for the Netherlands (+ 32 ppt between the
2019/2020 and 2021/2022 average), France
(+ 27 ppt), Ireland (+ 20 ppt) and Germany
(+ 18 ppt).
Increase in trading specialisation of
venues
Venues tend to specialise by proposing different
trading characteristics, with some that are
observable in the transparency data, such as
trading certain domestic shares or shares from
small or large companies. Introduced by MiFID I,
MTFs adopted a similar microstructure as RMs,
characterised by a visible order book and the
presence of central clearing counterparties, with
some proposing more diverse trading protocols.
Several MTFs operate as dark book only. Since
their creation, those trading platforms are also
competing on fees and technology, as well as on
the number of instruments available for trading by
21
Based on Article 4 of MiFID II, SMEs are defined in this
article as the listed companies the market capitalisation
offering a wide range of EEA and non-EEA
securities (Fioravanti and Gentile, 2011).
On average, the number of shares available for
trading on MTFs is 10 times higher than on RMs
in 2019 and 2020 (around 1 600 v 160), and 11
times in 2021 and 2022 (around 1 500 v 140)
(Chart 8). Nevertheless, only half of these shares
available were actually traded on MTFs (55 % in
2019 and 2020, 62 % in 2021 and 2022),
whereas 83 % of the shares available for trading
on RMs were traded on RMs in 2021 and 2022
(80 % in 2019/2020).
The second main trading characteristic of MTFs
is their specialisation in foreign trading,
meaning a major part of their volumes comes
from trading shares issued in an EEA country
different from the MTF domicile and non-EEA
shares. In this respect, domestic trading
accounted for only 21 % of MTF share trading in
2019/2020 and 18 % in 2021/2022 (Chart 9),
while trading of shares from other EEA Member
States amounted to 65 % (vs. 68 % in
2019/2020) and non-EEA share trading to 14 %
(vs. 11 % in 2019/2020).
MTFs are the main venue for trading in SMEs
shares
21
, especially since the introduction of the
possibility for SMEs to be listed on growth
markets in MiFID II / MiFIR as part of the CMU
agenda, which provides for a lighter reporting
of which is below EUR 200 million.
Chart 7
Share of domestic shares trading by country
Domestic trading of shares increased
Chart 8
Average number of instruments available to trade
Far higher number of shares available on
MTFs
0% 20% 40% 60% 80%
IE
ES
SE
IT
DE
FR
NL
EEA
EEA + UK
2019—2020 2021—2022
Note: Domestic share trading on domestic infrastructures, in % of total
domestic share trading on all venues and SIs, for 2019/2020 and 2021/2022.
Lecture: In 2019/2020, 18% of trading volumes in Irish shares were traded
on Irish venues or SIs. In 2021/2022, 38% of the Irish share volumes on all
venues and SIs were traded on Irish venues or SIs.
Sources: FIRDS, FITRS, ESMA.
0
0.1
0.2
0.3
0.4
0.5
0.6
0.7
0.8
0.9
-
200
400
600
800
1,000
1,200
1,400
1,600
1,800
MTF RM MTF RM MTF RM MTF RM
2019 2020 2021 2022
Listed % traded
Note: Average number of shares available for trading (lhs) and share of
traded stocks by market type (rhs).
Sources: FIRDS, FITRS, ESMA.

ESMA TRV Risk Analysis 30 October 2023 11
burden and reduced compliance costs for SME
listing
22
.
Overall, SME trading volumes were higher on
MTFs than on RMs. Although this difference was
small before the UK’s withdrawal (SME trading
volumes amounted to 1.5 % and 1.3 % of MTFs
and RMs volumes respectively in the EEA + UK
on average in 2019/2020), the activity in SME
shares on MTFs increased afterwards. SME
volumes represented 2.2 % of MTF shares’
volumes on average in 2021/2022, while this
share went down on RMs to 0.7 % of RM shares’
volumes in 2021/2022.
The UK dominated SME trading in 2019 and
2020 with respectively 35 % and 39 % of the total
trading in SMEs. SME volumes continued to be
concentrated after the UK’s withdrawal, mainly in
French and German venues and SIs (20 % and
16 % of SME volumes on average, respectively,
in 2021/2022), with also an increase in OTC
22
Market operators can apply for their MTF to be
registered as an SME growth market, provided that
50 % of the issuers with shares available for trading on
their MTF are SMEs.
23
See ESMA (2022), Annual Report 2022 Waivers and
Deferrals, for more detailed information on pre- and
post-trade deferrals and their implementation, along
with statistics of volumes and transactions under each
waiver and deferral. Article 4 of MiFIR sets out four
different type of pre-trade transparency waivers for
equity instruments: the reference price; negotiated
trade; large-in-scale and order management facilities
waivers. In terms of numbers of waivers, large-in-scale
waivers are the main type.
trading (from an average of 15 % in 2019/2020 to
41 % in 2021/2022).
MTFs are also specialised in dark trading.
Under the MiFID II / MiFIR framework, market
operators and investment firms are required to
publicly provide both the current bid and offer
prices and the depth of trading interests at those
prices (pre-trade transparency), along with the
price, volume and time of the executed
transactions (post-trade transparency), both as
close to real time as is technically possible.
‘Dark trading’ is defined as trading under pre-
trade waivers, meaning when the pre-trade
transparency requirements are waived by
national competent authorities. For equity
instruments, MiFID II / MiFIR allow the pre-trade
transparency obligations to be waived (in
particular for transactions that are large in scale
compared to the normal market size, for using the
available reference price or for systems that
formalise negotiated transactions) and allow
post-trade transparency publication to be
deferred, mainly for large-scale transactions
23
.
Trading under waivers and deferrals has
decreased since the UK’s withdrawal, especially
trading under pre-trade waivers (dark trading).
The decrease in trading under post-trade
deferrals went down in the same levels as the
overall trading volumes, from EUR 4.4tn on
average in 2019/2020 to EUR 2.6tn in 2021/2022
(– 43 %), whereas trading under pre-trade
waivers decreased by – 55 %, from EUR 4.0tn in
2019/2020 to EUR 1.8tn in 2021/2022
24
.
This type of trading is also increasingly
concentrated on MTFs after 2021: 92 % of all
volumes in shares traded under pre-trade
waivers and 40 % under post-trade deferrals in
2021/2022 occurred on MTFs (v respectively
90 % and 34 % in 2019/2020 for pre- and post-
trade waivers and deferrals volumes). The rest of
trading under pre-trade waivers happens on RMs
(8 % of volumes under pre-trade waivers in
2021/2022), while deferred volumes are also
24
Turnover statistics for pre trade waivers and deferrals
are only presented for MTFs and RMs. In general, there
are no waivers for OTC-trading given that OTC-trading
is not subject to pre-trade transparency. There are
exceptions for SIs, where the concept of standard
market size (SMS) applies for determining the quoting
obligations. MiFID II requires that SIs publish bid and
offer prices for a size at least equal to 10 % of the SMS
for liquid shares and equivalent liquid instruments (such
as ETFs and certificates). However, SIs are free to
propose to their clients, in addition to their public
quotes, bilateral quotes that are not subject to pre-trade
transparency when they are higher than the SMS.
Chart 9
MTF share trading by characteristics
MTFs specialised in foreign, SME, dark
trading
0%
10%
20%
30%
40%
50%
60%
70%
2019 2020 2021 2022
Domestic Pre-trade Post-trade Large cap SME
Note: Annual turnover in shares on multilateral trading facilities. Domestic =
turnover in 'domestic' shares. Large cap = turnover in shares with a market
capitalisation larger than EUR 20bn. SME = turnover in shares with a market
capitalisation smaller than EUR 200mn. Pre-trade = turnover under pre-trade
waiver. Post-trade = turnover under post-trade deferral.
Sources: FIRDS, FITRS, ESMA.

ESMA TRV Risk Analysis 30 October 2023 12
observed OTC (55 % of volumes under post-
trade waivers) and on SIs (4 % in 2021/2022).
Trading under waivers or deferrals therefore
represents the majority of MTF volumes: 39 % of
MTFs volumes in shares came from volumes
under pre-trade waivers and 24 % from volumes
under post-trade deferrals in 2021/2022
(respectively 56 % and 23 % in 2019/2020). In
comparison, on RMs, trading under pre-trade
waivers represented only 2 % of share volumes
in 2021/2022 (3 % in 2019/2020) and 0.3 % for
volumes under post-trade deferrals (1 % in
2019/2020).
Finally, and contrary to MTFs, RMs specialise in
trading quasi-exclusively domestic shares (i.e.
shares from an issuer of the same country as the
venue). This characteristic remained stable over
time, with 90 % of domestic trading on average in
2019/2020 and 88 % in 2021/2022. This is linked
to RMs being most often the primary market
where companies issue their stock.
By instrument size, the majority of turnover
volumes on MTFs and RMs is in shares from
very large capitalisation companies (with a
market capitalisation above EUR 20bn). It
accounted for more than half of total trading
volumes on each market type in 2019/2020 (55
% on average on RMs and 61 % on MTFs). After
the UK’s withdrawal, RMs increased their
specialisation in trading very large cap. shares,
which represented 62 % of the volumes traded on
RMs in 2021/2022 (64 % on MTFs in 2021/2022).
Overall, RMs increased their share in total large-
cap. volumes in the EEA, reaching 39 % in
2021/2022 (25 % on average in 2019/2020),
when MTFs share went from 27 % to 31 %.
High level of on-exchange trading
concentration remains
Share-trading activity on exchange is mostly
concentrated on few large TVs. The first 10 TVs
in shares turnover volumes have gathered almost
three quarters of on-exchange volumes in shares
since 2019. Even after 2021, the top 10 recorded
74 % of all on-exchange turnover in 2021 and
2022, with five new venues joining this ranking.
Concentration is particularly high for the top 10
RMs, which concentrated 95 % of RM volumes in
2019 and 2020 (93 % in 2021 and 2022). The 10
largest MTFs in terms of turnover volumes were
all from the UK in 2019 and 2020, and
concentrated respectively 88 % and 85 % of
MTFs volumes. After 2021, the first 10 MTFs
were domiciled in four different countries but
were even more concentrated (89 % of MTF
volumes in 2021 and 90 % in 2022).
The trading concentration in the US, even with
a smaller number of venues, appears higher. The
first five venues accounted for 74 % of US on-
exchange share turnover in 2022, a
concentration that has remained stable in the last
years (76 % on average since 2019). Considering
a similar perimeter, the first five venues trading
shares concentrated 67 % of the EEA + UK
volumes on average in 2019/2020, with the
Chart 10
RM share trading by characteristics
RMs specialised in domestic, large-cap.
trading
Chart 11
Share trading concentration by market type
Very high trading concentration, especially
on RMs
0%
10%
20%
30%
40%
50%
60%
70%
80%
90%
100%
2019 2020 2021 2022
Domestic Pre-trade Post-trade Large cap SME
Note: Annual turnover in shares on regulated markets. Domestic = turnover in
'domestic' shares. Large cap = turnover in shares with a market capitalisation
larger than EUR 20bn. SME = turnover in shares with a market capitalisation
smaller than EUR 200mn. Pre-trade = turnover under pre-trade waiver. Post-
trade = turnover under post-trade deferral.
Sources: FIRDS, FITRS, ESMA.
0%
10%
20%
30%
40%
50%
60%
70%
80%
90%
100%
Top 10 venues Top 10 RM Top 10 MTF
2019 2020 2021 2022
Note: Share of on-exchange share trading on first 10 venues, RM and MTF by
turnover volumes, in % of each market type by turnover volumes.
Lecture: In 2022, the first 10 RMs concentrated 93% of share turnover
volumes traded on all EEA RMs.
Sources: FITRS, FIRDS, ESMA.

ESMA TRV Risk Analysis 30 October 2023 13
majority of them established in the UK
25
. After the
UK’s withdrawal, the concentration level declined
to 60 % on average in 2021/2022, with an
increased number of venue domiciles.
Conclusion
European market structure has changed in an
important manner since the implementation of
MiFID II / MiFIR. Making use of the regulatory
transparency data, this article analyses the
evolution of the EEA share market structure from
2019 to 2022.
Given its pivotal role in stock markets, the impact
of the UK’s withdrawal led to a major decrease in
trading volumes, and a decrease in the number
of infrastructures trading shares, even though
they remain elevated.
Since the beginning of 2021, a new distribution of
trading has been observed, both by market type
and by country, as well as the relocation of
domestic trading; and an increased specialisation
of venues. In an upcoming ESMA working paper,
we will test the significance of these main
changes through a panel regression model, to
test the descriptive statistics described in this
article. By identifying the evolution of trading
concentration and share trading competition
during the recent transformative years, this article
25
To allow for comparability with US figures that are
available at the operating entity levels, numbers are
presented here at the operating MIC level for the US
and the EEA, as opposed to the previous subsection
where the number of venues is presented at the
contributes to ESMA’s work to promote effective
and orderly financial markets.
segment MIC level. This is a natural choice given that
the Refinitiv Eikon market share reporter used for US
data provides figures at the operating MIC level.
Chart 12
Annual on-exchange turnover on EEA and US venues
Higher concentration of trading in the US
0% 20% 40% 60% 80% 100%
US
EEA + UK
US
EEA + UK
US
EEA
US
EEA
2019
2020
2021
2022
Top five venues Other
Note: Share of annual on-exchange turnover volumes in shares on the top
five US venues, compared to EEA + UK venues in 2019 and 2020 and EEA
venues in 2021 and 2022, in % of on-exchange trading volumes.
Sources: FIRDS, FITRS, Refinitv Eikon, ESMA.

ESMA TRV Risk Analysis 30 October 2023 14
Related reading
Anselmi, G., Nimalendran, M. and Petrella, G. (2022), ‘Order flow fragmentation and flight-to-
transparency during stressed market conditions: Evidence from COVID-19’, Finance Research
Letters, Vol. 44.
Aramian, F. and Comerton-Forde, C. (2023), ‘Retail trading in European equity markets’, Plato
Partnership.
Baldauf, M. and Mollner, J. (2021), ‘Trading in fragmented markets’, Journal of Financial and
Quantitative Analysis, Vol. 56, No 1, pp. 93–121.
Degryse, H., de Jong, F. and van Kervel, V. (2015), ‘The impact of dark trading and visible
fragmentation on market quality’, Review of Finance, Vol. 19, No 4, pp. 1587–1622.
Duffie, D., Foucault, T., Veldkamp, L. and Vives, X. (2022), Technology and Finance, Centre for
Economic Policy Research, Paris.
Fioravanti, S. F. and Gentile, M. (2011), ‘The impact of market fragmentation on European stock
exchanges’, CONSOB Working Paper, No 69.
Gresse, C. (2017), ‘Effects of lit and dark market fragmentation on liquidity’, Journal of Financial
Markets, Vol. 35, pp. 1–20.
Haslag, P. H. and Ringgenberg, M. C. (2022), ‘The demise of the NYSE and NASDAQ: Market quality
in the age of market fragmentation’, Journal of Financial and Quantitative Analysis, pp. 1–30.
Lausen, J., Clapham, B., Gomber, P. and Bender, M. (2021), ‘Drivers and effects of stock market
fragmentation – Insights on SME stocks’, SAFE Working Paper, No 367.
Harris, M. and Raviv, A. (1993), ‘Differences of opinion make a horse race’, The Review of Financial
Studies, Vol. 6, No 3, pp. 473–506.
Nielsson, U. (2009), ‘Stock exchange merger and liquidity: The case of Euronext’, Journal of Financial
Markets, Vol. 12, No 2, pp. 229–267.
O’Hara, M. and Ye, M. (2011), ‘Is market fragmentation harming market quality?’, Journal of Financial
Economics, Vol. 100, No 3, pp. 459–474.
Otchere, I. K. and Abukari, K. (2020), ‘Are super stock exchange mergers motivated by efficiency or
market power gains?’, Journal of International Financial Markets, Institutions and Money, Vol. 64.
Pagano, M. (1989), ‘Trading volume and asset liquidity’, The Quarterly Journal of Economics, Vol. 104,
No 2, pp. 255–274.
Wright, W. and Hamre, E. F. (2021), ‘The problem with European stock
marketshttps://newfinancial.org/wp-content/uploads/2021/03/2021.03-The-problem-
with-European-stock-markets-New-Financial.pdf’, New Financial.

ESMA TRV Risk Analysis 30 October 2023 15
