
The Next
New York
Renewing and Reforming
the Empire State

The Next
New York
Renewing and Reforming
the Empire State

ii
© 2023 by Empire Center for Public Policy Inc.
69 State Street, Suite 807
Albany, NY 12207
www.EmpireCenter.org
518-434-3100
iii
Contents
Contributors
iv
Introduction
By Tim Hoefer
v
Reform Priorities Summary
vii
1. Getting a Grip on the State Budget
1
2. Restoring Public Safety
15
3. Rethinking K-12 Education—and Beyond
29
4. Medicaid and Health Care
43
5. Addressing Mental Health
59
6. Heading off New York’s Home-Made Energy Crisis
69
7. Transportation and Transit: Back to Basics
83
8. Housing New York
97
9. Taming a “Taylor Made” Public-Sector Workforce
111
10. Opening a Wider Window on New York
Government
125
11. Voters Access, Election Integrity
131
iv
Contributors
E.J. McMahon is founding senior fellow of the Empire Center for Public
Policy and adjunct fellow at the Manhattan Institute for Policy Research
Rafael Mangual is the Nick Ohnell Fellow and head of research for the
Policing and Public Safety Initiative at the Manhattan Institute, a contributing
editor of City Journal, and a member of the Council on Criminal Justice.
Ray Domanico is a senior fellow and director of education policy at the
Manhattan Institute.
Bill Hammond is senior fellow for health policy at the Empire Center for
Public Policy.
Stephen Eide is a senior fellow at the Manhattan Institute for Policy Research
and contributing editor of City Journal
James Hanley is a fellow focusing on energy and environmental policy at the
Empire Center for Public Policy.
Nicole Gelinas is a senior fellow at the Manhattan Institute for Policy
Research, a contributing editor of City Journal, and a columnist at the
New York Post.
Howard Husock is a senior fellow in Domestic Policy Studies at the
American Enterprise Institute and a contributing editor of City Journal.
Ken Girardin is a fellow at the Empire Center for Public Policy.
Cameron Macdonald is executive director of the Government Justice
Center in Albany, NY.
Kenneth M. Moltner has practiced matrimonial and family law for 18 years
and has been a litigation attorney for over 30 years. He is a member of the
Board of Directors of the Government Justice Center.
v
Introduction
By Tim Hoefer
President & CEO
Empire Center for Public Policy
One hundred years ago, New York already was well established as the
most populous and economically vibrant state in the nation. Yet even in the
booming 1920s, state leaders weren’t resting on their laurels. Looking towards
the future, Governor Alfred E. Smith spent much of that decade successfully
campaigning for constitutional reforms to make state government more efficient
and effective.
In the decades that followed, under Smith’s successors in both parties,
the Empire State overcame the challenges of the Great Depression and World
War II to scale new heights of prosperity and broad opportunity,
accommodating a burgeoning postwar population and the new enterprises and
industries that would employ them.
As time wore on, however, the state lost its way. High-minded ambition
gave way to undisciplined excess.
The Rockefeller era began in the late 1950s with grand visions of a big
government-driven future. By the early 1970s, the Empire State was struggling
with bloated budgets, high taxes, declining services, growing welfare
dependency, rising urban crime rates, and crumbling infrastructure. Millions of
people and countless businesses left the state, the decennial census of New
York’s population declined for the first time ever, and its largest city sank into
virtual bankruptcy and rampant disorder.
To their credit, in the 1980s and 1990s, New York politicians in both
parties grasped the sobering lessons of the Seventies. The era of recovery and
renewal wasn’t always steady; sometimes, every forward step seemed to be
followed by another in the opposite direction. But little by little, New York
regained its edge.
In public finance, taxes were reformed and reduced; debt was curbed;
spending was controlled.
In education, there was a new emphasis on quality, measuring pupil
performance, and expanding choice through charter schools.
vi
In healthcare, the state took steps to deregulate its hospital system and
control Medicaid costs.
“Luxury decontrol” was introduced to New York City’s market-
distorting rent regulations.
And the over-arching achievement, previously thought impossible: a
decades-long crime wave was broken. City streets became safe again.
As the 21st century approached, the once-failing Empire State could
fairly be described as a comeback story.
More recently, though, we’ve experienced yet another turn towards
stagnation and decline—which the COVID-19 pandemic has only accelerated.
Seemingly unaware of the lessons taught by New York’s not-so-distant past, a
rising generation of activists and advocates seem intent on repeating old
mistakes in new forms.
The time is overdue to embrace new approaches—and to dust off some
proven approaches that can work again. It’s time to shape the Next New York.
In the Next New York, we need a fresh commitment to unleashing the
genius and energies of the private sector.
In the Next New York, the focus must return to results-oriented
programs, to spending better rather than simply spending more.
This volume features the insights of 11 policy experts who have spent
years deeply engaged in the study and analysis of the major issues facing our
state today: budget and tax policy, criminal justice, education, health, energy,
transportation, housing, public employment, government accountability and—
capping it off—the laws by which we choose the elected officials to make
decisions in these areas.
Our chapter headings are by no means meant to suggest an all-inclusive
list of needed reforms. For example, an entire additional volume might be
devoted to the burdens state regulation has placed on business. This book
focuses on a set of priorities that would begin to set the right course, and that
should be added to.
The Next New York is in part a briefing book on key aspects of the
public policy status quo. But as its title suggests, each of the 11 chapters of The
Next New York ultimately focuses on the future—on what needs to be done,
and what needs to change, to allow the Empire State to move forward again.
We’ve done it before, and we can do it again.
vii
Reform Priorities Summary
1. Getting a Grip on the State Budget
• Reduce projected spending
• Roll back tax increases
• Move the fiscal year start date to July 1
• Mind the GAAP
• Establish a Legislative Budget Office
• Shut the borrowing backdoor
• Ban lump sum appropriations
• Enforce financial plan deadlines
2. Restoring Public Safety
• Make public safety the central concern of pretrial release decisions
• Restore balance in criminal prosecutions.
• Mitigate the unintended, if predictable, consequences of “Less Is More”
3. Rethinking K-12 Education—and Beyond
• Expand school choice
• Rein in and redirect school spending
• Align graduation and proficiency standards with real-world needs and expectations
• Expand community college trade and workforce preparation program
• Reform educational governance to build accountability
4. Medicaid and health care
• Make commercial coverage more affordable and accessible
• Tighten income-screening procedures for Medicaid enrollees
• Improve the state’s public health system
5. Addressing Mental Health
• Fund more inpatient psychiatric beds
• Target workforce investments to areas of greatest need
• Expand Kendra’s Law
• Increase supervision of the seriously mentally Ill
• Reduce the mental illness burden on other systems
6. Heading off New York’s Home-Made Energy Crisis
• Scrap the current Climate Leadership and Community Protection Act
• End the de facto natural gas pipeline moratorium
• Repeal the fracking ban
• Rethink renewable and zero-emission energy credits
• Repeal the post-2035 ban on selling new internal combustion engines
• Stop legislation likely to further increase costs and undermine reliability
• Encourage investment in hydrogen, renewable natural gas, and advanced nuclear power
7. Transportation and Transit: Back to Basics
• Reconsider priorities for highway spending
• Identify highway funding sources before spending
• Link tolls to reasonable costs
• Reset dedicated taxes
• Adopt a more realistic MTA capital plan
• Rethink the Penn Station project
• Control transit and commuter rail labor costs
• Push for more transparent, productive capital contracts
• Find substitutes for fuel taxes
• Make a fast, final decision on congestion pricing
• Appoint independent experts to the MTA board
viii
8. Housing New York
• Reverse rent regulation
• Encourage New Private Housing Development
• Reform and Repurpose Public Housing
• Cut red tape barriers to housing construction
9. Taming a “Taylor Made” Public-Sector Workforce
• Make collective bargaining more transparent
• Rejuvenate PERB to focus on the broad public interest
• Repeal the Triborough Amendment
• Set limits on binding arbitration settlements
• Limit the scope of collective bargaining
10. Opening a Wider Window on New York Government
• Set firmer deadlines for FOIL responses
• Improve the dispute resolution process
• Fix bad judicial and administrative FOIL precedents
• Increase access to public meetings
• Define “meetings” in 21st century terms
11. Voters Access, Election Integrity
• Require voters to provide proof of identification
• Reaffirm and strengthen absentee balloting restrictions
• Prevent ballot harvesting
• Scale back the nine-day early voting period
• Repeal the John Lewis Voting Rights Act
• Reject public campaigning financing
• Create a path for limited citizen initiative and referendum

1.
Getting a Grip
on the State Budget
By E.J. McMahon
New York has the nation’s second largest state budget, exceeded only by Cal-
ifornia’s. By any measure, New York State taxes and spends considerably more
than Florida or Texas, whose populations are larger and have been growing
faster.
1
In fiscal 2022, bolstered by extraordinary injections of federal aid, the total
New York State budget exceeded $200 billion for the first time.
Even more than most states, New York experienced a severe economic and
fiscal disruption following the COVID-19 outbreak in March 2020. Governor
Cuomo’s broad emergency-order lockdown of “non-essential” business and so-
cial activity triggered the virtually overnight loss of nearly 2 million payroll jobs
and a double-digit spike in unemployment among New Yorkers. For a time, the
shock waves seemed very likely to vaporize a chunk of tax revenues and precipi-
tate a fiscal crisis. But early predictions of massive deficits quickly dissipated amid
waves of federal relief aid—along with unexpected increases in the state’s tax rev-
enues in fiscal year 2021.
‡
Two years later, the pandemic crisis and its fiscal aftermath have given rise—
temporarily—to a state budget trend unique in New York’s history: rapid growth
in revenues, spending, and surplus reserves. Within two years of the pandemic’s
start, New York’s state spending had been inflated by tens of billions of dollars in
federal pandemic COVID-19 relief aid, further buttressed by surging income tax
payments on capital gains generated by a strong stock market recovery—topped
off by the proceeds of significant tax increases, enacted in the spring of 2021,
targeted at New York’s highest-earning individuals and corporations.
After growing by slightly more than two percent a year between fiscal years
2011 and 2021, cash disbursements from state operating funds surged 13 percent
in FY 2022 and were projected to increase by an additional 20 percent over the
next four years.
2
Albany’s supercharged post-pandemic spending trend is unsustainable in the
long run. How this fiscal cycle ends—in a soft landing, or a crash that prompts
even more tax increases—will be determined by the budgets of the next few years.
Before it’s too late, New York’s governor and Legislature should embrace fiscal
policies grounded in the three Rs of restraint, responsibility, and reform.
‡
New York’s state government fiscal year runs from April 1 to March 31; fiscal year or “FY”
notations throughout this volume refer to the calendar year in which the fiscal year ends.

THE NEXT NEW YORK
2
Spending should be reined in, taxes reduced, and economic competitiveness re-
stored as a top priority.
The state’s budget-making process—rushed, secretive, and increasingly clut-
tered with extraneous issues in recent years—needs to be more efficient, more
transparent, and more accountable to taxpayers.
THE STATUS QUO
From fiscal years 1987 through 2023, New York’s state operating funds spend-
ing increased by a compound average of 4.2 percent a year, considerably above
the average inflation rate of 2.8 percent during the same period. As shown in
Figure 1, state spending exceeded inflation in 27 of those 36 fiscal years, including
a dozen years in which disbursements grew at least two to three times inflation as
measured by the Consumer Price Index.
The longest stretch of relative budgetary restraint in Albany since the early
1980s was the decade leading up to the pandemic, when state operating funds
disbursements increased an average of 2.1 percent a year, compared to average
annual inflation of 1.5 percent. The budget’s nearly flat inflation-adjusted trajec-
tory from FY 2011 to FY 2021 reflected Governor Cuomo’s avowed commitment
to holding state operating funds spending growth to two percent a year.
To be sure, the official numbers are misleading, since the two percent bench-
mark was not achieved without the help of book-keeping gimmickry—most no-
tably through the pre-payment of debt service and some other expenses in most
years. In addition, starting in the spring of 2018, the Medicaid program was be-
ginning to burst the limits of the program’s supposed “global cap.” To conceal
that over-spending, the Cuomo administration delayed some Medicaid payments
from March, the end of the fiscal year, to April, the beginning of the next.
3
How-
ever, even adjusting for debt prepayments and Medicaid cash-flow rollovers, the
average spending increase before the pandemic appeared relatively low by histor-
ical standards, in the neighborhood of three percent.

Renewing and Reforming the Empire State
3
Rising capital debt
Not included in the state operating funds budget is capital projects spending,
largely funded by long-term bonds. Article VII, section 11 of the state Constitu-
tion explicitly prohibits the issuance of state debt unless approved in a voter ref-
erendum, and further limits such referendums to one “single purpose” at a time.
Yet generations of governors and legislatures have circumvented this requirement
by authorizing public authorities to borrow on the state’s behalf without involving
voters, and the Court of Appeals has upheld such arrangements.
4
Out of $62 bil-
lion in state debt outstanding as of FY 2022, only $2 billion (three percent) con-
sisted of voter-approved general obligation bonds.
5
Although New York’s constitutional restriction on state debt is exceptionally
stringent, the state’s total long-term debt burden measured as a share of state
GDP is 50 percent heavier than the national average, and more than those in
seven of 10 DOB-designated “peer states,” as shown in Table 1.
Relative to population, New York’s total long-term debt load of $5,134 per
capita was more than double the national average. Even using DOB’s narrower
measure of tax-financed “state-related” debt, New York’s total is higher than six
of its peers and almost twice the national average. New York’s relatively heavy
state debt load by both measures is noteworthy given the unusually large, sepa-
rately financed capital budgets of its county and municipal governments—espe-
cially New York City, which is fiscally and demographically larger than all but a
few states.
New York State’s 2023 capital financing plan forecasts a significant increase in
state-related debt over the next several years. Having averaged $55 billion over
THE NEXT NEW YORK
4
the previous decade, outstanding state-related debt jumped to $62 billion in FY
2022 and is forecast to hit nearly $88 billion in FY 2027.
The largest share of the state government’s capital spending perennially has
been devoted to transportation, principally the Department of Transportation
(DOT) five-year capital program for highways and bridges (see Chapter 7).
Governor Hochul’s FY 2023 Capital Program and Financing Plan projected a
big increase in capital spending, with the average annual total rising from $14.3
billion in FY 2020 to FY 2023 to $18.6 billion from FY 2024 through FY 2027.
Transportation capital spending was projected to average of $8 billion a year, a 28
percent bump from the FY 2020-2023 average of $6.5 billion.
In a notable shift, economic development is projected to displace higher edu-
cation as the second largest capital projects category in FY 2023-27, averaging
$2.2 billion in annual disbursements, more than double the average from 2010 to
2022. Most of this money will be funneled through the Empire State Develop-
ment Corp. (ESDC), New York’s umbrella agency for economic development,
whose five-year projected spending through FY 2027 comes to nearly $11 billion,
with the lengthy list of planned ESDC capital disbursements including $1.4 billion
for urban and rural broadband access, $500 million for offshore wind develop-
ment, and a $600 million state contribution to the $2 billion cost of building a
new Buffalo Bills stadium.
Capitalizing the pork barrel
During the late 1990s, the Legislature began creating new, wide-ranging cate-
gories of comprehensive capital project funding for a variety of state and local
projects, many (but not all) supporting economic development grant subsidies.
By 2005, these programs—essentially slush funds—had funneled more than $1.7
billion on capital grants benefitting a wide range of recipients including “profes-
sional sports teams, corporations, local governments, universities, churches, li-
braries and Little League groups,” with another $1.5 billion allocated but not yet
spent at that point, as the Center for Governmental Research reported.
6
The FY 2012 state budget included a new lump-sum pot, the State and Munic-
ipal Facilities Program (SMFP), initially with an appropriation of $385 million,
which was repeatedly increased until it reached nearly $2.4 billion in FY 2022.
7
As state Comptroller Thomas DiNapoli pointed out in a 2016 report, lump-
sum appropriations for SMFP “include little or no detail regarding the process for
allocating funds, or the purposes for which such funds are to be used, and the
agency or authority that will ultimately administer the funds is not identified.”
8
Reshuffling the tax deck
From FY 2011 to 2021, the state enacted several high-profile state tax cuts,
including a reduction in personal income tax rates in middle- and upper middle-
income brackets, and reductions in corporate taxes that included the elimination
of tax on incorporated manufacturing operations in upstate New York. The net
change in New York’s total tax burden during this period was minimal, however,

Renewing and Reforming the Empire State
5
because the revenue lost to tax cuts was effectively offset by repeated extensions
of New York’s single largest state income tax increase since the early 1970s.
In 2009, as part of the FY 2010 budget deal between then-Governor Paterson
and the Legislature, the top income tax rate was raised from 6.85 percent to 8.97
percent. Although the rate took effect at incomes of $500,000, it was widely re-
ferred to as a “millionaire tax,” and scheduled to expire at the end of 2011. How-
ever, in a December 2011 special session, Governor Cuomo and the legislature
agreed to extend the tax increase in modified form, as an 8.82 percent rate applied
to incomes starting just over $1 million for singles and $2 million for married joint
filers. This extension was linked to rate cuts on incomes between $40,000 and
$300,000 and “indexing” of tax brackets to reflect inflation.
The 2011 millionaire tax extension, initially set to expire in 2014, was extended
three more times, most recently to 2024. Meanwhile, the initial tax rate cuts for
middle- and upper middle-income brackets were succeeded by a broader plan of
rate cuts enacted in 2016. That tax cut was to be phased in over eight years, from
2018 through 2025.
9
By shifting a larger share of the state income tax to millionaire earners, the state
accelerated a longer-term trend. Over the past 35 years, New York State’s budget
has become more reliant than ever on personal income tax revenue dispropor-
tionately generated by a relatively small number of very high earners whose in-
comes are both volatile and highly portable. The upshot: personal income taxes
now make up fully two-thirds of the state’s total tax revenue, up from 50 percent
when Governor Mario Cuomo left office in the mid 1990s (see Figure 2).
Progressive taxation
New York’s personal income tax code has long been among the most progres-
sive of any state’s, placing a much heavier burden on high incomes than low- or
moderate-income households.
10
In 2020, the highest-earning one percent of New
Yorkers (with incomes starting at $655,835) reported 32 percent of adjusted gross

THE NEXT NEW YORK
6
income but paid 46 percent of income taxes paid by full-year state residents, as
shown in Figure 3. And as shown in Figure 4, even prior to the most recent in-
creases for top earners and cuts in lower brackets, the effective tax rate paid by
the highest-earning one percent of all New Yorkers was more than double the
rate paid by middle-income filers.
The state raised marginal tax rates further in 2021, as part of the changes en-
acted with the FY 2022 state budget.
11
As detailed below in Table 2, the personal
income tax changes added three new brackets on incomes starting just above $2
million for married joint return filers (or $1 million for singles), translating into
higher tax payments of nine percent to 24 percent. For New York City residents,
the combined rates on millionaire incomes are now the highest in the country,
exceeding California’s statewide rate of 13.3 percent.

Renewing and Reforming the Empire State
7
New York’s higher income tax rates, originally projected to generate $4 billion
a year in added revenue by 2025, are scheduled to expire in 2027. The FY 2022
revenue bill also eliminated the 2024 sunset on the 2011 millionaire tax hike, mak-
ing it permanent. This change by itself constituted New York’s most significant
permanent-law income tax increase since the 1960s.
High-earner erosion
The state financial plan assumes that high-income households will remain lit-
erally and figuratively unmoved by the most significant hike in marginal rates since
the early 1970s. In fact, however, between 2010 and 2020, Internal Revenue Ser-
vice data show New York’s share of the nation’s millionaire earners decreased
from 12.7 percent to 8.9 percent, the lowest level on record.
12
State personal income tax data from the first tax year affected by the pandemic
disruption indicate that New York was continuing to lose high earners in the wake
of the March 2020 Covid-19 outbreak.
13
In 2020, the state’s personal income tax
base included 54,824 full-time New York resident with incomes of $1 million or
more, which was down slightly from the 2019 total of 55,308. During the same
period, the number of full-year nonresident and part-year resident New York tax-
payers rose from 70,222 to 73,899 filers in the $1 million-and-up bracket.
14
Mil-
lionaire earners living in Florida accounted for the largest share of new full-year
nonresident filers; there were 7,218 Floridians who owed some New York income
tax in 2020, compared to 6,471 in the previous year.
Despite the continuing decline in the number of high-earning New York resi-
dents, and massive job losses in the early months of the 2020 pandemic, the Em-
pire State’s personal income tax collections rose a healthy $1.3 billion, or 2.4 per-
cent, in the fiscal year ending March 31, 2021. The higher-than-expected tax rev-
enues were due mainly to the unexpectedly strong recovery of stock prices in the
second half of 2021, which boosted the capital gains component of New York’s
income tax base to $132 billion—up 58 percent from the previous year to a new
all-time high, exceeding the previous record set in 2007. The increased net capital
THE NEXT NEW YORK
8
gains of New York’s income millionaires generated at least $3 billion in added
state tax revenue, more making up for the decline in total taxes paid by lower-
earning households.
But investment income is highly volatile. For example, New Yorkers’ net cap-
ital gains fell by 67 percent, from $62 billion to $20 billion, in the two years fol-
lowing the dot-com crash of 2000. Over the next five years, the S&P 500 recov-
ered to just above its peak 2000 level, and the capital gains component of the state
tax base soared to $116 billion. But stock prices then fell 56 percent from October
2007 to March 2009, and New Yorkers’ net capital gains crashed by 75 percent.
In FY 2023 terms, a capital gains decline of even half that magnitude would trans-
late into a revenue decline of roughly $4 billion.
The pinch of SALT
The impact of state tax increases in high-income brackets has been com-
pounded by the $10,000 cap on federal deductions for state and local taxes
(SALT), enacted as part of the Tax Cuts and Jobs Act (TCJA), which took effect
in 2018. Despite New York’s higher average SALT deductions under previous
law, the other major provisions of the TCJA resulted in net tax cuts for most New
York taxpayers, including a majority of middle-income residents who previously
could claim a SALT deduction for their high property taxes. The negative impact
of the SALT cap is overwhelmingly concentrated among New York’s highest
earners—especially those with incomes topping $1 million a year, nearly 30 per-
cent of whom are paying higher taxes under the new law.
15
For taxpayers claiming it, the pre-2018 SALT deduction functioned as a dis-
count, reducing the effective impact of the statutory state and local rate. In 2011-
17, for example, the SALT cap reduced New York’s top rate 8.82 percent to 5.3
percent; even in the early 1970s, when the state’s top income tax rate was 15.35
percent, its effective cost was just 4.6 percent. With no federal deduction, the
state’s current top rate on the same earners starts ranges from 9.65 percent to 10.9
percent, by far the highest effective rates in New York’s history.
The state sought with a series of workarounds designed to preserve the deduc-
tion for at least some taxpayers. The most significant by far has been the Pass-
Through Entity Tax, or PTET, created by the FY 2022 budget, which effectively
allows owners of many closely held businesses to claim federal tax deductions and
state tax credits for net profits that “pass through” to them as personal income.
Where the buck stops
Under New York’s Executive Budget system, the governor shapes budget pri-
orities and is the dominant, agenda-setting player in the budget-making process.
The governor’s budget authority is laid out in Sections 1 through 6 of Article
VII of the state Constitution. The first two sections require the governor to as-
semble departmental budget requests, to present a budget (“a complete plan of
expenditures … and all monies and revenues estimated to be available therefor”)
by certain dates early each year.
Renewing and Reforming the Empire State
9
Section 3 describes the governor’s responsibility for submitting budget bills,
his or her ability to “amend or supplement” those bills within 30 days of submis-
sion, and his or her ability, with the consent of the Legislature, to submit budget
amendments or “supplemental bills” after the budget has been adopted. Budget
bills are a unique category of legislation, introduced automatically without spon-
sorship in the Assembly and Senate.
Section 4 prevents the Legislature from altering appropriations language “ex-
cept to strike out or reduce items therein.” It further provides that, once passed,
appropriation bills become law without further action by the governor—except
that both the legislative and judiciary budget “and separate items added to the
governor’s bills by the Legislature” are subject to the governor’s approval or veto.
Section 5 restricts the Legislature’s ability to appropriate money before the
governor’s executive budget bills have been “finally acted upon.” Section 6 in-
cludes a crucial “anti-rider” clause, which stipulates that the provisions of the
governor’s appropriations bills must be “specifically” related to “some particular
appropriation” in those bills.
The constitutional provisions are buttressed by State Finance Law, which re-
quires the governor to update the state’s financial plan within 30 days of the close
of each fiscal quarter.
16
The Budget Reform Act of 2007
17
further amended the
Finance Law to ban the Legislature from adding lump-sum appropriations, to
require the governor and Legislature to meet by mid-November for a “quick
start” release of revenue projections; and to require the Legislature to present its
members with reports detailing the impact of changes to the governor’s budget
before the final adoption vote. The 2007 law also required the governor to pro-
vide more itemization of some programs in budget bills and banned the Legisla-
ture from making lump sum appropriations.
While the Legislature cannot alter appropriations bill language, it can add sep-
arate line items for any purpose—and if the governor vetoes these items, a two-
thirds majority can override those vetoes. In addition, the Legislature effectively
has its own budget veto, in the form of its Section 4 power to “strike out or reduce
items” in an Executive Budget appropriations bill before the bill is passed.
The extent of the governor’s authority under the Executive Budget law has
been tested in a series of court battles between the governor and the Legislature,
dating back to the late 1920s. The latest two landmark rulings by the Court of
Appeals stemmed from two of Governor George Pataki’s second-term budgets.
18
The first, Silver v. Pataki, arose when the Legislature followed up its adoption
of the governor’s 1998-99 appropriation bills by enacting single-purpose, non-
appropriation Article VII language bills changing the purposes for which the
money could be spent. The second case, Pataki v. Assembly, stemmed from Pataki’s
2001-02 budget bills, which among other things incorporated the governor’s pro-
posed changes to the local school aid formula in appropriations language, rather
than following the previous practice of putting formula changes in a non-appro-
priations budget bill.
The two cases were jointly decided by the Court of Appeals in December 2004,
with a 5-2 majority upholding the governor’s executive budget powers in both
cases. Within the majority, there was broad agreement with Judge Robert Smith’s
opinion that, in both budgets, the Legislature had “altered the Governor’s appro-
priation bills in ways not permitted by the Constitution.”
THE NEXT NEW YORK
10
Over-reaching budget bills
Any changes in state law required to implement the annual Executive
Budget—for example, creation of a new fee, or an increase or decrease in an ex-
isting tax—are submitted by the governor in what are commonly referred to as
“budget language bills,” or “Article VII bills.” Typically organized by subject mat-
ter, these measures are strictly separate from appropriations bills, which are a con-
stitutional category unto themselves.
19
To a far greater extent than any of his predecessors, Governor Andrew Cuomo
sought to include non-budget items—including such major policy changes as a
statewide $15 minimum wage—within his non-appropriation Article VII bills. He
and legislative leaders also negotiated budget deals in which non-budget policy
items were added to the bills before passage. A particularly glaring example of this
practice was the inclusion of controversial criminal justice “reforms”—including
elimination of cash bail for many crimes (see Chapter 2)—in a 266-page Revenue
Bill enacted with the FY 2020 budget in April 2019.
20
Likewise, three years later,
amendments to those criminal law changes were bundled with numerous other
non-budget items in FY 2023 budget legislation, this time as subparts of the 313-
page Education, Labor and Family Assistance budget language bill.
21
Critics of New York’s executive budget system cite such instances as evidence
that the governor has too much power to change state laws through the budget-
making process. However, neither the original Executive Budget law nor the more
recent Court of Appeals decisions empowered the governor to force legislative
action or insist the Legislature act on any supposedly budget-related measure out-
side of appropriation bills. The Legislature remains free to reject, rewrite or sup-
plement any non-appropriations Article VII bill provision, as long as the effect is
not to alter language in appropriations bills.
Legacies of lateness
For an almost unbroken period of 25 years prior to 2011, New York State’s
budget was not enacted before the start of the April fiscal year. In some years, the
final deal was not reached until several months past the March 31 deadline. Unlike
some other states and the federal government, New York State never experienced
an actual government shutdown due to its failure to enact a timely budget, since
Governors Mario Cuomo and George Pataki routinely submitted temporary
budget extender bills to meet payrolls while negotiations dragged on.
While the budget delays created some cash-flow stress for local governments
dependent on state aid payments, they had little noticeable impact on the vast
majority of New Yorkers. But the chronic lateness fed the impression of terminal
gridlock and dysfunction in Albany, adding to the negative financial factors hold-
ing down the state’s credit rating.
The last significantly late budget came in 2010, when state finances were
stressed in the wake of the Great Recession and the impending fade-out of tem-
porary federal stimulus aid. Like his predecessors, Governor Paterson had sent
the Legislature temporary extender bills once the state began the 2011 fiscal year
without adopting a final budget.
Renewing and Reforming the Empire State
11
When the Senate and Assembly refused to drop spending demands beyond
what the governor thought the state could afford, the governor began using the
extender process to force-feed large chunks of the full annual budget bills calling
for lower spending levels. A complete budget effectively was enacted in this piece-
meal fashion, largely on the governor’s terms, by the end of June. Most budgets
since then have been adopted by April 1 or within two weeks of that date.
Self-inflicted “extortion”
A new twist in New York’s 2019-20 budget process was the unprecedented
linkage between “timely” passage of the budget and a legislative pay raise—a con-
dition imposed by a committee on compensation created by the Legislature in
2018 as part of the 2018-19 budget.
22
The governor’s added ability to pressure
lawmakers into a budget deal was compared by one member, not unreasonably,
to “extortion.”
23
But the Legislature itself set the stage for this situation by dele-
gating the salary issue to a compensation committee.
The Legislature passed up an opportunity to permanently veto the resulting
committee report and recommendations at the end of 2018. Even now, the entire
compensation scheme—as well as the 1998 law temporarily withholding legisla-
tors’ pay when a budget is late—could be repealed by the Legislature at any time,
although its constitutionality recently was upheld by the state’s highest court.
24
MOVING FORWARD
Flattening the curve of spending to put New York State’s finances on a more
sustainable footing—while also, crucially, adjusting taxes to a more competitive
level—will be a stiff multi-year challenge. Under the state’s nearly century-old Ex-
ecutive Budget system, the procedural and institutional tools exist to make these
goals a reality, but both the governor and the Legislature must be willing to play
their parts in using them. The to-do list of necessary policy changes and reforms
is long, but would start with these priorities:
• Reduce projected spending. Efforts to find savings in a $121 billion state
operating funds budget necessarily must start with Education and Medi-
caid, which already consume half the operating budget and are on track to
grow faster than all other areas combined. As noted in Chapter 3, New
York’s per-pupil spending on public schools is higher than any state’s and
approaching double the national average, yet educational results are gener-
ally mediocre. The still-unfolding $4 billion increase in Foundation Aid
should be suspended, reconsidered, reduced, and restructured to favor
poorer districts and to programs offering more educational choice, starting
with additional charter schools. The Medicaid budget has ballooned by 76
percent in 10 years, and the program badly needs the kind of structural re-
forms discussed in Chapter 4. There should be a renewed effort to modern-
ize and right-size government through a revived version of the Spending
and Government Efficiency Commission created in 2011, this time focus-
ing on remote-work implications for agency operations. Additional
THE NEXT NEW YORK
12
resources can be freed through repeal of corporate tax subsidies and loop-
holes—starting with the $420 million a year Film Production Credit, which
is the biggest giveaway of its kind in any state.
• Roll back tax increases. In early 2009, before enactment of the first tem-
porary millionaire tax, Assembly Ways and Means Committee staff de-
scribed the state’s dependence on high-income taxpayers as “inherently un-
stable,” “volatile” and “unsustainable.”
25
Subsequent tax policies have only
made it worse. The latest income tax hike on high earners, enacted in 2021,
is projected to raise $4 billion a year before its scheduled expiration in
2027—but the history of previous supposedly temporary tax hikes suggests
pressure will grow for extension of the increases as the sunset date gets
closer. To prevent further erosion in the tax base, the tax hikes should in-
stead be phased out at a steady rate, starting in tax year 2023.
• Move the fiscal year start date to July 1. New York’s unusually com-
pressed budget-making schedule, allowing barely two months for legislative
consideration and airing of the Executive Budget, has contributed to the
hastiness and secrecy surrounding the process. Moving the start date from
April 1 to July 1 would match the existing schedule in 46 states and the City
of New York. It also would restore the state fiscal calendar in effect during
New York’s first 15 years under the executive budget system, allowing
more time for legislative analysis and consideration of a budget that the
Constitution requires the governor to submit between mid-January and
Feb. 1. Extending the budget process through most of the session also
would eliminate any rationale for packing non-budgetary program items
into Article VII budget bills, and it would allow the budget to be finalized
after the final settlement on personal income tax receipts in mid-April.
• Mind the GAAP. The Constitution requires the governor to propose a
balanced budget, and the 2007 Budget Reform Act requires the Legislature
to adopt one. By statute, however, New York’s financial plans are calcu-
lated on a cash basis, which recognizes receipts when money is received
and disbursements when money is paid out. This accounting standard
makes it easier to manipulate the budget’s perceived fiscal integrity and sus-
tainability by, for example, rolling one year’s expenditures into the next. A
better standard for budgeting would be the “modified accrual” method
consistent with Generally Accepted Accounting Principles (GAAP), which
requires revenues to be recognized when earned, and expenditures to be
recognized when a liability is incurred. The standard was imposed on New
York City during the mid-1970s financial crisis to minimize the kind of ac-
counting gimmicks that had helped drive the city into virtual bankruptcy.
• Establish a Legislative Budget Office (LBO). A nonpartisan and pro-
fessionally staffed LBO, modeled on the Congressional Budget Office,
could provide a much-needed source of economic and policy analysis for
the public and lawmakers alike. The new agency could be funded primarily

Renewing and Reforming the Empire State
13
through a combination of existing appropriations for four separate fiscal
committee staffs, as proposed in a bill introduced in 2019 by Sen. Liz Krue-
ger, chair of the Senate Finance Committee.
26
As summed up in her bill, the
LBO’s core mission would be to “increase the legislature’s understanding
of the budget and how it affects New Yorkers.” Similar joint nonpartisan
committees exist in California and in New Jersey, among other states.
• Shut the borrowing backdoor. The constitution should be amended to
clearly require voter approval of state capital debt issues backed by a pledge
of state revenue. This would include the creation of any new categories of
state-backed bonds, such as the personal income tax-backed “PIT bonds”
that have proliferated over the past 20 years, which should also require
voter authorization subject to borrowing caps that could only be lifted with
voter approval. The constitutional amendment should also allow submis-
sion of multiple bond issue propositions in a single year.
• Ban lump sum appropriations. As proposed by the comptroller, the
State Finance Law should be amended to prohibit the Executive, as well as
the Legislature, from introducing or continuing any form of lump-sum ap-
propriations, such as those used to support the State and Municipal Facili-
ties Program. All funds should be allocated, up front, to a specific list of
grantees through an open, competitive process with clear, measurable crite-
ria, subject to regular audit by the comptroller and pre-released pursuant
Freedom of Information Law at every stage.
• Enforce financial plan deadlines. Governor Cuomo routinely failed to
meet his Oct. 30 Mid-Year Financial Plan update deadline, and after releas-
ing the FY 2022 Mid-Year Update on schedule in October 2021, Governor
Hochul did not release the FY 2023 mid-year report until 11 days past the
due date. The Legislature, meanwhile, has in the past disregarded its own
deadlines for issuing revenue estimates and meeting with the governor and
comptroller to “quick start” the process. The governor and the Legisla-
ture—both houses and both conferences in each house—should live up to
their responsibilities under the law, period.
ENDNOTES
1
See National Association of State Budget Officers, State Expenditure Report, Table A-1, page 122, at
https://www.nasbo.org/mainsite/reports-data/state-expenditure-report.
NASBO’s data for 2022 fiscal years pegged state funded expenditures excluding bonded capital at
$121 billion in New York, compared to $309 billion in California, $60 billion in Florida and $70 bil-
lion in Texas. The Census Bureau’s Annual Survey of State Government Finances similarly shows New
York’s state tax collections exceeding those of all states except California. https://www.cen-
sus.gov/programs-surveys/state.html.
2
New York’s budgetary accounting system has four different categorical approaches to measuring
cash disbursements (spending) and receipts (revenues): All Funds, the most inclusive, which includes
spending from all revenue sources including federal grants and the proceeds of capital bonds; State

THE NEXT NEW YORK
14
Funds, which covers spending from all revenue sources except for federal grants; State Operating
Funds, which excludes capital projects but includes all disbursements supported by state revenues
(taxes, fines, fees, and tuition), including revenues dedicated to a particular purpose, such as Lottery
aid to schools; and the General Fund, which is spending funded by all state revenues except those stat-
utorily earmarked for a particular purpose.
3
By early 2020, Medicaid was running 16 percent over budget—opening a $4 billion deficit in the
state’s financial plan. See “Albany’s Self-Inflicted Medicaid Crisis” by Bill Hammond, City Journal,
January 2020. https://www.city-journal.org/new-york-medicaid-crisis
4
The court rulings effectively upholding backdoor borrowing came in a series of unsuccessful legal
challenges filed in the 1970s by Leon Wein, a Brooklyn Law School professor and, most recently, in
Schulz v. State of New York, 84 N.Y.2d 231 (1994)
5
State of New York, FY 2023 Enacted Capital Program and Financing Plan, p. 98.
6
Kent Gardner and Erika Rosenberg, “Capital Pork: How State Politicians Divvy Up Billions for Fa-
vored Capital Projects,” Center for Governmental Research, March 2006. www.cgr.org.
7
Most SMFP grants fund local amenities such as skateboard parks, walking trails, school athletic fields,
and improvements to municipal buildings, along with some large economic development grants to pri-
vate developers and corporations, but some of the largest have been steered to private businesses.
8
“Unfinished Business: Fiscal Reform in New York State,” Office of the State Comptroller, May 2016.
https://www.osc.state.ny.us/files/reports/budget/pdf/budget-fiscal-reform-2016.pdf
9
As part of the FY 2023 budget, the remaining phases of this tax cut were accelerated to take full ef-
fect in calendar year 2023.
10
Frank Sammartino and Norton Francis, “Federal-State Income Tax Progressivity,” Tax Policy Center,
June 2016. https://www.taxpolicycenter.org/sites/default/files/publication/131621/2000847-fed-
eral-state-income-tax-progressivity.pdf
11
The same revenue bill included a temporary three-year increase, from 6.5 percent to 7.25 percent,
in state tax on business income above $5 million and increase in the capital base tax estimation
method for non-manufacturers.
12
E.J. McMahon, “New York lost more high-earning taxpayers in pandemic-wracked 2020,” Dec. 19,
2022, post at
https://www.empirecenter.org/publications/new-york-lost-more-high-earning-taxpayers-
in-pandemic-wracked-2020/
13
NYS Department of Taxation and Finance, Personal income tax summary datasets through tax year
2020, https://www.tax.ny.gov/research/stats/statistics/pit-filers-summary-datasets-beginning-tax-year-
2015.htm
14
Nonresidents must pay New York income tax on any wage, salary or net profits earned from work
or business activity in the Empire State, but not on capital gains and other investment- and savings-re-
lated income.
15
See summary of Empire Center analysis on the SALT cap’s impact in New York, “The SALT Story:
Washing Away the Brine,” at https://www.empirecenter.org/salt/
16
Finance Law Section 24.3
17
Chapter 1 of the Laws of 2007.
18
Pataki v New York State Assembly, 2004 NY Slip Op 09320 [4 NY3d 75] December 16, 2004. A
video of the arguments before the Court of Appeals is posted at
https://www.nycourts.gov/ctapps/news/Pataki-vNYSAssembly.html.
19
At the time of introduction by the governor, appropriations bills customarily are grouped into five
categories: State Operations, Aid to Localities, Capital Projects, and Legislature and Judiciary (in the
latter case, the governor cannot alter appropriations sought by the other branches of government).
Separate Article VII bills typically are introduced in at least five core subject areas: Revenue; Educa-
tion, Labor and Family Assistance; Public Protection and General Government; Health and Mental Hy-
giene; Transportation, Economic Development and Environmental Conservation.
20
The changes were contained in Parts JJJ and LLL, respectively, of Ch. 59 of the Laws of 2019, availa-
ble at: https://www.nysenate.gov/legislation/laws/CPL/A245
21
Ch. 56 of the Laws of 2022.
22
Ch. 59 of the Laws of 2018, Part HHH.
23
“Assemblyman says Cuomo’s using pay-raise ‘extortion’ to pass budget,” New York Post, March 3,
2019.
24
Delgado v. State, opinion at https://caselaw.findlaw.com/ny-court-of-appeals/2022923.html.
25
New York State Assembly Revenue report, February 2009, p. 40, http://www.assem-
bly.state.ny.us/comm/WAM/2009RevRep/2009RevRep.pdf
26
S.3287/A.1835 of 2019-20.
2.
Restoring Public Safety
By Rafael Mangual
New York was the site of what was surely one of the most significant govern-
ment-led achievements in urban American history: a steep drop in serious violent
crime, continuing across a 25-year period from the early 1990s well into the sec-
ond decade of the 21st century.
As of 1990, New York State’s violent crime and murder rates per 100,000 res-
idents had reached 1,180.9 and 14.5, respectively. By 2015, those measures had
plummeted to 379.7 and 3.1—respective declines of 68 percent and 79 percent.
The statewide reduction in criminal violence was concentrated in New York City,
which had accounted for nearly 87 percent of the 2,605 murders reported to the
FBI by New York State in 1990. Then as now,
1
violent crime was significantly
concentrated within small slices of the city’s neighborhoods, whose black and La-
tino residents
2
benefitted most from the decline.
As crime plummeted, New York City blossomed. Over the course of a single
decade, the once crime-ridden, under-developed city depicted in gritty vigilante
and gangster movies
3
—whose northern-most borough was infamously observed
in flames by horrified viewers of the 1977 World Series
4
—rebranded itself as the
safest big city in America.
5
In recent years, however, the previously steady decline in violent crime in New
York has ground to a halt—and even begun to reverse. An uptick in violent crime,
concentrated in the state’s urban centers and accelerating during the first year of
the COVID-19 pandemic, constitutes perhaps the most serious challenge for pol-
icymakers. Successfully meeting that challenge and addressing those concerns will
require an understanding of what lies at the root of the problem.
THE STATUS QUO
New York’s success on the crime control front coincided with meaningful
changes to policing and criminal justice policy. Informed by (1) the insights of the
Broken Windows theory
6
advanced by James Q. Wilson and George L. Kelling,
and (2) a better understanding of (and a deeper appreciation for) crime data, po-
licing in New York City became more responsive to the concerns of residents
regarding both serious crime and quality-of-life offenses.
Led by a bold new Commissioner in William J. Bratton, who was appointed by
Mayor Rudolph Giuliani in 1993, the New York Police Department also adopted
a more aggressive mission aimed at preventing, rather than merely responding to,
serious crime.
7
For the first time ever, the NYPD—through its development and
use of CompStat,
8
which is now used by police departments around the world—
was, in the 1990s, using data to deploy officers, gather intelligence, and measure

THE NEXT NEW YORK
16
its effectiveness. Those efforts were boosted when, thanks to the federal Violent
Crime Control and Law Enforcement Act of 1994, the department received grant
money to facilitate the hiring of new officers, augmenting a build-up funded by
the Dinkins-era “Safe Streets, Safe Cities” dedicated tax, as well as the redeploy-
ment of officers that had been tasked with clerical and administrative duties.
9
New York’s new approach to policing, which featured tactics like Stop, Ques-
tion, and Frisk
10
and “flooding the zone”
11
was backed by a broader criminal jus-
tice system committed to taking (and keeping) a great many of those arrested and
convicted of crimes off the street. That commitment is illustrated by the data on
statewide incarcerations, which reflect a sharp upward trend in imprisonment be-
ginning in 1980 and continuing through the year 2000 (see Figure 1, below), which
was made possible by a major state prison expansion that started in the 1980s.
That uptick in incarceration was, perhaps not coincidentally, accompanied by
sharp declines in violent crime from 1990 to 2000, as shown in Figures 2 and 3.
The more recent increase in crime seems to be a predictable result of criminal
justice “reforms” that undermined or even deliberately reversed the successful
policies of the 1990s and early 2000s. Restoring public safety will require a reori-
entation of the criminal justice system around a public safety, rather than a re-
form-centric, mission. This worked in the past and can work again.
Source for Figures 2 and 3: New York State Division of Criminal Justice Services

Renewing and Reforming the Empire State
17
After back-to-back nationwide spikes in homicides in 2015
12
and 2016,
13
many
parts of the country saw their public safety pictures deteriorate significantly. New
York experienced smaller murder increases those years,
14
but the state (for a time)
quickly recovered. Just 547 homicides were reported statewide in 2017 (a 40-year
low)—including only 292 in New York City (an all-time low).
15
Recent research suggests that the post-2010 decline in gun violence that took
place in New York City may have been driven in significant part by enforcement
efforts that targeted high-risk offenders with an eye toward securing their inca-
pacitation, leading to fewer victimizations in some of the city’s pockets of con-
centrated crime.
16
Despite that progress, however, New York City would see
homicides rise every year from 2018 to 2021. Statewide, murders rose in 2015,
2016, 2018, and 2020. The state’s 2020 homicide spike was 46.7 percent, which
was identical to New York City’s 2020 murder spike.
17
In 2020 and 2021, respec-
tively, Buffalo saw 65 and 67 homicides—significantly more than the 46 homi-
cides the city had averaged between 2015 and 2019.
18
Syracuse recorded its worst
year for homicides in 2020,
19
a level repeated in 2021.
20
Albany also has experi-
enced a homicide spike
21
since 2020, a year when shooting incidents in the state’s
capital city more than doubled.
22
NYS Arrest, Conviction and Incarceration Trends, 2017-21
Source: New York State Division of Criminal Justice Services

THE NEXT NEW YORK
18
The sharp downward trendline in the state’s violent crime and homicide rates
illustrated by Figures 2 and 3 leveled off shortly after the turn of the century; and,
in the case of the state’s murder rate, the trendline began to turn upward in the
second half of the decade.
The end of what had been a decades-long downward trend in violence was
preceded by the start of a sustained downturn in the state’s incarceration rate.
After New York’s violent crime numbers plummeted, the state began imprisoning
fewer and fewer offenders after 2000. That trend toward decarceration—i.e., re-
ducing the number of people imprisoned—has continued through the time of
this writing, as shown in Figure 1.
New York’s post-2000 prison decarceration trend followed a decrease in the
number of arrests, as well as in the share of arrests resulting in convictions and
incarcerations. The decreases seem to be driven in part by a recent upswing in the
share of adult arrests resulting in dismissals depicted in Figure 5—to say nothing
of the 2020 releases and diversions related to efforts to reduce the spread of
Covid-19 in correctional facilities
.
23
The sustained decline in New York’s prison population (persons serving at
least one-year sentences for felonies) has been accompanied by a steady decline
in the state’s jail populations (persons detained while awaiting trial or serving
lesser sentences). Total jail populations in the state have gone from a daily average
of 25,000 in 2016 to just over 15,000 in 2021—bottoming out in 2020 at just over
12,600, as shown in Figure 8. As with crime statistics, this statewide decrease trend
was driven primarily by trends in New York City.
Change of directions
As New York streets got safer, tolerance for aggressive (and effective) law-
enforcement practices began to erode and calls for reforms aimed at addressing
“mass incarceration” and “police brutality” grew louder. Those calls informed a
movement that grew in strength in the 2010s in New York and throughout the
nation in the wake of high-profile examples of the criminal justice system’s ex-
cesses—such as the jailing and subsequent suicide of Kalief Browder
24
in New
York—as well as cases of alleged police abuses.
Renewing and Reforming the Empire State
19
After the murder of George Floyd by a Minneapolis police officer and ensuing
riots in many cities in 2020, the national criminal justice and police reform move-
ments went into overdrive. New York was no exception.
Following a surge in crime beginning in the 1960s, changes to criminal justice
policies in New York during the final quarter of the 20th century almost uniformly
signaled a tougher approach to crime. But the criminal justice “reforms” of the
2000s have run in the opposite direction—easing restrictions and penalties for
those suspected and accused of crimes. Collectively and on their own, these more
recent changes have undermined policing, prosecution, and public safety.
The bail rollback
In line with the national push among many criminal-justice reform advocates
to cut the nation’s incarceration rate (in jail and prison), a push to curtail cash bail
with the hope of depopulating the Empire State’s jails gained steam in the mid-
2010s—particularly after Browder’s tragic case came to represent the alleged in-
justices inherent in the state’s pretrial detention policies.
25
Signed into law as a
provision of state budget legislation
26
in April of 2019 and taking effect in January
2020, the new bail regime placed new limits on judicial options regarding the re-
lease of pretrial defendants.
The legislation drastically shrank the scope of criminal cases in which judges
are allowed to require bail or remand defendants to pretrial detention.
27
It also
placed limits on the conditions (such as electronic monitoring) that judges can
impose on a defendant “who poses a risk of flight to avoid prosecution.” In such
cases, the law stipulated, “the court must select the least restrictive alternative and
condition or conditions that will reasonably assure the principal's return to court.”
This language thus retained the state’s longstanding prohibition on the judicial
consideration of the public safety risk posed by a given defendant when making
any decisions related to pretrial release.
New York’s exceptionalism
New York State is the only state imposing a blanket ban on the judicial con-
sideration of dangerousness in all aspects of the pretrial release decision-making
process.
28
The law also requires judges to “explain … on the record or in writing”
their rationale for imposing conditions on pre-trial release, effectively an added
hurdle to pretextually imposing high bail amounts in order to secure a defendant’s
detention based on perceived risks.
For all intents and purposes, the 2019 changes to bail laws (despite modest
amendments in 2020 and 2022
29
required release on recognizance for all defend-
ants not deemed a flight risk. Bail is now limited to cases involving “qualifying
offenses”—almost all of which are high-level felonies involving violence, the
threat of violence, or sexual exploitation.
Those exceptions in themselves amount to a tacit admission that dangerous-
ness ultimately does matter, reflecting a glaring incongruity between the law’s
plain language and how it is structured.
THE NEXT NEW YORK
20
The impact
As illustrated by Figure 8 above, the primary impact of New York’s bail reform
was to reduce the jail population constituted by pretrial defendants. This shift
could impact crime primarily through the erosion of two mechanisms through
which public safety benefits can be secured: incapacitation and deterrence.
By allowing a larger share of accused criminal defendants to spend the pretrial
period on the street, New Yorkers became more vulnerable to crimes committed
by this population. Perhaps the most pertinent statistics to illustrate the bail re-
form’s effect on crime via reduced incapacitation are those regarding the sharp
upticks in shares of total arrests and violent felony arrests constituted by offenders
with pending cases in the state’s largest city.
In 2019, 19.5 percent of total arrests and 20.2 percent of violent felony arrests
by the NYPD were of offenders with pending “open” cases. In 2020, those fig-
ures jumped to 24.4 percent and 25.1 percent, respectively—precisely what one
would expect to see if pretrial release reform harmed public safety.
30
While no analyses of New York’s bail reform law have been done with an eye
toward assessing the reform’s impact on deterrence, a large body of research
shows that immediacy is one of the most important determinants of a given sanc-
tion’s deterrent effect.
31
Given that New York State’s new bail law meant an arrest
was much less likely to be accompanied by immediate financial consequences (or
a trip to jail), the costs associated with certain criminal activity are likely now per-
ceived to be lower by criminal actors, who, in turn, may be less likely to be de-
terred by the prospect of an arrest today than they would have been prior to the
law’s implementation.
Seeking to minimize the negative impact of the new law, advocates of mini-
mizing bail often cite an Albany Times Union analysis of data released in January
2022 by the state Office of Court Administration and Division of Criminal Justice
Services.
32
The main finding: between July 2020 and June 2021, “just two percent
of released defendants were rearrested for a violent felony during the pretrial pe-
riod.”
But that report was flawed and misleading in three crucial respects.
First, the fact that a defendant was not rearrested does not in itself demonstrate
that he or she did not commit a new crime, since most crimes are neither reported
nor solved.
Second, the report focused on defendants rearrested for violent felonies, but
did not count total rearrests of pretrial releasees. In particular, the data did not
tabulate rearrests after a defendant’s first rearrest. This would lead to an under-
count of violent felonies committed by defendants who had already been rear-
rested on less serious charges while awaiting trial.
Third, the baseline denominator for the analysis was the total number of de-
fendants released, rather than the subset who might have been detained or subject
to more restrictive release standards based on a dangerousness standard.
One such subset is the population of defendants placed in supervised release
programs—many of whom, under previous law, might have been detained based
on an inability to make bail. In fact, a January 2022 analysis by The City, based on
the same state data sources cited in the Times Union report, found that 41 percent
Renewing and Reforming the Empire State
21
of supervised release program participants were rearrested, with 23 percent rear-
rested for a felony.
33
The new discovery burden
In addition to changing bail laws, other provisions enacted in 2019 significantly
elevated the compliance burden for prosecutors by expanding the information
that must be shared with defense attorneys as part of the pre-trial discovery pro-
cess, and compressing the time period in which this sharing must take place.
34
Key
provisions of the new law require prosecutors to assemble and deliver to defense
attorneys 21 types of materials, including:
o names and contact information of all those with information relating to
the case, with limited exceptions for confidential informants, members of
criminal enterprises, 911 callers, and victims or witnesses of certain sex
offenses;
o all relevant electronic recordings (again with very limited exceptions), in-
cluding body camera footage of responding officers (which prosecutors
would first have to review and appropriately redact);
o information regarding any expert witnesses and their qualifications; and
o the results of any relevant scientific or physical tests, examinations, or re-
ports completed by investigators.
New York’s pre-2020 discovery rules only required that materials other than
exculpatory evidence be turned over to defense counsel prior to trial—a relatively
rare occurrence, given the rate at which criminal cases were disposed of via plea
bargains. But under the new law, prosecutors must comply with these require-
ments within 20 days of arraignment for cases involving defendants detained pre-
trial, and within 35 days of arraignment for defendants who are released while
awaiting trial. Significantly, plea bargains are not allowed until at least three days
after discoverable materials have been turned over.
Failure on the part of the prosecution to fully comply with these new discovery
burdens can be met with sanctions including a ban on presenting certain evidence,
a mistrial, or even case dismissal (which, as shown in Figure 9, has become a more
common occurrence since 2020). These new rules could force prosecutors to de-
lay bringing certain cases, or to avoid pressing some charges in light of the addi-
tional information-gathering burden, which prosecutors were not given new fund-
ing to meet. District attorneys unable to do substantially more with less must
simply do less.
Beyond putting more cases in jeopardy, and potentially leaving more offenders
on the street, the new discovery provisions have left prosecutors unable to assure
witnesses that their cooperation will remain a secret
.
35
Finally, complying with the new discovery rules has drastically increased the
amount of time prosecutors must devote to menial “paper-chasing” tasks. This
has led to widespread reports of what one New York district attorney called “a
marked increase in attrition” among staff.
36
THE NEXT NEW YORK
22
Leniency for parolees
The “Less Is More: Community Supervision Revocation Reform Act,” signed
by Governor Hochul in September 2021, was a response to claims that minor
“technical” violations of parole conditions were fueling “mass incarceration”
37
in
New York. Specifically, that (1) when parolees commit a minor infraction of the
conditions of their paroles—such as missing an appointment with a parole officer
or failing a drug test—they are too often reincarcerated; and (2) those incarcera-
tions are costly, unnecessary for public safety, and racially inequitable.
Evidence from other jurisdictions, including the federal system,
38
suggests why
policymakers should have been more skeptical of such claims by illustrating that
many violators who had their releases revoked (i.e., who were sent back to prison)
had, in fact, racked up multiple “technical” infractions prior to revocation, were
charged with new crimes that triggered the enforcement of a violation, or chose
incarceration over an alternative such as drug treatment.
39
Without seeking to carefully document advocates’ claims, state lawmakers
heeded calls for drastic changes to how parole conditions are enforced in New
York.
40
The Less Is More Act made three particularly dramatic revisions to prior
law. First, it drastically limited the availability of reincarceration as a sanction for
“technical” violations. Second, it limited the state’s ability to detain even those
accused of both “technical” and criminal violations to only those cases in which
(in the case of “technical” violators) the violators abscond or (in the case of crim-
inal violators) are found by a judge to pose a risk of absconding—in essence,
incorporating the same “least restrictive means” standard featured in bail law
changes. Third, the Act raised the bar the state must clear to revoke a convicted
criminal’s parole.
41
More risk
As with the state’s bail reform, Less Is More risks the public’s safety by increas-
ing the population of offenders likely to commit new crimes on the street. This
risk is illustrated by national data presented in a Bureau of Justice Statistics study
of violent felons convicted in America’s 75 largest counties between 1990-2002,
which found that eight percent of the felons captured by the analysis were out on
parole at the time of the violent felony offenses for which they were convicted.
42
In New York City, a 2011 analysis by the Center for Court Innovation found that
53 percent of parolees were rearrested at least once over a three-year period, and
42 percent were reconvicted.
43
Further illustrating the public safety risk posed by this measure, data high-
lighted in a Manhattan Institute report show that parolees are more likely than
defendants not on parole to be rearrested following a release without bail.
44
The
same data also show that parolees were 1.7 times as likely as non-parolees to be
rearrested for a violent felony.
The extent of the added risk created by Less Is More is highlighted by state
data showing that, between September 2021 and October 2022, the number of
technical parole violators in New York State jails on any given day decreased by
more than 70 percent, or 500 parolees.
45
Renewing and Reforming the Empire State
23
Other challenges
While the changes to bail, discovery, and parole enforcement laws may have
had the greatest impact on public safety, they are by no means the only “reforms”
to have recently and systematically lowered the transaction costs of criminal con-
duct while raising the transaction costs of law enforcement.
The state “Raise The Age” law, passed in 2017, made it more difficult to charge
certain teenage criminal offenders as adults, thereby making it less likely that even
the most serious violent crimes will lead to lengthy terms of incarceration when
committed by 16 and 17 year-olds. A recent study done by the New York City
Criminal Justice Agency found significantly higher rates of rearrest for teenagers
eligible for youthful offender treatment under the new law, compared to similarly
situated defendants prior to the law going into effect
.
46
In 2009, the state revamped the so-called Rockefeller Drug Laws, lowering
penalties for certain drug offenses and sharply increasing the rate of diversion for
eligible defendants
.
47
And in 2020, Governor Cuomo signed into law a package of 10 bills affecting
police practices, tactics, and conduct. Among other things, the package gave the
state Attorney General the ability to prosecute officers in certain cases involving
fatal uses of force, publicized police disciplinary records (including unsubstanti-
ated allegations), and made the application of “chokeholds” by police a felony
offense, punishable by up to 15 years in prison
.
48
But changes to state law don’t tell the whole story, given that many cities within
the state have enacted reforms of their own.
In New York City, there was a sharp curtailment of the police tactic known as
“stop, question, and frisk,” which research had linked to reduced offending in the
city’s pockets of concentrated crime.
49
The City Council passed legislation mandating the ultimate closing of its jails
on Rikers Island, as well as the creation of a new borough-based jail system with
a maximum capacity of 3,300—40 percent below the already reduced average
daily population in New York City jails in 2021.
50
The Council has also approved a host of other local laws affecting police ac-
tivity, including the Right to Know Act
51
(requiring officers to affirmatively ap-
prise those they contact of their right to refuse consent to a search), a workaround
to the legal defense of qualified immunity for police officers,
52
and the so-called
“diaphragm bill,” criminalizing the placement of pressure on the diaphragm, neck,
back, or chest of a suspect being arrested by police
.
53
Coupled with the election of progressive prosecutors in Manhattan
54
and
Brooklyn
55
who have explicitly oriented their office’s policies toward decarcera-
tion, all of the reforms discussed above have either favored those who have com-
mitted or been accused of crimes or have disfavored those charged with enforcing
the law.
THE NEXT NEW YORK
24
MOVING FORWARD
Reestablishing order and safety on New York State streets will require decisive
action on the following urgent priorities:
• Make public safety the central concern of pretrial release decisions.
56
This effort must begin by explicitly authorizing judges to remand defend-
ants to pretrial detention on the basis of the risks those defendants pose to
the public. Such determinations can and should be aided by a validated, al-
gorithmic risk-assessment tool of the sort already in use in New York City
to determine risk of flight. Next, judges should be given the discretion to
revoke the releases and amend the release conditions of defendants rear-
rested while on pretrial release. This could be buttressed by the creation of
a rebuttable presumption of pretrial detention for defendants with a history
of reoffending while on pretrial release, as well as those accused of certain
offenses. Finally, because the bail debate is largely a function of how long
defendants stand to spend in pretrial detention, and the potential length of
detention for those remanded pretrial is almost entirely a function of re-
sources available to prosecutors, consideration should be given to a large-
scale funding effort aimed explicitly at facilitating the more-speedy disposi-
tion of criminal cases in New York State.
• Restore balance in criminal prosecutions. District attorneys agree the
new discovery rules for criminal cases went too far.
57
Among the more gen-
eral changes that should be considered are:
o limiting the materials that must be acquired and turned over prior to
the setting of a trial date, while maintaining a requirement for the im-
mediate disclosure of any exculpatory evidence the state has knowledge
or possession of;
o lifting or loosening the limits on plea bargaining prior to full compli-
ance with current disclosure rules;
o funding the hiring of more administrative staff to assist with compli-
ance with discovery rules; and
o expanding the timeframe for compliance.
• Mitigate the unintended, if predictable, consequences of “Less Is
More.”
58
As in the case of pretrial release decisions, judges in New York
must be given the discretion to remand to detention any parolee accused of
a violation found to pose a threat to public safety. A reform effort should
focus on re-examining the evidentiary burdens with respect to parole viola-
tions and subsequent revocations, minimizing the trauma for victims of pa-
rolees charged with committing new crimes, and fortifying the ability of
corrections officials to properly enforce parole violations.

Renewing and Reforming the Empire State
25
In addition to these proposals aimed at specifically addressing the heightened
risks created by changes to criminal procedure laws since 2019, the following gen-
eral steps would help fortify New York against resurgent crime:
• Adopt a determinant sentencing regime for cases involving repeat offenders
minimum sentences as felony prosecutions that lead to convictions mount;
• Revise the state’s “Raise The Age” law to restore a presumption of prosecu-
tion as an adult in criminal court in cases involving 16 and 17-year-old of-
fenders charged with certain gun-related and violent offenses, or with con-
duct engaged in as part of a criminal enterprise (i.e., gang); and
• Fund additional police hires and training programs with an eye toward at-
tracting and retaining more highly educated recruits.
ENDNOTES
1
David Weisburd & Taryn Zastrow, Crime Hot Spots: A Study of New York City Streets in 2010,
2015, and 2020, MANHATTAN INSTITUTE (August, 2018), available at: https://www.manhattan-insti-
tute.org/weisburd-zastrow-crime-hot-spots.
2
See, e.g., Crime and Enforcement Activity Reports (2008-2021), NEW YORK CITY POLICE DEPARTMENT,
available at: https://www1.nyc.gov/site/nypd/stats/reports-analysis/crime-enf.page (showing that a
minimum of 95 percent of shooting victims in NYC are either black or Hispanic).
3
See, e.g., Death Wish, directed by Michael Winner (1974) and The Warriors, directed by Walter Hill
(1979).
4
Jonathan Mahler, Ladies and Gentlemen, the Bronx Is Burning: 1977, Baseball, Politics, and the Bat-
tle for the Soul of a City, MACMILLAN (2006).
5
Emily Vasquez, New York Is Safest Big City, F.B.I. Report Shows, NEW YORK TIMES (Sep. 19, 2006),
available at: https://www.nytimes.com/2006/09/19/nyregion/new-york-is-safest-big-city-fbi-report-
shows.html.
6
George L. Kelling and James Q. Wilson, Broken Windows: The police and neighborhood safety, THE
ATLANTIC (March 1982), available at: https://www.theatlantic.com/magazine/archive/1982/03/bro-
ken-windows/304465/.
7
See, George L. Kelling, Community Policing, Rightly Understood, CITY JOURNAL (Winter 2019), avail-
able at: https://www.city-journal.org/community-policing; and George L. Kelling and William J. Brat-
ton, Taking Back the Streets, City Journal (Summer 1994), available at: https://www.city-jour-
nal.org/html/taking-back-streets-12586.html.
8
A performance management system that centered detailed data regarding crime, thereby facilitating:
effective deployment strategies; evaluation of tactics and strategies; and mission-based accountability
for, and oversight of, commanders. See also, Bureau of Justice Assistance and Police Executive Re-
search Forum, COMPSTAT: Its Origins, Evolution, and Future in Law Enforcement Agencies (2013),
available at: https://bja.ojp.gov/sites/g/files/xyckuh186/files/Publications/PERF-Compstat.pdf.
9
Nationally, the U.S. Dep’t of Justice’s Office of the Inspector General projected in a detailed analysis
that the 1994 Crime Bill would put nearly 60,000 additional officers on American streets. See, Michael
R. Bromwich, Management and Administration of the Community Oriented Policing Services Grant Pro-
gram, OFFICE OF THE INSPECTOR GENERAL, AUDIT DIVISION (July 1999), available at: https://oig.jus-
tice.gov/reports/COPS/a9921/index.htm. New York City was among the four largest recipients of
funds under the relevant provisions of the Bill. See, Ralph Rector and David Muhlhausen, The Facts
about COPS: A Performance Overview of the Community Oriented Policing Services Program, HERIT-
AGE FOUNDATION (September, 2000), available at: https://www.heritage.org/crime-and-justice/re-
port/the-facts-about-cops-performance-overview-the-community-oriented-policing.
10
David Weisburd, et al., Do Stop, Question, and Frisk Practices Deter Crime?: Evidence at Microunits
of Space and Time, CRIMINOLOGY & PUBLIC POLICY (November, 2015), available at: https://onlineli-
brary.wiley.com/doi/abs/10.1111/1745-9133.12172.

THE NEXT NEW YORK
26
11
John MacDonald, Jeffrey Fagan, and Amanda Geller, The Effects of Local Police Surges on Crime
and Arrests in New York City, PLOS ONE (June, 2016), available at: https://jour-
nals.plos.org/plosone/article?id=10.1371/journal.pone.0157223.
12
Timothy Williams and Monica Davey, U.S. Murders Surged in 2015, F.B.I. Finds, NEW YORK TIMES
(Sep. 26, 2016), available at: https://www.nytimes.com/2016/09/27/us/murder-crime-fbi.html.
13
David Shortell and Daniella Diaz, US homicide rate spiked nearly 8% in 2016, FBI report finds,
CNN (Sep. 25, 2017), available at: https://www.cnn.com/2017/09/25/politics/fbi-crime-report-
2016-homicide-rate.
14
Crime in New York State: 2017 Final Data, NEW YORK STATE DIVISION OF CRIMINAL JUSTICE SERVICES
(September 2018), available at: https://www.criminaljustice.ny.gov/crimnet/ojsa/Crime-in-NYS-2017-
9-24-18.pdf.
15
Id.
16
Aaron Chalfin, Michael LaForest, and Jacob Kaplan, Can Precision Policing Reduce Gun Violence?
Evidence from "Gang Takedowns" in New York City, JOURNAL OF POLICY ANALYSIS AND MANAGEMENT
(July 2021), available at: https://onlinelibrary.wiley.com/doi/10.1002/pam.22323.
17
Crime in New York State: 2020 Final Data, NEW YORK STATE DIVISION OF CRIMINAL JUSTICE SERVICES
(December 2021), available at: https://www.criminaljustice.ny.gov/crimnet/ojsa/Crime-in-NYS-
2020.pdf.
18
Buffalo Police Department, Part I Crimes by Year (2008 - Present), CITISTAT BUFFALO, available at:
https://data.buffalony.gov/stories/s/CitiStat-Buffalo-Buffalo-Police-Department/hugq-2uun/.
19
Chris Libonati, Murder spike in Upstate New York cities in 2020 outpaced nation's increase, FBI data
shows, SYRACUSE.COM (Sep. 29, 2021), available at: https://www.syracuse.com/crime/2021/09/mur-
der-spike-in-upstate-new-york-cities-in-2020-outpaced-nations-increase-fbi-data-shows.html.
20
Anne Hayes, 2021 one of Syracuse's worst years for homicide deaths: 32 dead, SYRACUSE.COM
(Dec. 23, 2021), available at: https://www.syracuse.com/crime/2021/12/32-dead-2021-becomes-
syracuses-worst-year-for-homicide-deaths.html.
21
See Libonati supra note 25.
22
John Sheridan, Crime down in Albany in 2020 overall, with violent crime rising, NEWS 10 (Dec. 31,
2020), available at: https://www.news10.com/news/albany-county/crime-down-in-albany-in-2020-
overall-with-violent-crime-rising/.
23
Ann Carson, Melissa Nadel, and Gerry Gaes, Impact of COVID-19 on State and Federal Prisons,
March 2020-February 2021, BUREAU OF JUSTICE STATISTICS (August 2022), available at:
https://bjs.ojp.gov/content/pub/pdf/icsfp2021.pdf (showing that New York’s prison population de-
clined by 26 percent between February 29, 2020 and February 28, 2021).
24
Browder served three years at Rikers Island, two in solitary confinement, after being charged but
never convicted of robbery as a 16-year-old in 2010. He committed suicide in 2015.
25
For background on the Browder case and the role it played in driving support for bail reform in New
York, see Jesse McKinley and Ashley Southall, Kalief Browder’s Suicide Inspired a Push to End Cash
Bail. Now Lawmakers Have a Deal, NEW YORK TIMES (Mar. 29, 2019), available at: https://www.ny-
times.com/2019/03/29/nyregion/kalief-browder-cash-bail-reform.html.
26
Part 2, Title J of Chapter 11-A of the Consolidated Laws of New York, available at:
https://www.nysenate.gov/legislation/laws/CPL/A245.
27
Michael Rempel and Krystal Rodriguez, Bail Reform in New York: Legislative Provisions and Implica-
tions for New York City, CENTER FOR COURT INNOVATION (April 2019), available at:
https://www.courtinnovation.org/sites/default/files/media/document/2019/Bail_Re-
form_NY_full_0.pdf.
28
Rafael Mangual, Reforming New York's Bail Reform: A Public Safety-Minded Proposal, MANHATTAN
INSTITUTE FOR POLICY RESEARCH (March 2020), available at: https://media4.manhattan-insti-
tute.org/sites/default/files/reforming-ny-bail-reformRM.pdf.
29
Chelsia Rose Marcius, Troy Closson, and Grace Ashford, New York’s Bail Laws Are Changing
Again. Here’s How., New York Times (Apr. 11, 2022), available at: https://www.ny-
times.com/2022/04/11/nyregion/new-york-bail-laws.html.
30
See, How many people with open criminal cases are re-arrested?, NEW YORK CITY MAYOR'S OFFICE
OF CRIMINAL JUSTICE (December 2021), available at: http://criminaljustice.cityofnewyork.us/wp-con-
tent/uploads/2021/12/Pretrial-Docketed-Rearrest-Contextual-Overview-December-2021-Update.pdf.
31
For an overview of that research, see Chae Mamayek, Ray Paternoster, and Thomas A. Loughran,
Temporal Discounting, Present Orientation, and Criminal Deterrence, THE OXFORD HANDBOOK OF OF-
FENDER DECISION MAKING, ed. Wim Bernasco, Jean-Louis van Gelder, and Henk Elffers (New York: Ox-
ford University Press, 2017) (noting at p. 223 that “[T]he clerity principle concludes that there is higher
deterrent value in more immediate punishments,” and “punishments delivered further into the future will

Renewing and Reforming the Empire State
27
be decreased in value,” which supports “increas[ing] the immediacy of sanctions in order to increase
the cost associated with crime.”).
32
Joshua Solomon, GOP questions state's bail data; updated data show 2% of bail offenses led to re-
arrests on violent felonies, TIMES UNION (Jan. 11, 2022), available at: https://www.timesun-
ion.com/state/article/GOP-calls-into-question-state-s-actions-on-bail-16768206.php.
33
Greg B. Smith and Suhail Bhat, Four in 10 Bail Reform Release Program Participants Rearrested,
State Stats Show, THE CITY (Jan. 11, 2022), available at: https://www.the-
city.nyc/2022/1/9/22875181/bail-reform-release-program-participants-rearrested.
34
Part LLL of Chapter 59 of the Laws of 2019. For an overview of the reform’s provisions, see: Krystal
Rodriguez, Discovery Reform in New York: Major Legislative Provisions (Updated after April 2022
Amendments), DATA COLLABORATIVE FOR JUSTICE AT JOHN JAY COLLEGE (May 2022), avaiable at:
https://www.courtinnovation.org/sites/default/files/media/document/2022/Discovery_NY_Re-
vised_0622_2.pdf.
35
Amber Kempermann, Letting the Cat Out of the Bag: How New York's Discovery Reform Removes
the Secrecy From the Grand Jury, SCHOLARLY COMMONS AT HOFSTRA LAW (Spring 2020), available at:
https://scholarlycommons.law.hofstra.edu/cgi/viewcontent.cgi?article=1015&context=hofstra_law_stu-
dent_works.
36
See, Tamar Lapin, Joe Marino, and Jorge Fitz-Gibbon, NY’s ‘speedy trial’ reforms are costing DAs
cases and staffers, NEW YORK POST (Mar. 22, 2022), available at: https://ny-
post.com/2022/03/22/nys-speedy-trial-reforms-are-costing-das-cases-and-staffers/.
37
Probation and Parole Driving Mass Incarceration, EQUAL JUSTICE INITIATIVE (Nov. 25, 2020), availa-
ble at: https://eji.org/news/probation-and-parole-driving-mass-incarceration/.
38
See, Janette Sheil, Medha Patel, and David Cook, Federal Supervised Release Revocation for Drug
Use: The Rest of the Story, FEDERAL PROBATION, VOL. 83 NO. 1, OFFICE OF THE U.S. COURTS (December
2018), available at: https://www.uscourts.gov/sites/default/files/83_1_3_0.pdf.
39
For example, an analysis of technical probation violators in Tarrant County, Texas, (including the
Fort Worth metro area) found that offenders under supervision averaged just under three technical vio-
lations per month over 22 months prior to revocation; that 18 percent of offenders “were actually ar-
rested for a new offense while under supervision, but for various reasons were not coded as such in the
computerized case management system”; and that “close to 20 percent of offenders opted to ‘take
their time’ when offered treatment or other alternatives to incarceration when facing revocation.” See,
Kelli Stevens-Martin, Olusegun Oyewole, and Cynthia Hipolito, Technical Revocations of Probation in
One Jurisdiction: Uncovering the Hidden Realities, FEDERAL PROBATION VOL. 78 NO. 3, OFFICE OF U.S.
COURTS (December 2014), available at: https://www.uscourts.gov/sites/default/files/78_3_3_0.pdf.
40
Prominent supporters included the New York State Bar Association, the Columbia University Justice
Lab, and the editorial page of The New York Times. See, e.g., Initial Report of the New York State Bar
Association Task Force on the Parole System, NEW YORK STATE BAR ASSOCIATION (November 2019),
available at: https://nysba.org/NYSBA/Advocacy %20and %20Leadership/House %20of %20Dele-
gates/November %202019/NYSBA %20Task %20Force %20on %20the %20Parole %20System
%20Final %20Report.pdf; The Enormous Cost of Parole Violations in New York, COLUMBIA UNIVERSITY
JUSTICE LAB (March 2021), available at: https://justicelab.columbia.edu/sites/default/files/con-
tent/Cost_Parole_Violations_in_New_York.pdf?nocache=1; and The Editorial Board, The Endless Ca-
tastrophe of Rikers Island, NEW YORK TIMES (Sep. 15, 2021), available at: https://www.ny-
times.com/2021/09/15/opinion/rikers-island-de-blasio-close.html.
41
For a detailed overview of Less Is More and its potential impact on public safety in New York, see
Charles F. Lehman & Elias Neibart, Is Less Always More?: The Unintended Consequences of New York
State’s Parole Reform, Manhattan Institute for Policy Research (October 2022), available at:
https://www.manhattan-institute.org/unintended-consequences-of-new-york-states-parole-reform.
42
Brian A. Reaves, Violent Felons in Large Urban Counties, BUREAU OF JUSTICE STATISTICS (July 2006),
available at: https://bjs.ojp.gov/content/pub/pdf/vfluc.pdf.
43
Bryn A. Herrschaft and Zachary Hamilton, Recidivism Among Parolees in New York City, 2001-
2008, CENTER FOR COURT INNOVATION (November 2011), available at: https://www.courtinnova-
tion.org/sites/default/files/documents/Recidivism_Parolees_NYC.pdf.
44
See Lehman and Neibart, supra note 47.
45
Monthly Jail Population Trends, NEW YORK CITY MAYOR'S OFFICE OF CRIMINAL JUSTICE, available at:
https://www.criminaljustice.ny.gov/crimnet/ojsa/jail_population.pdf.
46
Marian Gewirtz, Re-Arrest Among 16 Year Olds Arrested In The First Year Of Raise The Age, NEW
YORK CITY CRIMINAL JUSTICE AGENCY (December 2021), available at: https://www.nycja.org/publica-
tions/re-arrest-among-16-year-olds-arrested-in-the-first-year-of-raise-the-age.

THE NEXT NEW YORK
28
47
Press Release: Vera Institute of Justice Study Examines the Impact of The Rockefeller Drug Law Re-
forms in New York City, VERA INSTITUTE OF JUSTICE (Jan. 20, 2015), available at:
https://www.vera.org/newsroom/vera-institute-of-justice-study-examines-the-impact-of-the-rockefeller-
drug-law-reforms-in-new-york-city.
48
Alexa Lardieri, Gov. Andrew Cuomo Signs 10-Bill Police Reform Package into Law, U.S. NEWS &
WORLD REPORT (Jun. 12, 2020), available at: https://www.usnews.com/news/politics/articles/2020-
06-12/new-york-gov-andrew-cuomo-signs-10-bill-police-reform-package-into-law.
49
See, Weisburd, et al., supra note 10.
50
Matthew Haag, N.Y.C. Votes to Close Rikers. Now Comes the Hard Part., NEW YORK TIMES (Oct.
17, 2019), available at: https://www.nytimes.com/2019/10/17/nyregion/rikers-island-closing-
vote.html.
51
Rafael A. Mangual, Wrong-footing the NYPD, CITY JOURNAL (Dec. 22, 2017), available at:
https://www.city-journal.org/html/wrong-footing-nypd-15617.html.
52
Press Release: Council Votes To End Qualified Immunity and Seven Other Measures to Reform
NYPD, NEW YORK CITY COUNCIL (Mar. 25, 2021), available at: https://coun-
cil.nyc.gov/press/2021/03/25/2079/.
53
New York City Local Law No. 2020/066, available at: https://legistar.council.nyc.gov/Legisla-
tionDetail.aspx?ID=3343958&GUID=B782804F-680A-4156-9E64-8BF88CF7BBD8.
54
Rafael A. Mangual, Nothing to Bragg About, CITY JOURNAL (Jan. 7, 2022), available at:
https://www.city-journal.org/manhattans-new-anti-prosecution-district-attorney-alvin-bragg.
55
Rafael A. Mangual, "Justice" for Whom?, CITY JOURNAL (Mar. 20, 2019), available at:
https://www.city-journal.org/eric-gonzalez-justice-2020-initiative.
56
For more detailed recommendations regarding pretrial justice in New York, see Mangual, supra
note 34; and Jim Quinn, More Criminals, More Crime: Measuring the Public Safety Impact of New
York's 2019 Bail Law, MANHATTAN INSTITUTE FOR POLICY RESEARCH (July 2022), available at:
https://www.manhattan-institute.org/measuring-the-public-safety-impact-of-new-yorks-2019-bail-law.
57
“Why We Need to Reform New York’s Criminal Justice Reforms,” Darcel D. Clark, Eric Gonza-
lez, Melinda Katz, Michael E. McMahon, Anthony A. Scarpino Jr., Madeline Singas and Cyrus R.
Vance Jr., New York Times, Feb. 25, 2020.
58
For more detailed recommendations regarding how to reform parole violation enforcement rules,
see Lehman and Neibart, supra note 47.
3.
Rethinking K-12 Education
—and Beyond
By Ray Domanico
New York State’s system of public elementary and secondary schools is in
steep decline, but it is salvageable. The roots of its problems pre-date the onset
of the coronavirus pandemic in early 2020, but the system’s response to that chal-
lenge accelerated discontent with the schools and harmed students. The damage
of those years will not be undone if the state blindly continues to throw money at
schools — unless there is a fundamental re-thinking of the purpose and govern-
ance of public education.
New York consistently leads the nation in K-12 school spending, yet by 50-
state standards, student outcomes are mired in the middle. An $11 billion (55
percent) increase in annual state education aid over the last 10 years has failed to
move the needle on student achievement. Meanwhile, during the same period,
enrollment in the state’s public-school districts has decreased by over 300,000
students, or 11.7 percent. (See Organization of Education in New York State below.)
If higher spending automatically led to higher quality, New York would be a
model for the nation. Unfortunately, this model has demonstrably failed, and it
is time for state leaders to fundamentally rethink their approach to education.
THE STATUS QUO
According to the latest U.S. Census data, New York’s K-12 public school
spending for 2019-20 came to $25,519 per pupil—89 percent more than the 50-
state (plus D.C.) average of $13,494. New York State also continues to consider-
ably outspend neighboring northeastern states: 23 percent more than New Jersey,
20 percent more than Connecticut and 36 percent more than Massachusetts. As
reported by the Empire Center, even New York’s poorest, least well-funded dis-
tricts spend more per pupil than the national average.
1
The education spending gap between New York and the national average has
roughly doubled over the past 20 years, as illustrated by Figure 1 below. Note-
worthy school spending benchmarks from the annual census data include:
o New York’s spending on instructional salaries and benefits (commonly
considered “money in the classroom”) was $17,813 per pupil—more than
double the national average of $8,176 and exceeding the total per-pupil
school spending in all but six other states and the District of Columbia.
o In the category of “support services,” which measures the bureaucratic
overhead of central district and school building administration, New

THE NEXT NEW YORK
30
York ranked sixth with spending of $7,213 per pupil. That was 50 percent
above the national average—unsurprising, given New York’s relatively
large number of (roughly 700) independently administered local districts.
However, if New York had spent the national average in the support cat-
egory, it still would have ranked first in overall per-pupil spending among
states.
o New York City’s spending of $28,828 per pupil was by far the highest
among the nation’s 100 largest school systems.
Based on the state Education Department’s own detailed database, which
measures spending by somewhat different standards than the Census Bureau, a
categorical breakdown of school finance trends over the past 20 years is presented
in Table 1. Key trends emerging from state data for 1994-95 to 2019-20:
o Total public-school expenditures across the period more than tripled,
from just under $25 billion to more than $75 billion.
o Fringe benefits, including teacher pension fund contributions and health
insurance, were the fastest rising component of compensation—more
than quadrupling from $4.2 billion to nearly $17 billion, while salaries
rose at a still-healthy pace of 175 percent.
o Debt service also increased significantly, reflecting extensive state-subsi-
dized capital investment in new and renovated school buildings.
All of the data, whether state or federal, point to the same conclusion: as out-
come measures confirm, New Yorkers are not getting educational results com-
mensurate with their significantly higher spending on schools.

Renewing and Reforming the Empire State
31
Steps forward and backward
Elementary and secondary education policy trends in New York over the past
quarter-century have mixed effective, forward-looking reforms with some degra-
dation of standards in the established system. On the reform side of the ledger,
the outstanding educational policy achievement was the 1998 law
2
making New
York the 34
th
state to expand its definition of “public schools” to include inde-
pendently operated charter schools. The opening section of the charter school
law set forth its purposes in clear, compelling terms:
(a) Improve student learning and achievement;
(b) Increase learning opportunities for all students, with special emphasis on ex-
panded learning experiences for students who are at-risk of academic failure;
(c) Encourage the use of different and innovative teaching methods;
(d) Create new professional opportunities for teachers, school administrators and
other school personnel;
(e) Provide parents and students with expanded choices in the types of educational
opportunities that are available within the public school system; and
(f) Provide schools with a method to change from rule-based to performance-based
accountability systems by holding the schools established under this article accounta-
ble for meeting measurable student achievement results.
3
1994-95 1999-00 2004-05 2009-10 2014-15 2019-20
Growth '95-
'20
Teacher Salaries 9,791 12,326 15,474 19,062 19,548 21,838 123%
Pupil Personnel Services salaries 486 494 587 700 748 919 89%
Curriculum Development & Supervision 614 809 1,053 1,146 1,158 1,731 182%
BOCES Instructional Services 970 1,325 1,655 2,142 2,295 2,776 186%
Other Instructional Salaries 1,779 2,325 2,524 3,334 3,558 4,910 176%
Other Instructional Expenditures 1,041 1,905 2,843 3,847 5,137 8,256 693%
Community Service 49 55 67 104 95 120 145%
sub-total Instruction 14,730 19,239 24,203 30,335 32,539 40,550 175%
Board of Education 90 115 144 182 193 208 132%
Central Administration 478 570 749 896 895 1,223 156%
sub-total Board and Central 568 686 893 1,078 1,088 1,431 152%
Teacher Retirement 1,005 360 1,753 3,179 5,387 4,709 369%
Health Benefits 1,495 1,985 3,440 4,888 5,943 7,519 403%
Other Fringe Benefits 1,709 2,081 3,104 3,777 4,208 4,683 174%
sub-total Fringe 4,208 4,427 8,298 11,844 15,538 16,912 302%
Tuition Paid to Other School Districts 205 270 402 526 292 334 63%
Tuition, All Other 421 396 768 1,055 1,535 1,482 252%
Other (Including CharterSchools) 363 599 651 927 928 1,056 191%
sub-total Tuition 989 1,266 1,821 2,509 2,755 2,872 190%
Operations and Maintenance 1,862 2,348 2,923 3,511 3,738 4,531 143%
Transportation 1,261 1,573 2,126 2,785 3,018 3,209 154%
sub-total Operations and Transportation 3,123 3,922 5,048 6,297 6,756 7,740 148%
Debt Service Principal 580 818 1,355 1,931 2,405 3,631 526%
Debt Service Interest 536 854 1,021 1,241 1,061 1,809 237%
sub-total Debt Service 1,116 1,673 2,376 3,172 3,466 5,440 387%
Other (Includes Intra-fund Transfers) 123 384 187 321 474 721 486%
Total Expenditures 24,857$ 31,594$ 42,826$ 55,555$ 62,616$ 75,665$ 204%
Table 1. Education Expenditures by Category, 1994-95 to 2019-2020
Source: New York State Education Department Fiscal Profiles
(millions of dollars)
THE NEXT NEW YORK
32
Simply adapting the law to New York’s established educational governance
structure in 1998 would have left the issuance and regulation of charters to the
Board of Regents (which is selected entirely by the Legislature) and to local school
boards, which would have had strong political and financial incentives to mini-
mize the competition. Crucially, however, the law’s designated charter-authoriz-
ing entities also included the State University of New York (SUNY), which is
controlled by appointees of the governor—who, from 1998 through 2006, was
the chief proponent of charter schools, George Pataki.
As of August 2022, according to data posted with the state Education Depart-
ment ‘s Charter School Directory,
4
there were 360 charter schools serving more
than 150,000 students in New York State, the majority (287, serving 142,500 stu-
dents) in New York City, and the rest mainly in other large cities and older inner
suburbs. More than 60 percent of charter schools were authorized by SUNY.
Charter schools are financed through the state’s funding formula, which sets char-
ter tuition by dividing district’s Approved Operating Expenditures by Total Al-
lowable Pupil Units. By any standard, charters spend less per-pupil than standard
public schools.
As detailed below, charter schools have produced better outcomes than tradi-
tional public schools. Parental demand for more charters has remained high, es-
pecially in New York City, where charter enrollment expanded during the pan-
demic even as enrollment in the main public system was declining. As of 2020-
21, the waiting list for charter school seats in New York City was estimated at
50,000. However, the total number of charters in the city has reached its maxi-
mum limit allowable by state law. Proposals to raise the cap have been strongly
opposed by the United Federation of Teachers (UFT) and allied groups, which
have backed proposed legislation that would make the Board of Regents the sole
charter authorizer.
Mayoral control
A few years after passage of the charter school law, another major positive
education reform came in New York City. Through 2001, the city’s vast central-
ized school system—by far the largest in the country—had been run by an inde-
pendently elected Board of Education, which appointed the system’s chancellor.
In 2002, the state Legislature changed the law to shift control of the system to the
city’s mayor—then Michael Bloomberg, who had made the change one of his top
priorities upon taking office that year.
The results were dramatic. Achievement on state tests improved in the city
from 2002 through 2019, the last pre-COVID year of testing, pushing the city’s
levels above the state average for the first time in memory.
The city’s high-school graduation rate, which had been stuck at 50 percent
since the early 1980s, rose dramatically during Mayor Michael Bloomberg’s tenure
(2002-13) years and kept rising under Mayor Bill de Blasio, reaching 77 percent
by 2019.
For the first 12 years of mayoral control, Mayor Bloomberg and his schools
chancellors, Joel Klein and Dennis Walcott, engineered a complete overhaul of
the city’s public high schools. They streamlined the central bureaucracy, largely
Renewing and Reforming the Empire State
33
eliminated the power of the many corrupt local school boards and ushered in a
well-functioning system based on local control, innovation and accountability.
Those changes would have been impossible under the old Board of Education,
where powerful interest groups controlled the purse, and parents and students
had no voice.
Bloomberg’s team took the extraordinary step of closing many schools for low
performance, replacing them with both teacher/community-designed district
schools and public charter schools. Overall, Bloomberg’s team did much to in-
crease the supply of good schools in all communities in the city, offering city
parents extensive choice within the district and charter school sectors.
The high-water mark of choice-focused education reform efforts in New York
came in 2014, when then-Governor Cuomo initially endorsed and promised to
push for passage of a bill establishing state tax credits for contributions to private
school scholarship funds, as well as “public education entities.”
5
Over a three-year
phase-in period, the credits would have totaled $300 million annually and were
projected to incentivize another $333 million in contributions to eligible educa-
tion and scholarship funds. Those were and are exceedingly modest amounts by
New York public education standards, but potentially represented enough fund-
ing to significantly boost the ability of non-public schools to offer educational
choice to families of modest means.
Despite including public school support funds among eligible recipients, the
tax credit proposal was strongly opposed by teachers’ unions and allied interest
groups. When then-Assembly Speaker Sheldon Silver threatened to hold up a FY
2015 budget deal rather than pass the tax credits, Governor Cuomo backed away
from his support for the proposal, which has gone nowhere since.
Retrograde reset for New York City
Twenty years after the historic shift to mayoral control of the New York City
schools, the Legislature moved to undermine that reform in two crucial respects.
In Spring 2022, the State Legislature unwisely chose to tinker with Mayoral Con-
trol of New York City’s schools, despite the success that had occurred in the
system since 2002.
Faced with some constituents wary of mayoral control, lawmakers have created
a mishmash that will bring only paralysis to a system that badly needs strong lead-
ership. Fortunately, their destructive changes were delayed by a year, giving the
Governor and Legislature time to reconsider and rescind or amend the changes.
If the legislative program goes forward, Mayor Adams and Chancellor Banks will
have to deal with a 23-member Panel for Educational Policy, even as they keep
their eyes on the Legislature itself, from which they will need to secure an exten-
sion of mayoral control by 2024.
Moreover, the Legislature places an elected official, the city comptroller, on
the panel as a nonvoting member. The comptroller has a large staff and incum-
bent Brad Lander may be inclined to organize opposition to mayoral initiatives.
Yet Adams was elected by the people to control the school system; Lander wasn’t.
Finally, the Legislature recently mandated lower class sizes in New York City
over the next five years. If this policy is enforced, it will prove incredibly expensive
THE NEXT NEW YORK
34
and needlessly hamstring school administration when flexibility is crucial, partic-
ularly at a time when the city is losing enrollment across the board and dramati-
cally in some individual schools.
Assessing educational outcomes
As the reform momentum of the 1990s and 2000s faded in New York, decline
has more commonly been the theme of major trends in the state’s traditional pub-
lic school system. While the state has been leading the nation in spending, overall
achievement levels New York students have remained mired at the national aver-
age for the past 20 years. This is true for the state’s students as a whole and for
those from lower-income families, whose needs are often used as the rationale for
greater spending.
Because the state has made changes to its English Language Arts (ELA) and
mathematics tests, effectively moving the goalposts on any attempt to compare
trends over time, the most consistent measure of pupil performance over the past
20 years has been scores on the National Assessment of Education Progress
(NAEP) tests, which are administered every other year in every state to repre-
sentative samples of students in grades 4 and 8.
6
As shown in the Exhibit charts
below, the NAEP results in a national context don’t come close to aligning with
New York’s much higher spending. The NAEP results point to the inescapable
conclusion that higher spending on education in New York State has not moved
the needle on overall student achievement. But this cannot be blamed on COVID
lockdowns; it was as true in 2019 as in 2022.
The story is about the same when NAEP score comparisons are limited to
students from lower-income families. In grade 4 reading, the 2022 performance
of low-income students in New York was statistically the same as in 2002, no
different from the national average. On each test between 2002 and 2013, New
York’s poorer students in grade 4 did better than the national average for poor
students nationwide—but that has not been true in recent years. The same is true
for the grade 8 reading test, with New York’s lower income children scoring
above their peers nationally between 2005 and 2011, but then losing that ad-
vantage in more recent tests.
In grade 4 mathematics, New York’s low-income students scored below their
peers nationally in 2019 and 2022, after scoring above average from 2003 to 2009,
and at the national average in all other years. In grade 8 mathematics, New York’s
low-income students matched the national average for peers in each of the last
three years, after scoring above the average for their peers in 2003-2009 and 2015.
The charter school outcome edge
As shown in Figure 2, however, a bright spot on the achievement landscape in
New York has been the performance of charter schools. On the most recent ad-
ministration of the state’s annual exams in grades 3 through 8 in English Language
Arts, students in charter schools outperform those in district-run schools by about
12 percentage points.

Renewing and Reforming the Empire State
35
Exhibit: Average NAEP Scores, New York vs. National
o In grade 4 Reading, New York’s average score in 2019 was statistically unchanged
from 2002, indicating no improvement. The national average during the same period
was a statistically significant increase of one point. In 2022, after pandemic shutdowns,
the state’s scores declined to a statistically significant eight points below the 2002 level,
while scores nationally were unchanged from 2002.
o In grade 8 Reading, New York scores improved to significantly above average in 2003,
2005 and 2007, but by 2022 were statistically unchanged from 2002.
o In grade 4 Mathematics, the relative performance of New York pupils has worsened in
the post-pandemic period, plunging 10 points from 2019 to 2022, to a level nine points
lower than in 2003. By comparison, during the same period, the nation’s scores
dropped by four points, to a level statistically unchanged from 2003.
o In grade 8 Mathematics, New York scores essentially equaled the national average, af-
ter fluctuating in a narrow range in tests administered between 2003, when it was
above average. Both the state and the nation lost ground from 2019 to 2022, ending
up at a significantly lower point than in 2003.
*-denotes statistically significant difference from U.S.

THE NEXT NEW YORK
36
Charter schools manage to stack up well against state average results for all
school districts—rich and poor—even though charters are typically found in
lower income communities. Considered as if a separate district, New York City’s
largest charter school network, Success Academies, would be the highest-scoring
district in the state.
As also shown in Figure 2, the charter school advantage is even more dramatic
for black students, who outperform the ELA and Mathematics scores of black
students in traditional district schools by 21 points and 31 points, respectively.
More than 31 percent of black students in charter schools score at the highest
level (Level 4) on the mathematics test—higher than the 26 percent share of black
students attaining scores in Levels 3 and 4 combined in traditional public schools.
The misguided college-for-all push
In the mid- to late-1990s, the state began phasing in a requirement that all
students must take and pass five Regents exams as a minimum requirement for a
high school diploma. The exams had been in place since the late 19
th
century,
intended for the subset of students who were deemed able to pursue a college-
preparatory track in high school. Other students were placed on a “general” or
vocational track and were awarded a local diploma after successfully completing
their course of study and passing a single minimum-competency test.
The introduction of the Regents exam graduation requirement for all students
paralleled a wave of national school reform efforts that culminated with passage
of the federal No Child Left Behind Act of 2001,
7
which was aimed at promoting
the broad standards of greater accountability, higher standards, and expanded
choice for parents of children in failing schools.
8
To comply with that law’s
stepped-up assessment mandate as a condition for federal aid to states, New York
Renewing and Reforming the Empire State
37
State in 2006 began administering annual English Language Arts (ELA) and Math
tests in Grades 3 through 8.
9
In 2010, the Board of Regents adopted the multi-state Common Core Stand-
ards Initiative, which effectively measured all students against a college-readiness
standard. Within a few years, the combination of stepped-up annual testing in
elementary grades and controversial Common Core standards had prompted a
mini-rebellion among New York parents, who began to exercise their right to
withhold their children from taking part in assessments. This “opt-out” move-
ment was particularly strong in suburban and upstate districts, while rates of with-
drawal from testing were lower in New York City, other large cities, and in charter
schools.
10
By 2016, the opt-out rate had reached 22 percent (including 51 percent
of white students, according to one study). It declined to 16 percent by 2019, still
a fairly strong indicator of parental discontent even before the onset of the
COVID-related school closures.
Prior to the pandemic, the Board of Regents announced it would begin con-
sidering changes to high school graduation standards. Such a review is clearly nec-
essary: as of 2019, thanks to the increasingly college-focused emphasis of the pre-
ceding two decades, only six percent of all students had completed one of five
approved multiple pathways in fulfillment of the high school graduation require-
ment, including career and technical education.
The state’s community college systems, contained within the State University
of New York and City University of New York systems, reflect this over-emphasis
on academics over preparation for the workforce. Both systems have low gradu-
ation rates, and both have few students enrolled in the types of certificate pro-
grams being used in other states to quickly prepare students for jobs in the current
labor market. As Tamar Jacoby of Opportunity America found in a recent study
of community colleges and workforce preparation:
At community colleges nationwide, the mix of programs skews slightly in favor of
job-focused instruction. Students preparing for the world of work account for 54 per-
cent of enrollments; those studying traditional academic subjects account for 46 per-
cent. In New York State, the ratio is reversed: 55 percent academic education to 45
percent vocational programs.
11
Given recent policies, there are grounds for concern that the Regents’ review
of graduation requirements will result in generally lower standards rather than a
mix of more realistic goals for students.
For example, the state Education Department suspended the use of Regents
exams at the end of the 2020 and 2021 school years and continued the suspension
of some exams in 2022 as well. In September 2022, the department extended a
policy allowing students who scored below the traditional passing score of 65 on
a Regent’s exam to appeal the grading if they scored a minimum of 50 on that
test. This followed years of evidence that the test themselves had been “dumbed
down” to maximize the number of passing students. Requiring all students to take
examinations that were once only required of college-bound students, and then
creating loopholes for students to earn credit for lesser scores, has served only to
breed further mistrust in the system.
THE NEXT NEW YORK
38
MOVING FORWARD
The State’s approach to education over recent decades has been to steadily
increase spending while nominally raising standards. That approach has failed to
deliver on its promises of higher achievement and greater equality of outcomes.
Meanwhile, New York’s public school system has been experiencing steep enroll-
ment declines.
Local decisions to keep schools closed to live instruction over the past two
years have eroded the trust between families and schools that is so necessary for
success. The situation cries out for strong gubernatorial and legislative leadership
to rethink educational policy in the state. The guiding principle should be to earn
and maintain the trust of families who are their children’s first educators. Man-
dates from Albany, and the passing on of mandates from Washington must be
curbed in favor of local, democratic governance of school districts and expanded
choice for parents outside the school district system.
Families differ in what they expect of schooling. Some fully expect their chil-
dren to attend and succeed in college. Others see their child’s future in the trades
or other forms of work. Some believe that the primary goal of education should
be to prepare children for economic success in life. Others believe that the pur-
pose of schooling is to mold adults of strong moral character and emotional well-
being, particularly when it conforms to their own beliefs, religious or otherwise.
State officials should not respond to all of these legitimate beliefs about the
purpose of education with a top-down, one-size fits all approach. Rather, they
should embrace the concept of educational pluralism, reflecting the pluralistic na-
ture of the state’s population. There are five broad areas in which the governor,
in particular, can lead a change in approach to education:
• Expand school choice. The cap on new charter schools in New York
City should be abolished. In addition, the state should respect parental
choices and acknowledge the value that many parents hold for religious ed-
ucation. In implementing the Board of Regents’ latest regulations on “sub-
stantial equivalency” in private and religious schools, local school districts
should tread lightly and only intervene in the extreme cases of educational
neglect. In addition to reviving the Educational Investment Incentives
Credit, the state should enact a program diverting a portion of local school
aid to Education Savings Accounts for parents and guardians who choose
to withdraw their children from state-funded public or charter schools in
favor of private schools. Funds in the savings account could be used to pay
private school tuition or supplementary education services such as private
tutoring or online learning.
12
• Rein in spending. State aid increases have served mainly to subsidize gen-
erous teacher salaries and costly fringe benefits, as reflected by long-term
spending trends. Going forward, however, unrestricted Foundation Aid to
local districts should be strictly linked to enrollment, with no mandatory
minimum increases for districts with declining pupil counts. A portion of
Renewing and Reforming the Empire State
39
funding should instead support innovations such as Educational Savings
Accounts and incentive credits, which could save the state and local school
districts between $158 and $301 million per year.
13
• Align graduation and proficiency standards with real-world needs
and expectations. The Regents should back away from its exclusive col-
lege-readiness goal and re-establish high school curriculum and assessment
tracks oriented toward preparation for entry to the workforce, creative arts,
or any number of other valid outcomes of high school.
• Expand community college trade and workforce preparation pro-
grams. Too few students entering the state’s community college emerge
with a two-year degree. More than half do not even return to school for
their second year. While the ability to begin work towards a bachelor’s de-
gree in community college should be maintained, that approach works for
too few. SUNY and CUNY community colleges need to embrace a new ap-
proach and ramp-up short-term certificate programs aligned with industry
standards in various fields and create more associate degree programs also
aligned to industry standards. These efforts must be planned and devel-
oped with the full participation of industry and labor leaders.
• Reform educational governance to build accountability. Nineteen of
the 20 executive branch departments of New York State government are
run by gubernatorial appointees. The exception is the State Education De-
partment, whose commissioner and staff are answerable solely to the Board
of Regents, constitutionally designated as New York’s pre-eminent educa-
tional policy-making and professional credentialing body. Under current
law, the board consists of 17 members serving five-year terms—one repre-
senting each of the state’s judicial districts, and four selected an at-large ba-
sis—all appointed by concurrent resolution of the Legislature. While the
governor plays a lead role in shaping the finances of the education system
through the Executive Budget, legislative control of Regents appointments
unduly limits the education policy input of New York’s elected chief execu-
tive. This can be remedied by amending Education Law to require the Leg-
islature to select all four at-large Regents solely from lists of nominees ad-
vanced by the governor, and to require that the Regents elect their chancel-
lor from the at-large group.
14
Governance reform is needed at the local level as well. In districts outside the
state’s five largest cities, the odd timing of school board elections and budget
votes limits voter turn-out and makes it easier for organized local interest groups,
particularly teachers’ unions, to dominate the process. Shifting these votes to No-
vember (while keeping board elections nonpartisan) would serve to increase turn-
out and broaden the base of local groups involved in the process. Further, the
State Education Department and Board of Regents should promulgate guidance
on the true purpose of school boards, which is to mediate discussion between the
larger community and the local school system’s leadership on policy matters.

THE NEXT NEW YORK
40
APPENDIX
The Structure of Schooling in New York State
New York’s education sector is large and diverse. In the most recent
year, 2021-22, over 2.8 million students attended one of 6,520 district,
charter, and private religious schools in the state.
Outside of New York City, the average school district includes 6.4
schools, with average enrollment of 517 students per school and total
enrollment of 3,320 students. In all but the largest cities, public school
districts cover parts of multiple municipalities and have a separate tax
base and tax-collection calendar. These mostly suburban and urban
districts are very local in nature, each with their own elected school
board and budget levies subject to local votes.
The cities of Buffalo, Rochester, Syracuse, and Yonkers are governed
by separate school boards but funded out of municipal budgets, without
separate budget votes or tax levies. New York City is the outlier, with a
single district and a 15-member school board, known as the Panel for
Education Quality, whose majority is controlled by eight mayoral ap-
pointees. Its budget is set through negotiations between the Mayor and
City Council.
Between 2012-13 and 2021-22, New York State’s school enrollment
across all sectors decreased by 200,931 students, or 6.5 percent, as
detailed in Table 4 below. A loss of 301,678 students in district schools
(-11.7 percent) was partially offset by growth in the charter school sec-
tor, which gained 95,379 students in those years—a 10-year growth
rate of 122 percent. Private and religious schools lost 30,404 students,
a drop of 7.3 percent. The smallest sector—home schooling—was also
the fastest growing. The number of home-schooled children nearly tri-
pled, from 18,642 in 2012-13 to 54,414 by 2021-2122, with most of
that increase starting after the pandemic.

Renewing and Reforming the Empire State
41
These enrollment trends have changed the mix of schooling in the
state, as traditional district-run public schools now enroll 78.8 percent of
all K-12 students, down from 83.5 percent ten years ago. Charter
school enrollment has increased rapidly, to six percent of all students.
Charter growth has been much more rapid in New York City than in the
rest of the state; 11.8 percent of the city’s students now attend charter
schools, though the creation of new charter schools in the city is cur-
rently halted under a state-imposed cap on the number of such schools
in the city.
State-wide enrollment in private and religious schools has remained
constant at 13.3 percent of all students, but the percentage of home-
schooled students has more than doubled since 2018-19, to 1.9 percent
of all students. New York City has a higher percentage of students in
private and religious schools, 18.7 percent, and 47 percent of those stu-
dents are in the growing Jewish school sector.

THE NEXT NEW YORK
42
ENDNOTES
1
Ken Girardin, “NY’s stratospheric school spending,” Empire Center report, July 26, 2017.
https://www.empirecenter.org/publications/nys-stratospheric-school-spending/
2
Article 56 of state Education Law.
3
Ibid.
4
http://www.nysed.gov/charter-schools/charter-schools-directory
5
The Education Investment Incentives Act, S. 6808 of 2013-14.
6
Because NAEP is based on a sample of students, its estimate of a state’s average score contains a
margin of error. Fortunately, the NAEP data site allows one to test the statistical significance of the dif-
ferences in average scores across jurisdictions or years. An observed difference is interpreted as no
difference if it is within the standard error of the estimates.
7
P.L. 107-110, 20 U.S.C. § 6319 (2002)
8
The NLCB was replaced in 2015 by the federal Every Student Succeeds Act, which reduced assess-
ment mandates on states, but New York did not change its testing program.
9
Prior to 2006, ELA and Math tests had been administered only in 4
th
and 8
th
grades.
10
A more detailed description of the school reform efforts and parental pushback is found in “New
York’s Parents are Exercising Their School Options”. R. Domanico, Manhattan Institute for Policy Re-
search, June 2022.
11
“Training Tomorrow’s Workers: Next Steps for New York’s Community Colleges” T. Jacoby, Man-
hattan Institute for Policy Research”, March 2022.
12
For a fuller description of ESAs, see: “Educational Savings Accounts: How ESAs can promote Educa-
tional Freedom for New York’s Families and Improve State and Local Finances” M. Lueken, Manhattan
Institute for Policy Research, October 2021.
13
See Lueken.
14
This could be accomplished within the next gubernatorial term, since the current terms of all four at-
large Board of Regents members, including Chancellor Lester Young, expire by 2025.

4.
Medicaid and Health Care
By Bill Hammond
New York State’s Medicaid program has ballooned to an unprecedented scale
over the past decade—and so, too, has its long-standing dysfunction.
Enrollment has surged to cover more than a third of the state’s population and
almost half of New York City’s. Its budget has soared to more than $90 billion, a
76 percent increase in 10 years, as shown in Figure 1.
Much of this growth occurred before the coronavirus pandemic, a period when
unemployment was generally low and poverty was declining. In effect, the state
stretched what was meant to be a safety net for the poor and disabled to cover
people further up the income scale, many of whom were able-bodied and gainfully
employed. As of 2019, in fact, New Yorkers above the federal poverty level ac-
counted for more than half of Medicaid enrollment.
1
The program’s broadening scope has magnified the effects of its pre-existing
structural flaws. Its practice of paying substandard fees now compromises access
and care quality for millions more of the state’s residents. Its vulnerability to inept
management, fraud and political manipulation puts billions more of the public’s
money at risk.
Medicaid’s massive growth has introduced a new danger of mission creep. The
burgeoning cohort of non-poor and non-disabled recipients are now competing
in Albany for Medicaid’s money and attention. That will inevitably distract from
care for the needier individuals, who ought to be top priority.
The growing challenge of running Medicaid is also a distraction from the
Health Department’s other duties, such as inspecting hospitals and nursing

THE NEXT NEW YORK
44
homes, regulating the quality of drinking water and monitoring the spread of in-
fectious diseases. As the department’s Medicaid-related staffing climbed over the
past decade, the number of personnel devoted to public health functions
shrank
2
—which helps to explain why the state was so ill-prepared for the corona-
virus pandemic (see Figure 2).
Meanwhile, the state contributes to the demand for government-funded health
coverage through heavy regulation and taxation that drive up New York’s com-
mercial premiums, which are the highest in the continental U.S.
3
Especially coun-
terproductive is New York’s practice of financing Medicaid in part through bil-
lions in surcharges on commercial health plans—an approach that exacerbates
the problem it’s meant to solve.
In a better-balanced health-care system, the state would repeal its insurance
taxes, roll back regulations and otherwise work to make basic medical coverage
as affordable and accessible as possible. More New Yorkers would be enrolled in
commercial insurance that pays market-based fees, improving the bottom lines of
providers who treat them.
As Medicaid gets smaller—and refocuses on its neediest recipients—the state
could reinvest a portion of its savings to pay more competitive fees, boosting
reimbursement for safety-net caregivers. The Health Department could devote
more resources to public health functions, and the program’s overall pressure on
state finances and taxpayers would be relieved.
Beyond Medicaid, other aspects of the state’s oversight of health care need
attention:
o The state’s pandemic defenses—whose critical weaknesses were exposed
by COVID-19—should be repaired and strengthened based on a thor-
ough study of recent events. Although Governor Hochul has announced
the hiring of a consultant for an after-review, that task would be better as-
signed to a special commission of independent healthcare and health pol-
icy experts insulated from political interference.
Renewing and Reforming the Empire State
45
o The average rankings of New York’s hospitals consistently fall near the
bottom of major quality report cards.
4
The Health Department should be
studying why this happens and pushing the industry to do better–by gath-
ering and publishing data on hospital performance and identifying and
promoting best practices.
o The state’s “certificate of need” law—which regulates the creation or ex-
pansion of hospitals, nursing homes, clinics, and other health-care facili-
ties—is one of the most restrictive in the U.S.
5
This process inhibits mar-
ketplace competition that can broaden consumer choice, control cost, and
encourage better quality of care.
THE STATUS QUO
The governor administratively oversees a Medicaid system that has grown dra-
matically over the past decade, both in size and cost, on top of what were already
high levels relative to other states. Since 2012, enrollment has risen 49 percent to
7.3 million—about half of that during the pandemic—and spending has increased
76 percent to $93 billion.
6
Other states’ Medicaid programs were also expanding rapidly during this pe-
riod, as President Obama’s Affordable Care Act gave them an incentive to adopt
broader eligibility standards, similar to what New York had been using before the
ACA’s passage. Yet New York remained at the top in terms of spending, with
per-capita Medicaid expenditures 69 percent above the national average and 9
percent higher than the No. 2 state, New Mexico.
7
New York’s No. 1 status is not readily explained by demographic or economic
factors. Among the 50 states, it ranks 19
th
for poverty,
8
25
th
for median age
9
and
37
th
for the share of its population with a disability.
10
In fact, New York’s poverty rate was declining as enrollment surged, leading
to a profound shift in the program’s makeup: As of 2019 half or more of its en-
rollees were living above the poverty level.
11
What began as a “safety net” health
plan for the indigent and disabled has evolved into an increasingly mainstream
form of insurance for people who are able-bodied and employed.
Compounding this trend is the federal government’s “continuous enrollment”
policy during the pandemic, which has required states to keep people on their
Medicaid rolls regardless of changes in employment or income. Before COVID,
New York’s enrollment was hovering around 6 million or 30 percent of the state’s
population. As of July 2022, those figures had surged to 7.6 million and 37 per-
cent.
12
When the federal emergency ends—which is expected in 2023—officials in
New York and other states face the challenge of conducting millions of back-
logged eligibility reviews even as they handle routine enrollments and dis-enroll-
ments, a process that could take a year or more.
Unusually expansive enrollment is not the only driver of the New York’s high
Medicaid spending. It also spends more on a per-enrollee basis than all but five
other states. This is due in part to relatively generous benefits, including excep-
tionally high and rapidly rising expenditures on personal assistance—which
THE NEXT NEW YORK
46
provides non-medical support, such as help with bathing, eating, and housekeep-
ing, to disabled enrollees in their homes.
“Dishing” out supplemental money
Another stand-out feature of New York’s Medicaid program is heavy use of
supplemental funds that are distributed to providers as grants rather than com-
pensation for care. Much of this money flows through Medicaid’s Disproportion-
ate Share Hospital program, or DSH, which was originally designed to compen-
sate facilities that treated a disproportionate number of Medicaid patients. Be-
cause allocations to states have been effectively frozen since 1992, and because
Albany officials had aggressively exploited the program earlier in its history, New
York receives more DSH funding that any other state—almost $2 billion a year,
or $3.9 billion with state and local matching money included. That $2 billion is 15
percent of the federal total, when New York has six percent of the nation’s pop-
ulation.
13
Need-based—or not
As with the federal allocations to states, the state’s distribution to hospitals is
not consistently related to need. Nominally, the state distributes about half of this
money based on the amount of “charity care” hospitals provide to uninsured,
indigent patients. However, the formula caps how much each facility’s grant can
change from year to year, resulting in significant distortions. Some hospitals
providing relatively little charity care receive disproportionately large grants, while
some of the true safety-net hospitals are short-changed.
The fraud issue
Fraud is a chronic problem in New York’s Medicaid program. The true cost of
fraud is inherently hard to measure, but it has likely grown along with its overall
size and budget. Despite this risk, New York’s anti-fraud efforts in some areas
have been relatively weak. From 2012 to 2015, for example, the state’s Medicaid
Fraud Control Unit conducted only 21 investigations of personal care fraud—0.3
percent of the national total—even though New York accounted for a third or
more of Medicaid spending on that benefit.
14
Meanwhile, state lawmakers are debating a measure that would weaken en-
forcement by the Office of the Medicaid Inspector General by restricting how
much restitution it can require from providers based on auditing a sample of
claims.
15
Despite heavy spending, the coverage provided by Medicaid is substandard.
Based on the Empire Center’s analysis of New York hospital data from 2015,
Medicaid paid rates that averaged five percent lower than Medicare and 43 percent
lower than commercial insurance.
16
Providers that treat large numbers of Medi-
caid patients typically have less money to pay staff, buy equipment or maintain
facilities, which tends to undermine their quality of care and threaten their finan-
cial viability.
Renewing and Reforming the Empire State
47
The reimbursement disparity compromises access to care. A study of medical
records from 2014 to 2017 found that only 63 percent of New York’s physicians
were accepting new Medicaid patients, the fifth-lowest rate in the U.S.
17
The role of Obamacare
Medicaid’s transformation from narrow safety-net to a broad catch-all insur-
ance program—and the resulting spike in enrollment and spending—was largely
a byproduct of the Affordable Care Act, President Obama’s signature health-care
reform law, which passed Congress in 2010 and took effect in 2014.
The law aimed to move toward universal coverage with a combination of two
basic strategies: expanding Medicaid for the poorest group of the uninsured and
subsidizing commercial coverage for a swath of middle-income Americans who
lacked employer-sponsored health benefits.
The law called for states to lift their Medicaid eligibility threshold to 138 per-
cent of the poverty level, with the federal government initially covering 100 per-
cent of the cost of newly eligible enrollees, phasing down to 90 percent after five
years. This was more generous than Medicaid’s traditional formula for federal
matching aid, which ranged from 50 percent to 80 percent of a state’s costs. (The
ACA originally required states to expand Medicaid. A Supreme Court ruling later
made it optional.)
When the law was enacted, New York was one of a handful of states whose
Medicaid programs already covered most of the target population. For those
states, the ACA provided enhanced federal matching aid for a portion of their
previously eligible adult enrollees.
For people with incomes just above the Medicaid threshold—from 138 per-
cent to 400 percent of the poverty level—the ACA offered tax credits and other
subsidies that limited the cost of coverage to 9.5 percent of their annual income.
To qualify for credits, consumers had to purchase standardized plans offered
through government-operated insurance exchanges.
The law initially included an “individual mandate,” meaning that people with-
out insurance were obliged to obtain coverage or face possible tax penalties. These
penalties were later reduced to zero by Congress.
New York established its insurance exchange, known as the New York State
of Health, as a unified portal for both public and private coverage options. After
the system went into effect, an unexpectedly large number of applicants flowing
through the exchange were determined to be eligible for Medicaid. Although pov-
erty was declining and New York’s Medicaid enrollment was already large by na-
tional standards, the program grew by more than 900,000 or 18 percent over the
first two years. Less than half that number, or 415,000, signed up for commercial
coverage through the exchange.
18
Enrollment gradually rose to about six million and stayed there for several
years, even as the poverty rate declined. By 2019, the Census Bureau estimated
that the number of non-elderly New Yorkers living below 138 percent of the
poverty level had dropped to 2.9 million, or less than half of Medicaid’s enroll-
ment, as shown in Figure 3.
19

THE NEXT NEW YORK
48
The reasons for this disparity—among the widest in the U.S.—deserve an of-
ficial investigation. One factor may be that Medicaid eligibility extends above 138
percent of poverty for certain targeted groups, such as pregnant women and new
mothers. Also, the ACA threshold is based on “modified adjusted gross income,”
drawn from tax law, while the Census Bureau uses a broader definition of income.
At the same time, the disparity might mean ineligible applicants are slipping
through the state’s screening process at a greater rate than previously known.
Exceptionally “essential”
The reach of government-funded coverage surged further in 2016 when New
York launched its Essential Plan, an optional benefit under the ACA that was
exercised by only one other state, Minnesota.
Under this option, states can establish government-operated Medicaid-like
plans for residents up to 200 percent of the poverty level. To finance these plans,
the federal government supplies 85 percent of the money it otherwise would have
spent on insurance tax credits and other subsidies for the enrollees. This formula
has proven to be unexpectedly generous, consistently providing more than aid
than necessary to cover the program’s entire cost.
As of June 2022, the Essential Plan trust fund had built up a surplus of more
than $8 billion.
20
The state initially charged a portion of the program’s enrollees a
modest $20 a month, but those premiums were eliminated in 2021. More predict-
ably, the offer of free or nearly-free health coverage has been popular with eligible
consumers. As of this year, its enrollment has risen to almost one million.
21
The Essential Plan is technically separate from Medicaid and the state is re-
sponsible only for administrative costs, which are about 1 percent of its budget.
Like Medicaid, however, it pays substandard fees to providers and diverts poten-
tial consumers out of the commercial marketplace.
The mandates of the ACA—and its drive towards universal coverage—
meshed with Albany’s long-standing tendencies with respect to Medicaid. Hospi-
tals, nursing homes, and unionized health-care workers are some of the Capitol’s
Renewing and Reforming the Empire State
49
biggest spending and most influential interest groups, and most lawmakers of
both parties are eager to win their favor. Many lawmakers have come to view
Medicaid as way of drawing federal aid to the state, where it benefits their favored
constituents and generally boosts the health-care economy. For every $1 the state
spends, they reason, the state’s health-care system collects $2 or more. Elected
officials who oppose spending more on Medicaid run the risk of being accused
of putting people’s health at risk.
Governors have sometimes tried to rein in the program, notably including for-
mer Governor Andrew Cuomo during his first term. However, Cuomo’s focus
on taming Medicaid dissipated over time and the program returned to a pattern
of rapid spending growth, leading to multi-billion-dollar budget overruns before
the pandemic arrived in the middle of his third term. During her first year in
office, Governor Hochul has promoted or acceded to expensive Medicaid rate
increases, worker bonuses and wage hikes while putting little emphasis on trim-
ming rolls or containing costs.
High-cost private health insurance
Another factor behind Medicaid’s sprawl is the unaffordability of commercial
insurance in New York, which is due in large part to policies set by Albany.
According to a federal survey, New Yorkers and their employers pay the high-
est premiums in the continental United States. In 2021, the average premium for
single coverage in New York was almost $1,200 or 16 percent above the national
norm—the widest gap since the survey began in the mid-1990s.
22
The state directly adds to premium costs by imposing unusually heavy taxes on
insurance through a law called the Health Care Reform Act. The law’s two sur-
charges raise $5.2 billion a year,
23
making them the state’s third largest source of
revenue after income and sales taxes and adding hundreds of dollars to a typical
family’s premium.
24
Albany also makes insurance more expensive by continually imposing addi-
tional coverage mandates without a sober analysis of costs and benefits. A recent
example, enacted in 2019, requires large group plans to cover at least three cycles
of in vitro fertilization, a costly procedure for inducing pregnancy.
“Redesign” and relapse
The prelude to Medicaid’s expansion over the past decade was former Gover-
nor Cuomo’s Medicaid “redesign,” an unusually sweeping and aggressive effort
to contain the program that unfolded during his first term.
25
As Cuomo took office in 2011, the state faced a $10 billion projected budget
gap, much of which he attributed to Medicaid.
The state’s finances were still suffering the effects of the Great Recession, but
extra federal Medicaid money that Washington had forwarded to states as a tem-
porary relief measure was phasing out. Albany’s share of the Medicaid budget was
due to jump by $6 billion in a single year
Cuomo proposed a combination of immediate spending cuts—including the
elimination of automatic “trend factors” that annually boosted provider fees—
THE NEXT NEW YORK
50
along with a set of structural reforms, all of which were approved by the Legisla-
ture. His reforms included:
o Imposing a “global cap” on the state share of Medicaid spending, limiting
the rate of annual growth to the 10-year rolling average of the medical in-
flation rate.
o Appointing a 25-member Medicaid Redesign Team of state officials and
industry stakeholders to find the savings necessary to live within the cap.
o Empowering the health commissioner to unilaterally cut provider fees if
cost-cutting fell short and the program began to go over budget.
Taken together, these steps transformed the political dynamics surrounding
Medicaid. The cap brought a measure of restraint to spending growth, especially
in the context of rising enrollment. The redesign team provided a calmer, more
collaborative venue to hash out the complexities of Medicaid reform—a contrast
to the politicized annual stand-offs in the Legislature, which often led to late
budgets while achieving limited progress. The commissioner’s additional budget
powers, although never invoked, gave industry officials an incentive to collaborate
on finding savings.
26
The redesign team agreed on 79 proposed changes to the program, nearly all
of which were formally approved by the Health Department and the Legislature.
The most significant involved outsourcing more recipients into private health
plans, a system known as Medicaid managed care. Enrollment in this program
became mandatory for nearly all recipients, including groups that had previously
been exempted, such as nursing home residents and people with lifelong mental
or physical disabilities.
A second major reform added prescription drugs to the set of benefits over-
seen and reimbursed by Medicaid managed care plans. Pharmacy claims had pre-
viously been directly paid by the Health Department. After adoption of this phar-
macy “carve-in,” the average cost per Medicaid prescription plunged by one-fifth
in two years.
27
In 2012, Cuomo and the Legislature agreed to freeze the Medicaid contribu-
tions paid by New York City and the 57 other county governments—leaving the
state to absorb any increase in the non-federal share of Medicaid costs going for-
ward. That freeze took full effect in 2015.
In another significant development of Cuomo’s first term, the state won an
additional $8 billion in federal funding over five years to establish the Delivery
System Reform Incentive Payment program, or DSRIP. This money was allocated
to regional consortiums of hospitals and other health-care providers and social
service groups, who were tasked with improving the coordination of services for
Medicaid patients and reducing avoidable hospital visits.
For several years, Cuomo’s redesign showed signs of working as intended to
contain costs. Overall Medicaid spending—which historically had risen faster
than inflation—stayed virtually flat until fiscal 2014-15, when the advent of the
ACA caused enrollment to spike. Even then, a surge of additional federal aid tied
to the ACA kept the state’s share of expenses in relative check.

Renewing and Reforming the Empire State
51
Eroding discipline
Towards the middle of Cuomo’s second term his administration’s focus on
Medicaid cost control began to wane.
The governor and Legislature weakened the global cap by adding loopholes,
the most significant of which exempted the costs of a 2016 hike in the state’s
minimum wage, which lifted the rate from $9 to as high as $15 an hour over the
ensuing three years. The state committed to reimburse providers for their mini-
mum wage-related expenses, which mushroomed much faster than officials ini-
tially estimated and quickly rose into the billions. The state’s share alone is now
estimated at $2.2 billion per year,
28
an amount which is added on top of the infla-
tion-based increases authorized under the cap.
In the middle of the last decade, the state also began to see explosive growth
in Medicaid’s spending on home-based care for the elderly and disabled—espe-
cially in the category known as personal care, which refers to non-medical services
such as help with eating, bathing, shopping and housekeeping.
New York’s spending on this optional benefit has long been exceptionally
high—amounting to $3.2 billion, or one-quarter of the national total, when
Cuomo took office in 2011. By 2016, the tab had risen to $5.6 billion or 40 percent
of the national total—and over the next five years it nearly doubled to $11.4 bil-
lion.
29
Although recent nationwide figures are not readily available, it’s likely that
New York is currently spending more on personal care than the other 49 states
combined.

THE NEXT NEW YORK
52
Renewing and Reforming the Empire State
53
As of 2019, the last year for which comparable data are available, New York’s
per capita Medicaid spending on personal care was an outlier at almost eight times
higher than the average for the 40 states offering the benefit (see Figure 4, above).
The recent surge appears to have been sparked by the Medicaid redesign and
its shift of long-term care patients into managed care, under which plans have an
incentive to sign up as many potential clients as possible and thereby collect
monthly premiums from the state. Another factor has been the rapid proliferation
of the “consumer-directed” form of personal care, which allows patients to by-
pass traditional home care agencies and directly hire the caregiver of their choice,
which can be a friend or family member. Hundreds of companies devoted to sup-
porting this program, known as fiscal intermediaries, have sprung up across the
state.
The state has proposed some efforts to contain personal care costs, such as
attempting to tighten regulation of fiscal intermediaries, but it has run into well-
organized and heated opposition from the industry, its disabled clientele and their
supporters in the Legislature. After dipping during the pandemic, demand for
personal care has bounced back to its previous levels and beyond.
The goal of containing Medicaid costs was further undermined by raw politics.
As Governor Cuomo approached his third term re-election campaign in 2018, he
used Medicaid to finance an expensive deal with New York City-area hospitals
and nursing homes and their major labor union, 1199 SEIU. The deal began with
the governor extracting $2 billion from the sale of non-profit Fidelis Care health
plan, which was controlled by the state’s Catholic bishops, to for-profit Centene
Corp. The money was deposited in a newly created Health Care Transformation
Fund, which the governor could effectively spend on any health-related purpose
without further consulting the Legislature.
30
Shortly before Election Day, the governor quietly allocated a portion of that
fund to finance Medicaid rate hikes for hospitals and nursing homes—rate hikes
the Greater New York Hospital Association had sought to finance its members’
labor contract with 1199. It was later revealed that the hospital association had
contributed more than $1 million to the state Democratic Party, which was con-
trolled by Cuomo, in the months before the governor’s unilateral action.
31
Even before that rate hike, Medicaid spending had begun chronically running
over its budget—and administration officials failed to raise an alert about the
problem or invoke their authority to cut spending under the global cap. Instead,
they papered over the shortfall by secretly delaying $1.7 billion in Medicaid pay-
ments from March to April 2019, shifting the spending from one fiscal year to the
next. This threw the newly passed state budget immediately out of balance, yet
officials did not notify the Legislature or the public until May.
32
The governor eventually acknowledged that the maneuver had triggered a $2.2
billion deficit and in January 2020 delegated the job of closing it to a reconstituted
Medicaid Redesign Team.
That process was still unfolding when the coronavirus began sickening and
killing thousands of New Yorkers in March 2020.
THE NEXT NEW YORK
54
The COVID complication
The coronavirus pandemic disrupted Medicaid in complicated and conflicting
ways.
On one hand, the crisis prompted the federal government to boost Medicaid
funding for states—sending an extra $3 billion per year to New York on top of
billions in other emergency relief. The earlier phase of the crisis also slowed de-
mand for medical care across the board, causing a rare dip in Medicaid spending
in the 2020-21 fiscal year and temporarily easing pressure on the state’s finances.
On the other hand, the extra Medicaid money from Washington came with
strings attached—federal “maintenance of effort” rules that bar states from rou-
tinely disenrolling recipients who lose eligibility or making certain other cost-cut-
ting moves.
In Albany, this has prevented the Cuomo and Hochul administrations from
fully implementing some of the second Medicaid Redesign Team’s proposed re-
forms. The pandemic-induced economic crisis also triggered a surge of new en-
rollment in Medicaid as people lost their jobs and employer-based health benefits.
After the brief slowdown in 2020-21, Medicaid costs have bounced back at
ferocious rates. Since then, overall spending has jumped 23 percent and the pro-
jected state share is up 48 percent—from $22 billion to $33 billion in just two
years.
33
Given the very real pressures and sacrifices much of the health-care system has
experienced during the crisis, the governor and lawmakers emphasized catering
to the industry’s requests and perceived needs rather than squeezing it for budget
savings.
In her first full year as governor, Hochul for the most part` positioned herself
as the health-care industry’s ally in Albany. She pushed through Medicaid-fi-
nanced pay bonuses for a large swath of health-care workers, authorized rate hikes
for hospitals, nursing homes and other providers, agreed to a $3 hike in the min-
imum hourly wage for home care workers, further weakened the “global cap” on
spending, and committed herself to the dubious goal of growing the health-care
workforce by 20 percent over five years—in a state that already has 28 percent
more health-care workers per capita than the national average.
34
Looking ahead, the state is likely to face a fiscal reckoning on Medicaid. When
President Biden formally ends the federal pandemic emergency, which is expected
in 2023, that will mark the end of extra Medicaid funding that has been flowing
to New York at the rate of almost $3 billion a year.
35
On top of filling that budget hole, the governor’s financial plan must also ad-
dress the effects of a slowing economy, which has weakened revenue forecasts
and created billions in projected deficits for the years ahead.
Meanwhile, the minimum wage for home health workers is due to increase by
$2 an hour this October and another $1 next year—a hike approved in this year’s
budget that is projected to cost Medicaid an estimated $7.7 billion over the next
four years.
36
Renewing and Reforming the Empire State
55
MOVING FORWARD
The overarching goal of Medicaid reform should be a rebalanced health-care
system—with a smaller, more efficient Medicaid program that delivers higher-
quality care for the truly needy, combined with a larger commercial insurance
market that’s affordable and accessible to everyone else.
An immediate priority is to slow the growth of the state’s share of Medicaid
spending, which spiked by 18 percent in fiscal 2023 and is on track to balloon by
another 20 percent over the next four years.
The usual solution of across-the-board cuts to provider payments should be
avoided, because it would further widen the unhealthy gap between Medicaid re-
imbursements and market rates. Instead, the state should look for systemic re-
forms that make the program more efficient and sustainable, perhaps by reinvig-
orating the Medicaid Redesign Team process.
As a minimum first step, officials should expeditiously follow through on cost
controls that lawmakers adopted in 2020 but were put on hold during the pan-
demic emergency. These include tighter medical and financial eligibility limits on
home-based personal care for the elderly and disabled.
In other areas of health policy, New York leaders should develop state-of-the-
art systems to detect and contain future pandemics, push to improve the low av-
erage quality of New York’s hospitals, and foster consumer-friendly competition
in the health-care industry by rolling back the “certificate of need” law.
The list of needed reforms starts with the following priorities:
• Tighten income-screening procedures. This will help ensure that existing
Medicaid eligibility standards are consistently enforced. In addition:
o Crack down on the legal maneuvers that allow people to conceal or
shield substantial assets when applying for benefits.
o Strengthen the “global cap” by tying it to a need-based benchmark,
closing loopholes and following through with consistent enforcement.
o Restructure the managed long-term care program to ensure that partici-
pating health plans are incentivized to control spending.
o Tighten eligibility for personal care benefits. Establish personal care as
a discretionary benefit rather than an entitlement, allowing officials to
target services to the neediest individuals.
o Strengthen controls on consumer-directed personal care to assure that
patients are getting necessary services and to prevent fraud.
o As Medicaid rolls decline, use a portion of the savings to boost pro-
vider payments closer to the market standard.
o Reduce or eliminate supplemental grants and reallocate the money to
pay for services rendered.
• Make commercial coverage more affordable and accessible. Essential
steps towards realizing this goal would include eliminating taxes on health
insurance under the Health Care Reform Act; establishing a commission to
review all insurance coverage mandates, both existing and proposed;
THE NEXT NEW YORK
56
repealing or rejecting mandates that are not clearly cost-effective and sup-
ported by independent medical research; and considering the establishment
of state-based consumer and employer subsidies to supplement the federal
tax credits available through the Affordable Care Act.
• Improve the state’s public health system. This can start with establish-
ment of an independent pandemic review commission to investigate
strengths and weaknesses of the state’s COVID-19 response, study best
practices in other states and countries, and design defenses that best protect
the state from future outbreaks.
Further improvement steps would include:
o Replenishment of funding and personnel for public health functions.
o Promotion of improved quality of care in hospitals and other health-
care facilities through improved oversight, including gathering, analyz-
ing and publicly reporting on performance benchmarks.
o Consideration of a plan to reorganize the Health Department to sepa-
rate its public health functions from the management of Medicaid.
o Roll-back or elimination of the “certificate of need” law, to make it eas-
ier to establish or expand health facilities and to promote competition
that responds to consumer demand, improves quality and controls
costs.

ENDNOTES
1
Bill Hammond, “Medicaid’s metamorphosis: How one in three New Yorkers landed in a ‘safety net’
health plan” (Albany, N.Y.: Empire Center for Public Policy, Dec. 7, 2021).
2
Bill Hammond, “New York’s shrinking budget for public health deserves more attention (blog post)”
(Albany, N.Y.: Empire Center for Public Policy, Feb. 24, 2021).
3
Bill Hammond, “New York’s health insurance affordability problem gets worse (blog post)” (Albany,
N.Y.: Empire Center for Public Policy, July 27, 2022).
4
Bill Hammond, “New York’s hospital industry ranks near the bottom of two quality report cards (blog
post)” (Albany, N.Y.: Empire Center for Public Policy, May 3, 2021).
5
Matthew D. Mitchell and Anne Philpot, “The state of certificate-of-need laws in 2020” (Arlington, Va.:
The Mercatus Center at George Mason University, Feb. 19, 2021).
6
Author’s analysis of figures from the New York State Division of the Budget.
7
Author’s analysis of figures from the U.S. Centers for Medicare & Medicaid Services.
8
“Percentage of people in poverty by state using 2- and 3-year averages: 2017-2018 and 2019-2020
(table)” (Washington: U.S. Census Bureau, 2021).
9
“States ranked by percent of population 65 or older, 2020 (table)” (Washington: Population Refer-
ence Bureau, 2021).
10
“Percentage of people with a disability as of 2020, by state (table)” (Washington: U.S. Census Bu-
reau, 2022).
11
Op. cit., Hammond, “Medicaid’s metamorphosis.”
12
Enrollment figures from the New York State Department of Health.
13
“Chapter 3: Annual Analysis of Disproportionate Share Hospital Allotments to the States” (Washing-
ton: Medicaid and CHIP Payment and Access Commission, 2022), table 3A-1.
14
“Medicaid Fraud Control Units: Investigation and Prosecution of Fraud and Beneficiary Abuse in
Medicaid Personal Care Services” (Washington: U.S. Department of Health and Human Services Of-
fice of Inspector General, December 2017).
15
Assembly bill no. 7889A of 2022.
16
Bill Hammond and Chris Pope, “The Impact of Single-Payer on New York Hospitals” (Albany and
New York: Empire Center for Public Policy and Manhattan Institute, November 2018).
17
“Physician Acceptance of New Medicaid Patients: Findings from the National Electronic Health Rec-
ords Survey” (Washington: Medicaid and CHIP Payment and Advisory Commission, June 2021).
18
“2015 Open Enrollment Report” (Albany, N.Y.: New York State of Health, July 2015).
19
Figures from the U.S. Census Bureau’s Small Area Health Insurance Estimates.
20
Bill Hammond, “The Essential Plan’s surplus balloons to $8 billion, with no fix in sight (blog post)”
(Albany, N.Y.: Empire Center for Public Policy, Sept. 8, 2022).
21
“Health Insurance Coverage Update: Impact of ARPA Subsidies” (Albany, N.Y.: New York State of
Health, July 2022).
22
Op. cit., Hammond, “New York’s health insurance affordability problem gets worse.”
23
New York State Division of the Budget.
24
Bill Hammond, “Hooked on HCRA: New York’s 24-year health tax habit” (Albany, N.Y.: Empire
Center for Public Policy, March 11, 2020).
25
This account of Governor Cuomo’s Medicaid redesign is adapted from Bill Hammond, “Busting the
cap: Why New York is losing control of its Medicaid spending again” (Albany, N.Y.: Empire Center
for Public Policy, Oct. 9, 2019).
26
Ibid.
27
Bill Hammond, “The cost of cures: analyzing the surge in New York’s Medicaid drug spending” (Al-
bany, N.Y.: Empire Center for Public Policy, April 10, 2018).
28
New York State Division of the Budget.
29
Bill Hammond, “A Medicaid benefit doubles in 4 years (blog post)” (Albany, N.Y.: Empire Center
for Public Policy, Feb. 11, 2020)).
30
Bill Hammond, “Following the money (blog post)” (Albany, N.Y.: Empire Center for Public Policy,
Jan. 21, 2019). See also J. David Goodman, “After Hospitals’ Donation to New York Democrats, a
$140 Million Payout” (New York: The New York Times, Oct. 3, 2019).

THE NEXT NEW YORK
58
31
Ibid.
32
Bill Hammond, “Cuomo’s self-inflicted crisis” (Albany, N.Y.: Empire Center for Public Policy, Nov.
22, 2019).
33
Author’s analysis of figures from the New York State Division of the Budget.
34
Bill Hammond, “Answers needed on Governor Hochul’s health-care budget (blog post)” (Albany,
N.Y.: Empire Center for Public Policy, Jan. 24, 2022).
35
New York State Division of the Budget.
36
Ibid.
5.
Addressing Mental Health
By Stephen Eide
High-profile tragedies linked to serious mental illness, such as the May mass
shooting in Buffalo and subway platform shovings in New York City, have
prompted mounting concern about the effectiveness and adequacy of New York
State’s mental health system. Media coverage of crimes committed by what police
sometimes term “EDPs” (emotionally disturbed persons), as well as the growing
number of homeless people with apparent psychiatric issues, have highlighted the
question of whether New York’s mental health system has sufficient capacity to
meet the demand for crisis care.
1
New York City Mayor Eric Adams, as part of
his broader pushes to reduce crime and subway disorder,
2
has called for more
state action on mental health.
3
New York’s mental health system consists of a sprawling network of benefit
programs and service providers, with city and county governments, community
healthcare and hospital systems, nonprofits, and other private organizations play-
ing important roles. But no one entity has more responsibility for this system than
state government. Thus, to the extent that public dissatisfaction with mental
health policy persists and increases, in New York City and elsewhere, the onus
ultimately is on Albany to do something about it.
The leading goal of mental health policy should be providing effective treat-
ment to people with mental disorders—especially those with serious mental ill-
ness.
Though it is not technically a diagnosis-based category, most people with seri-
ous mental illness have schizophrenia, bipolar disorder, or major depressive dis-
order. Only 4 to 5 percent of the general adult population falls into this category,
but according to state Office of Mental Health (OMH) data, they represent most
users of New York’s public mental healthcare system. New York State’s public
mental health system—meaning programs either funded or authorized by the
OMH—serves about 900,000 individuals annually. The vast majority (86 percent)
of those served have a serious mental illness.
4
The seriously mentally ill also drive
most of the demand for system reform, such as through their involvement in high
profile tragedies.
Public mental healthcare systems, to be effective, require many “inputs” such
as public investment and an adequate supply of mental health professionals to
provide treatment. On input measures, New York’s mental health system tends
to look strong. In terms of outcomes, New York’s mental health system looks
less impressive.
THE NEXT NEW YORK
60
THE STATUS QUO
One reason why people who need treatment don’t get it is their inability to
access a provider, such as a therapist or psychiatrist. In the broader mental health
debate, access to providers is now a top concern. The federal government deems
mental health one of three official “Health Workforce Shortage Areas.”
5
Increas-
ing spending on compensation for mental health workers, as part of a broader
initiative to “Rebuild Our Healthcare Economy,” was the top mental health pri-
ority highlighted by Governor Hochul in her January 2022 State of State speech
and FY 2023 Executive Budget.
6
In fact, ranked against other states, New York boasts an above average con-
centration of mental health professionals.
7
In terms of psychiatrists—the profes-
sion of greatest relevance to untreated serious mental illness—the New York City
metropolitan area ranks, by some measures, first in the nation.
8
New York County
(Manhattan) has more psychiatrists than any other county in the nation, whereas
over half of counties in the U.S. don’t have one psychiatrist.
9
The state as a whole
ranks second in psychiatrist concentration, after California.
10
However, the concentration of mental health professionals is not evenly dis-
tributed throughout the state. The number of mental health “providers” per
100,000 residents ranges from over 900 in the borough of Manhattan to less than
100 in the case of Greene, Montgomery, Herkimer, Hamilton, and Orleans coun-
ties.
11
However, political pressure to spend more on compensation for the mental
health workforce, coming from advocates and legislators, is, if anything, greater
in New York City than elsewhere in the state.
12
Total Spending and Capacity
In a 2017 federal analysis of state mental health agency spending, New York
ranked second in absolute terms and fifth on a per capita basis.
13
In fiscal 2022,
state spending on the OMH’s budget was about $3.4 billion.
14
That figure does
not account for expenditures made through other programs, such as Medicaid,
and expenditures at the city and county level. The state Medicaid program spent
$2.6 billion on mental health in 2020.
15
The “mental hygiene” portion of the New
York City Department of Health’s budget last year was $680 million.
16
In addition to spending and workforce, inpatient capacity is another mental
health metric where New York has, in recent years, looked more robust than other
states. But whereas state officials have been working to increase spending and the
number of trained professionals, they have been working to reduce use of inpatient
psychiatric services.
Hospital-based psychiatric care can be delivered through specialized hospitals
or through general hospitals. Traditionally, New York’s public mental health sys-
tem consisted almost exclusively of specialized hospitals run by state government.
These “asylums” or “mental institutions” were, at their mid-1950s peak, host to
over 90,000 beds. Since then, state government has shifted away from hospital-
based care in general and also shifted hospital-based care from specialized hospi-
tals to acute care general hospitals.
Renewing and Reforming the Empire State
61
State-run institutions, now known as “psychiatric centers,” are host to a total
2,000 adult beds and another 1,000 beds for forensic patients (such as those ruled
mentally incompetent to stand trial on criminal charges) and children.
17
Acute care
(“Article 28”) general hospitals are host to about 4,500 adult beds. There are about
150 inpatient psychiatric programs statewide, about two-thirds of which operate
out of a general hospital.
18
Of the roughly 900,000 total clients served by the state
mental health system (“organizations and programs licensed, funded and/or op-
erated by OMH”) in 2022, only about 70,000 of them used inpatient programs.
19
During the 2010s, state officials made deliberate pushes to reduce beds in both
state psychiatric centers and acute care general hospitals. State psychiatric center
bed reductions were driven by the “Transformation Plan” for the OMH, launched
in 2014. Cuomo administration officials criticized New York’s “disproportion-
ately large” “inpatient footprint” and the harm done by “costly” and “unneces-
sary” spending on hospital-based programs.
20
From 2014 through mid-2022, New
York State has lost over 600 beds in adult non-forensic psychiatric centers.
21
As
recently as the FY22 budget cycle, the last of the Cuomo era, 200 state hospital
beds were cut,
22
justified as part of an urgent need to “right size” the system,
23
and
policymakers seriously considered shutting down one facility, the Rockland’s
Children Psychiatric Center.
24
Reductions in psychiatric beds in acute care general hospitals were brought
about through changes to New York’s Medicaid program. Though Medicaid gen-
erally cannot be used for care for adults in specialized psychiatric centers, it is the
chief funding source for psychiatric services in acute care general hospitals.
25
In
2010, the state health department argued that Medicaid-funded general hospitals
had “[n]o incentives for length of stay reduction” when it came to psychiatric
care.
26
Accordingly, state government restructured Medicaid reimbursement to
reduce the daily rate the longer that someone stayed hospitalized.
27
This change
has been criticized for incentivizing hospitals to release patients regardless of their
clinical needs and to eliminate inpatient services altogether.
28
Inpatient care is one
of the least-profitable services a hospital can offer.
29
According to the New York
State Nurses Association, in 2018, psychiatric care generated $88,000 “net patient
revenue” per bed for hospitals whereas the average figure across all beds was $1.6
million.
30
Psychiatric beds converted for COVID overflow, it was widely feared in 2020
and 2021, might not be brought back at all.
31
To allay those fears, Governor
Hochul authorized an increase in the Medicaid reimbursement rate to incentivize
more provision of inpatient psychiatric care by private hospital systems.
32
Pressure for deeper bed cuts in psychiatric centers and outright hospital clo-
sures have recently eased somewhat, particularly with respect to facilities serving
children and teenagers.
33
The Western New York Children’s Psychiatric Center,
another facility threatened with closure under the Cuomo administration
34
(with
support from then-Lieutenant Governor Hochul
35
), is now receiving $55 million
in upgrades.
36
In early October, the Hochul administration announced that it would pursue a
waiver from the IMD Exclusion to authorize Medicaid funding for state-run spe-
cialized psychiatric hospitals.
37
The waiver proposal argues that the increased
Medicaid funds will help continue the previous Cuomo-era efforts to “aid in the
THE NEXT NEW YORK
62
state’s efforts to continue to transform the behavioral health service system.” That
will mean “transforming selected (pilot site) state-run psychiatric hospitals, facili-
ties, and campuses from long-term care institutions to community-based en-
hanced service delivery systems” towards the goal of “reducing the statewide av-
erage length of stay.”
38
In general, the administration remained supportive of min-
imizing the footprint of state-run specialized psychiatric hospitals.
39
The standard promise of cutting inpatient beds has always been better care at
a lower cost. But, during the 2010s, that promise was not fulfilled in New York.
Between 2015 and 2019, statewide, the average daily adult census for all inpatient
facilities declined from 6,894 to 6,111. In the New York City Region, it declined
from 3,676 to 3,135.
40
Those reductions coincided with a rise in mental health-
related costs and pressures in other systems, such as homeless services, police
departments, and corrections.
41
Insurance
Debate over expanding access to treatment, in mental health, sometimes cen-
ters around insurance, another area where “on paper,” New York looks strong.
New York has the eighth-lowest rate of uninsured in the nation
42
and its Medicaid
program is the most expensive in the nation on a per capita basis.
43
In its most
recent annual rankings, which examine states’ prevalence rates of mental illness
and rates of access to mental healthcare, Mental Health America ranks New York
fifth overall.
44
New York has one of the lowest rates of “Adults With [any mental
illness] Who Are Uninsured.”
Mental health advocates, in addition to promoting expanded access to health
insurance, have emphasized tightening regulations on insurers, to require them to
provide more mental health benefits. “Parity” regulations exist at both the federal
(“Mental Health Parity and Addiction Equity Act,” 2008) and state (“Timothy’s
Law,” 2006) levels. New York has recently strengthened reporting requirements
for parity (“Mental Health and Substance Use Disorder Parity Reporting Act,”
2018) and parity has also been a focus of enforcement actions taken by the state
Attorney General.
45
Involuntary Care
Seriously mentally ill people sometimes decline to accept or submit to treat-
ment that would benefit them. They do so for a few reasons, including a distaste
for medication’s side effects and/or failure to accept that they have a mental ill-
ness (“lack of insight” or “anosognosia”). In such cases, involuntary treatment
can become necessary.
Committing someone to a hospital, for their benefit but against their will, is
the best-known form of involuntary treatment. New York State has one of the
highest inpatient civil commitment standards in the nation.
46
It’s also possible to pursue involuntary treatment in an outpatient context.
Kendra’s Law is a state program, administered by local health authorities, that
allows courts to order treatment for seriously mentally ill individuals.
47
Named
after Kendra Webdale—a young woman killed when she was pushed into the path
Renewing and Reforming the Empire State
63
of a subway train by a schizophrenic man who was off his meds—the law was
enacted in 1999 with support from families of individuals with the most serious
mental illnesses as a way to help their loved ones while simultaneously keeping
society safer.
48
To be eligible for court-ordered involuntary outpatient treatment,
someone must have a record of non-compliance with treatment that has led to a
recent history of psychiatric hospitalization, violence and/or incarceration.
49
Guardianship (also sometimes referred to as “conservatorship”) is another im-
portant intervention that relies on the involvement of courts. With guardianship,
courts transfer authority over life decisions, such as pertaining to personal fi-
nances, from a seriously mentally ill individual to a third party.
50
Outcomes
Despite New York’s high spending, concentration of expertise, and robust in-
surance programs, mental health outcomes in the Empire State are not impres-
sive, particularly when it comes to the seriously mentally ill. Two important out-
comes are incarceration and homelessness. If one standard of effectiveness in
mental health is keeping the seriously mentally ill out of homelessness and reduc-
ing their involvement with the criminal justice system, New York’s mental health
system performs no better than the much more poorly funded and less sophisti-
cated systems found in other states.
In the state prisons, 25 percent of inmates have some sort of mental disorder.
51
In New York City jails, 17 percent have a serious mental illness.
52
These figures
are comparable to other states.
53
New York City’s jail system is host to over 1,000
inmates with a serious mental illness.
54
No hospital in the state has a patient census
of over 340.
55
Statewide, homeless adults are estimated to be 25 percent severely
mentally ill; that figure is also 25 percent in New York City and nationwide.
56
MOVING FORWARD
To cope with the quality of life and public safety challenges posed by the seri-
ously mentally ill, and to provide humane and effective treatment of those who
most urgently need it, New York State officials should embrace these priority
goals and principles.
• Fund more inpatient psychiatric beds. It is essential to relieve pressure
on other service systems, reduce hospitals’ fiscal incentives to discharge pa-
tients before clinically appropriate, reduce incentives to avoid admitting
troubled patients in the first place, and reduce waits for beds.
57
Though the
Hochul administration has taken some positive steps to build in-patient ca-
pacity, such as applying for a waiver from the IMD Exclusion and increas-
ing Medicaid reimbursement, it also assigned a priority to reducing “unnec-
essary” spending on state psychiatric hospitals.
58
Inpatient psychiatric ser-
vices can either be publicly-funded and privately provided, or entirely
funded and provided by the public sector. The former model cannot be re-
lied on since private health systems’ commitment to inpatient care is likely
to remain questionable. As of late November, Gotham Gazette reported, only
THE NEXT NEW YORK
64
200 of the more than 1,000 former psychiatric beds repurposed during
COVID had been restored.
59
Thus more focus should be placed on adding
more staffed psychiatric beds within the OMH-run hospitals the state con-
trols. A modest start to expanding the use of state psychiatric center space
was made in October, with the opening of two “Transition to Home
Units.” Comprising 50 total beds, these will be operated out of state hospi-
tals and are dedicated for “individuals aged 18 years or older with severe
mental health illnesses who are experiencing homelessness.”
60
New York operates more traditional state-run mental hospitals than any
state in the nation.
61
That should be viewed less as a problem to be solved
(the Cuomo administration’s view) than as a valuable asset to be preserved
and enhanced. Unfortunately, the metrics needed to estimate the full cost
of an expanded in-patient system are not readily available—but the cost of
continued neglect in this area have become all too apparent.
• Pass Mayor Eric Adams’ “Psychiatric Crisis Care Legislative
Agenda.” In late 2022, New York City’s mayor unveiled a plan to expand
access to involuntary care and make the experience of hospitalization more
effective from a treatment perspective. It clarifies that the state’s civil com-
mitment standard authorizes involuntary hospitalization when someone’s
“basic living needs” are not being met, requires doctors to consider pa-
tients’ past histories before releasing them, and requires hospitals to evalu-
ate all discharges for Kendra’s Law. Most elements of this plan will require
state legislation.
62
• Target workforce investments to areas of greatest need. Increased
spending on mental health should flow primarily to rural areas and to pro-
grams that serve seriously mentally ill adults. However, the Hochul admin-
istration’s planned spending on compensation for mental health workers
leaves unclear whether the money will be spent effectively. How much will
go towards psychiatrists? How much will be targeted towards those regions
outside of New York City that have a more compelling claim to be facing a
shortage of professionals? How much will go towards professionals who
will be serving the seriously mentally ill— those who, without treatment,
are the greatest risk of violence, incarceration, and homelessness? In each
case, if the answer does not boil down to “most of the money,” those in-
vestments will not address the crisis.
• Expand Kendra’s Law. Because of the Kendra’s Law’s success in reduc-
ing homelessness and incarceration for participants in the program, among
other positive outcomes,
63
there is perennial interest in expanding the pro-
gram. As of September, the number of people in Kendra’s Law is up about
20 percent compared with the same time last year, though it’s not clear that
the recent legislation caused the increase.
64
The most promising route to
further expansion lies through identifying more people who meet current
eligibility criteria and who would benefit from the program but are not in it.

Renewing and Reforming the Empire State
65
Over 80 percent of court orders are filed by hospitals, as part of the dis-
charge planning process.
65
Tens of thousands use inpatient services every
year.
66
But statewide, only about 3,500 people are in Kendra’s Law, 1,600 in
New York City.
67
Local governments or the state could exercise more over-
sight over hospitals to ensure that they are identifying the maximum num-
ber of discharged patients who would qualify for Kendra’s Law.
• Increase supervision of the seriously mentally ill. Seriously mentally ill
individuals routinely “fall through the cracks” of the public mental health
system. They stop engaging with a program they had been receiving treat-
ment or services from, decompensate, and wind up homeless or incarcer-
ated. In a community setting, supervision can be provided in multiple ways:
regular attendance at a clubhouse program, supportive housing, a “step-
down” residential program, Kendra’s Law, conservatorship, and probation-
style diversion programs such as mental health courts. The desired intensity
of the supervision will vary, depending on the individual. But in caring for
the seriously mentally ill, there should always a presumption in favor of su-
pervision to reduce the risk of adverse outcomes. At the community level,
separate programs serving the seriously mentally ill should coordinate more
than they do now, such as through formal data-sharing agreements, to
avoid losing track of troubled cases.
68
• Reduce the mental illness burden on other systems. Untreated serious
mental illness continues to burden various agencies such as homeless ser-
vices, police departments, courts, corrections systems, and transit systems.
69
This reality, just as much as any other outcome OMH is tracking, indicates
that the state is not meeting its official goal of “better care, better health
and better lives for those whom we serve at lower costs.”
70
A public mental
health system with more integrity would burden other systems less.
ENDNOTES
1
Abigail Kramer, “Cuomo Set Out to ‘Transform’ Mental Health Care for Kids. Now They Can’t Get
Treatment,” The City, March 28, 2022; Maya Kaufman, “Fatal Neglect; Homeless New Yorkers with
serious mental illness keep falling through the cracks despite billions in spending,” Crain's New York
Business, September 19, 2022.
2
“The Subway Safety Plan,” Office of New York City Mayor Eric Adams, February 18, 2022.
3
“Mayor Adams Delivers Testimony to New York State Senate Finance and Assembly Ways and
Means Committees,” Office of New York City Mayor Eric Adams, February 9, 2022.
4
Source: author analysis of OMH “Patient Characteristics Survey” data
https://omh.ny.gov/omhweb/tableau/pcs.html
5
Source: https://data.hrsa.gov/topics/health-workforce/shortage-areas
6
“Remarks as Prepared: Governor Hochul Delivers 2022 State of the State,” Office of Gov. Kathy
Hochul, January 5, 2022; “Governor Hochul Announces Direct Payments to Healthcare Workers as
Part of $10 Billion Healthcare Plan,” Office of Gov. Kathy Hochul, January 5, 2022; “Governor
Hochul Delivers 2022 State of the State,” Office of Gov. Kathy Hochul, January 5, 2022; “Governor
Hochul Announces Highlights of FY 2023 Budget,” Office of Governor Kathy Hochul, January 18,
2022.

THE NEXT NEW YORK
66
7
“There are approximately 24 behavioral health care professionals for every 10,000 residents in New
York, which is higher than the average in the U.S… Per resident, New York has more psychiatrists, psy-
chologists, and primary care physicians compared to the U.S. average” Hanke Heun-Johnson, Michael
Menchine, Dana Goldman and Seth Seabury, “The Cost of Mental Illness: New York Facts and Fig-
ures,” USC Leonard D. Schaeffer Center for Health Policy & Economics, January 2018, p. 27-8.
8
Source “Metropolitan areas with the highest employment level in Psychiatrists”
https://www.bls.gov/oes/current/oes291223.htm
9
Angela J. Beck et al., “Estimating the Distribution of the U.S. Psychiatric Subspecialist Workforce,”
School of Public Health Behavioral Health Workforce Research Center, University of Michigan, Decem-
ber 2018, p. 6.
10
Source: https://www.bls.gov/oes/current/oes291223.htm
11
Source: author calculation based on
https://www.countyhealthrankings.org/app/new-york/2022/measure/factors/62/data?sort=sc-3
12
“Oversight Hearing - Coordination of the State and City in the Provision of Mental Health Services,”
New York City Council, Committee on Mental Health, Disabilities and Addiction, April 21, 2022.
13
“Funding and Characteristics of Single State Agencies for Substance Abuse Services and State Men-
tal Health Agencies, 2015,” Substance Abuse and Mental Health Services Administration, 2017, Table
18.
14
FY 2023 Executive Budget Briefing Book,” Office of Governor Kathy Hochul, January 18, 2022, p.
131.
15
Source: https://omh.ny.gov/omhweb/tableau/county-profiles.html “Medicaid Utilization; R2 Geo-
graphic Table”
16
“Report to the Committee on Finance and the Committee on Health, and the Committee on Mental
Health, Developmental Disability and Addiction on the Fiscal 2023 Executive Plan and the Fiscal 2023
Executive Capital Commitment Plan: Department of Health and Mental Hygiene,” New York City Coun-
cil Finance Division, May 18, 2022, p. 5.
17
“May 2022 Monthly Report OMH Facility Performance Metrics and Community Service Invest-
ments,” New York State Office of Mental Health.
18
“Interim Report to the Statewide Comprehensive Plan” “2017 Interim Report to the Statewide Com-
prehensive Plan,” New York State Office of Mental Health, p. 16.
19
Source: author analysis of OMH “Patient Characteristics Survey” data
https://omh.ny.gov/omhweb/tableau/pcs.html
20
“OMH Regional Centers of Excellence: Today begins a new day in New York’s behavioral health
system,” New York Office of Mental Health, July 2013, p. 7ff. ; “Testimony of Ann Marie T. Sullivan,
M.D., Commissioner of the Office of Mental Health,” Joint Legislative Public Hearing on 2015-2016
Executive Budget Proposal Mental Hygiene, February 27, 2015; “A Plan to Transform the Empire
State’s Medicaid Program Better Care, Better Health, Lower Costs; Multi-Year Action Plan,” New York
State Department of Health, September 12, 2016, p. 3 and 13; “Transformation Plan: 2016-17 End of
Year Report,” New York State Office of Mental Health, February 1, 2017, p. 2-3; “2017 Interim Re-
port to the Statewide Comprehensive Plan,” New York State Office of Mental Health, p. 43-44.
21
Stephen Eide, “Systems Under Strain: Deinstitutionalization in New York State and City,” Manhattan
Institute, November 2018, p. 7; “May 2022 Monthly Report OMH Facility Performance Metrics and
Community Service Investments,” New York State Office of Mental Health.
22
Camalot Todd, “NY budget’s impact on mental, behavioral health in the state,” Spectrum News,
April 14, 2021.
23
“Testimony of The NYS Office of Mental Health to NYS Assembly & NYS Senate Fiscal Committees,”
New York State Office of Mental Health, February 5, 2021.
24
Kate Mostaccio, “PEF, CSEA members joined by state legislators, town officials to protest closure of
Rockland Children’s Psychiatric Center,” The Communicator (Public Employees Federation newsletter),
March 2021.
25
New York State Nurses Association, “A Crisis in Inpatient Psychiatric Services in New York State
Hospitals,” August 2020, p. 9.
26
“Inpatient Psychiatric Reimbursement Reform,” New York State Department of Health, September
13, 2010.
27
New York State Nurses Association, “A Crisis in Inpatient Psychiatric Services in New York State
Hospitals,” August 2020.
28
New York State Nurses Association, “A Crisis in Inpatient Psychiatric Services in New York State
Hospitals,” August 2020, p. 9-11; “Improving Care Coordination for Homeless Individuals with Severe
Mental Illness in NYC,” Bronxworks and Center for Urban Community Services, February 2022, p. 8;
Barbara Caress and James Parrott, “On Restructuring the NYC Health + Hospitals Corporation

Renewing and Reforming the Empire State
67
Preserving and Expanding Access to Care for All New Yorkers,” New York State Nurses Association,
October 2017; “Are New York City’s Public Hospitals Becoming the Main Provider of Inpatient Ser-
vices for the Mentally Ill?” Independent Budget Office, July 2017; Bruce Golding, “Lawmakers rally
over planned closure of psychiatric ward,” New York Post, April 2, 2018.
29
Jill R. Horwitz et al., “Research Note: Relative Profitability of Acute Care Hospital Services (2d Edi-
tion),” UCLA School of Law, Public Law Research Paper No. 22-13, (March 29, 2022).
30
New York State Nurses Association, “A Crisis in Inpatient Psychiatric Services in New York State
Hospitals,” August 2020, p. 12.
31
Shalini Ramachandran, “A Hidden Cost of Covid: Shrinking Mental Health Services,” Wall Street
Journal, October 9, 2020; New York State Nurses Association, “A Crisis in Inpatient Psychiatric Ser-
vices in New York State Hospitals,” August 2020.
32
“Governor Hochul Announces Major Investments to Improve Psychiatric Support for Those in Crisis,”
Office of Governor Kathy Hochul, February 18, 2022.
33
Rachel Silberstein, “Nowhere to go: As psychiatric beds disappear, troubled teens fill ERs,” Albany
Times Union, May 17, 2022.
34
“Group calls for investigation into Cuomo's decision to close the CPC,” Spectrum News, April 3,
2018; “Cuomo vetoes children's psych center,” wgrz.com, November 30, 2017.
35
Michael Mroziak, “Hochul defends governor's plan to close WNY Children's Psych Center,”
wbfo.org, March 30, 2017.
36
“NYS Office of Mental Health Breaks Ground on Major Renovations at Western NY Children’s Psy-
chiatric Center,” Office of Mental Health, August 2, 2022.
37
“During Mental Health Week, Senator Hoylman, Assembly Member Gottfried, Council Member
Bottcher Hail NY’s Application To Unlock Millions In Federal Dollars For Mental Health,” Office of
State Sen. Brad Hoylman, October 5, 2022; “Public Notice: Department of Health IMD Transformation
Demonstration Program,” New York State Register, October 5, 2022, p. 91-94; “Draft Amendment Re-
quest; New York State Medicaid Redesign Team (MRT) Waiver 1115 Research and Demonstration
Waiver #11-W-00114/2; IMD Transformation Demonstration Program,” New York State Department
of Health, Office of Health Insurance Programs, October 5, 2022.
38
“Draft Amendment Request; New York State Medicaid Redesign Team (MRT) Waiver 1115 Re-
search and Demonstration Waiver #11-W-00114/2; IMD Transformation Demonstration Program,”
New York State Department of Health, Office of Health Insurance Programs, October 5, 2022, p. 5.
39
“FY 2023 Executive Budget Briefing Book,” Office of Governor Kathy Hochul, January 18, 2022, p.
128.
40
Source: author analysis based on https://omh.ny.gov/omhweb/tableau/county-profiles.html 2020 is
the most recent year for which data were available, but that was affected by COVID.
41
Stephen Eide, “Systems Under Strain: Deinstitutionalization in New York State and City,” Manhattan
Institute, November 2018.
42
“Medicaid: Enrollment Growth, COVID-19 and the Future,” Office of the New York State Comptrol-
ler, December 2021.
43
Bill Hammond, “New York Has Widened Its Lead in Per-Capita Spending on Medicaid,” empire-
center.org, July 31, 2020.
44
M. Reinert et al, “The State of Mental Health in America 2022,” Mental Health America, October
2021; https://www.mhanational.org/issues/2022/ranking-states.
45
“Mental Health Parity: Enforcement by the New York State Office of the Attorney General,” New
York State Office of the Attorney General, May 2018; Jessica Kirby and Sean Slone, “Mental Health
Insurance Parity: State Legislative and Enforcement Activities,” The Council of State Governments, Sep-
tember 2021, p. 11.
46
Lisa Dailey et al., “Grading the States: An Analysis of U.S. Psychiatric Treatment Laws,” Treatment
Advocacy Center, September 2020, p. 32.
47
New York Mental Hygiene Law § 9.60
48
See Kendra’s Law overview at at: https://mentalillnesspolicy.org/kendras-law/kendras-law-over-
view.htmlhttps://mentalillnesspolicy.org/kendras-law/kendras-law-overview.html
49
Source: https://omh.ny.gov/omhweb/kendra_web/khome.htm
50
Carolyn Reinach Wolf “What to Know About Conservatorships and Mental Illness,” Psychology To-
day, April 19, 2021.
51
“Under Custody Report: Profile of Under Custody Population As of January 1, 2021,” New York
State Department of Corrections and Community Supervision.
52
“Mayor’s Management Report: Preliminary Fiscal 2022,” Mayor’s Office of Operations, February
2022, p. 46; see, more generally, Stephen Eide, “Crime and Mental Illness in New York City: Framing
the Challenge for the New Mayor,” Manhattan Institute, February 17, 2022.

THE NEXT NEW YORK
68
53
Jennifer Bronson and Marcus Berzofsky, “Indicators of Mental Health Problems Reported by Prison-
ers and Jail Inmates, 2011-12,” U.S. Dept. of Justice, Office of Justice Programs, Bureau of Justice Sta-
tistics, June 2017.
54
“Local Law 59: Report for Week of July 25, 2022 - July 31, 2022,” New York City Health + Hospi-
tals, Correctional Health Services.
55
“May 2022 Monthly Report OMH Facility Performance Metrics and Community Service Invest-
ments,” New York State Office of Mental Health.
56
“HUD 2020 Continuum of Care Homeless Assistance Programs Homeless Populations and Subpopu-
lations: NY-600 New York City CoC,” U.S. Department of Housing and Urban Development, Decem-
ber 15, 2020; “HUD 2020 Continuum of Care Homeless Assistance Programs Homeless Populations
and Subpopulations: New York,” U.S. Department of Housing and Urban Development, December 15,
2020; “HUD 2020 Continuum of Care Homeless Assistance Programs Homeless Populations and Sub-
populations: Full Summary Report (All States, Territories, Puerto Rico and District of Columbia),” U.S.
Department of Housing and Urban Development, December 15, 2020.
57
“Improving Care Coordination for Homeless Individuals with Severe Mental Illness in NYC,” Bronx-
works and Center for Urban Community Services, February 2022, p. 4 and 15; Maya Kaufman, “Fatal
Neglect; Homeless New Yorkers with serious mental illness keep falling through the cracks despite bil-
lions in spending,” Crain's New York Business, September 19, 2022.
58
“FY 2023 Executive Budget Briefing Book,” Office of Governor Kathy Hochul, January 18, 2022, p.
128.
59
Ethan Geringer-Sameth, “Despite State Budget Funding, Little Progress Bringing Psychiatric Beds
Back Into Service,” Gotham Gazette, November 28, 2022.
60
“Mayor Adams and Governor Hochul Announce Major Actions to Keep Subways Safe and Address
Transit Crime, Building on Ongoing State and City Collaboration,” Office of the Mayor, October 22,
2022.
61
“National Mental Health Services Survey (N-MHSS): 2020 Data on Mental Health Treatment Facili-
ties,” Substance Abuse and Mental Health Services Administration, 2021, Tables 4.2a and 4.4a; Doris
A. Fuller et al., “Going, Going, Gone: Trends and Consequences of Eliminating State Psychiatric Beds,
2016,” Treatment Advocacy Center, June 2016.
62
“Mayor Adams Announces Plan to Provide Care for Individuals Suffering From Untreated Severe
Mental Illness Across NYC,” Office of the Mayor, November 29, 2022
63
Marvin S. Swartz et al., “New York State Assisted Outpatient Treatment Program Evaluation,” NYS
Office of Mental Health, June 30, 2009; Stephen Eide, “Assisted Outpatient Treatment in New York
State: The Case for Making Kendra's Law Permanent,” Manhattan Institute, April 2017.
64
Ethan Geringer-Sameth, “What’s Behind the Increased Use of Kendra’s Law in New York City?,” Go-
tham Gazette, September 27, 2022.
65
“Improving Care Coordination for Homeless Individuals with Severe Mental Illness in NYC,” Bronx-
works and Center for Urban Community Services, February 2022, p. 10.
66
“Adult Psychiatric Hospitalizations in New York City,” New York City Department of Health and
Mental Hygiene, June 2016; https://omh.ny.gov/omhweb/tableau/pcs.html; “R3. Trends in Clinical
and Functioning Characteristics; Program Category: Inpatient”
67
Source: https://omh.ny.gov/omhweb/kendra_web/khome.htm
68
Stephen Eide and Carolyn D. Gorman, “The Continuum of Care: A Vision for Mental Health Re-
form,” Manhattan Institute, September 15, 2022
69
Stephen Eide, “Systems Under Strain: Deinstitutionalization in New York State and City,” Manhattan
Institute, November 2018.
70
“2017 Interim Report to the Statewide Comprehensive Plan,” New York State Office of Mental
Health, p. iii.
6.
Heading off New York’s
Home-Made Energy Crisis
By James E. Hanley
Within the next 10 years, New York will confront an increasingly serious en-
ergy supply problem of its own making. A series of policy initiatives culminating
in 2019’s Climate Leadership and Community Protection Act (CLCPA) have
committed the state to an unrealistic goal of 70 percent renewable electricity by
2030 and zero-emissions electricity generation by 2040. Reliable sources of fossil-
fuel powered electricity are scheduled to be taken off-line faster than new reliable
sources are brought on-line, pointing towards a tipping point where demand for
electricity outstrips supply. This creates an added risk of blackouts that will be
costly in both economic and human terms.
More than any other state aside from California, New York’s energy sector is
driven by the goal of transitioning to 100 percent greenhouse gas emissions-free
electricity. The movement toward clean energy began under Governor George
Pataki when the Public Service Commission (PSC) created Renewable Portfolio
Standards, a utility bill surcharge used to fund renewable energy projects. Then,
under Governor David Paterson the state became a founding member of the Re-
gional Greenhouse Gas Initiative, a CO2 emissions reduction and trading consor-
tium of 13 northeastern and mid-Atlantic states.
Governor Andrew Cuomo expanded the state’s efforts to promote renewable
energy via the NY-Sun program, which subsidizes residential, commercial, and
industrial solar installations. This was later incorporated into a policy called “Re-
forming the Energy Vision,” which sought to reduce greenhouse gas emissions
by 80 percent by 2050. To achieve this goal Cuomo crafted the “50 by 30” con-
cept, which was to have 50 percent of the state’s electricity come from renewable
sources by 2030. Cuomo also directed the PSC to craft a Clean Energy Standard
that combined 50 by 30 with subsidies for unprofitable nuclear power plants via
required utility purchases of Zero-Emission Credits. However, Cuomo also
forced the premature shut-down of the Indian Point nuclear power plant, making
it more difficult to reach the state’s zero-emissions electricity goals.
In 2019 Cuomo signed into law the CLCPA, which requires 70 percent renew-
able electricity generation by 2030 and 100 percent emissions-free electricity by
2040. It also requires 6,000 megawatts of solar energy, 3,000 megawatts of battery
storage, and 9,000 megawatts of offshore wind. In 2022 Governor Hochul ex-
panded the solar energy goal to 10,000 megawatts and the battery storage goal to
6,000 megawatts.
Also in 2019, the Department of Environmental Conservation finalized its
“Peaker Plant” rule, which imposes increasingly strict air-pollution standards on
THE NEXT NEW YORK
70
fossil-fuel plants currently needed to provide extra generating capacity on days
when usage peaks at above-normal levels.
THE STATUS QUO
New York’s energy supply is governed and managed by multiple entities, in-
cluding the Public Service Commission (PSC), the Department of Environmental
Conservation (DEC), the New York State Energy Research and Development
Authority (NYSERDA), the New York Independent System Operator (NYISO)
and the New York State Reliability Council.
The primary agency governing New York power producers and distributors is
the PSC, whose seven members are appointed by the governor and confirmed by
the Senate to six-year terms.
1
The PSC can create policies, approve or deny utility
rate increases, and approve or deny cost recovery for capital projects such as new
power plant or transmission line construction.
The DEC has authority over air quality permits, which all pollutant-emitting
entities are required to obtain. The DEC is headed by a commissioner appointed
by and serving at the pleasure of the governor.
NYSERDA primarily offers technical expertise and funding to increase energy
efficiency and shift to renewable energy. NYSERDA has a 13-member board,
including four ex officio members from other agencies and nine appointed by the
governor and confirmed by the Senate. There are statutory requirements for rep-
resentation of specified interests and areas of expertise.
2
The President and Chief
Executive Officer of NYSERDA is appointed by and serves at the pleasure of the
governor.
NYISO is not a state agency but a not-for-profit corporation which began op-
erating in 1999 when New York shifted to a competitive electricity generation
market. It operates the state’s bulk electricity grid, administers the wholesale elec-
tricity markets, and conducts long-term planning for the state’s electrical infra-
structure. NYISO is subject to regulation by the state Legislature, the Federal En-
ergy Regulatory Commission, and the New York State Reliability Council.
The New York State Reliability Council is also a not-for-profit corporation. To
ensure the reliability of electrical service in New York it develops rules that must
be complied with by NYISO, including reserve capacity requirements that ensure
there is sufficient installed electricity generation capacity to meet peak demand.
The 13-member executive committee is composed of representatives of the
state’s six transmission owners, the wholesale electricity production sector, vari-
ous sets of power purchasers, and four unaffiliated members. The governor and
legislature have no role in selecting members of this commission.
Markets, Participants, Prices, and Major Public Authorities
In the 1990s New York largely shifted from traditional utilities—regulated mo-
nopolies which combined both electricity generation and transmission—to a
competitive market in which transmitting utilities bid competitively for electricity
from independent power producers. This led to the creation of NYISO as the
entity administering the electricity sales, both in day-ahead and real-time markets.
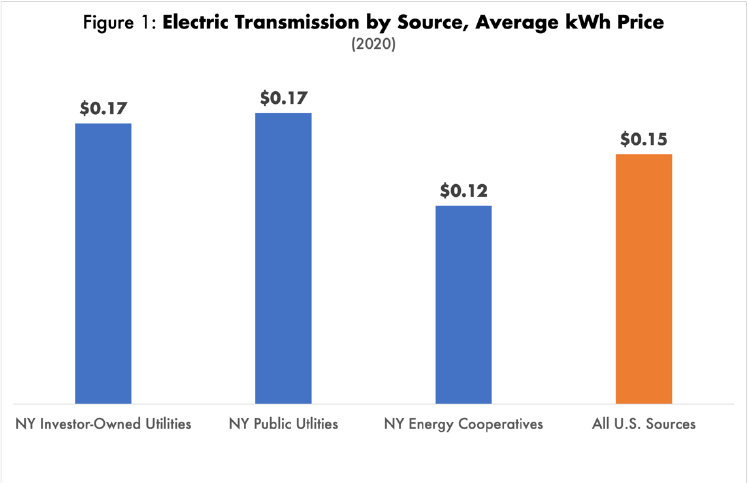
Renewing and Reforming the Empire State
71
These utilities sell electricity to their customers at cost, making their profits on
PSC-approved delivery fees.
The actual transmission providers include 18 investor-owned utilities, 48 pub-
lic power agencies and 5 cooperatives. Of these, cooperatives average the lowest
cost of electricity on a kilowatt-hour basis, followed by investor-owned utilities,
then public power agencies, with only cooperatives on average providing electric-
ity below the national average price (Figure 1). Dozens of independent power
producers sell electricity on the wholesale market to these entities, and in some
cases directly to large industrial energy users.
The two largest municipal power producers in the state are the Long Island
Power Authority (LIPA) and the New York Power Authority (NYPA).
LIPA serves most of Long Island and a portion of Queens. It was created in
response to dissatisfaction with the private utility Long Island Lighting Com-
pany’s high prices and ill-fated decision to construct the never-opened Shoreham
nuclear power plant, which left the company with billions in debt. LIPA issued
over $7.5 billion in bonds to take on that debt
3
and took over ownership of the
company’s transmission lines in 1998.
4
Almost a quarter-century later, LIPA’s
debt has increased to over 9 billion,
5
or over $8,000 per customer.
LIPA’s nine-member Board of Trustees has five members appointed by the
governor, two by the Senate Majority Leader and two by the Assembly Speaker.
It is unique in the country in being a utility that owns transmission lines but does
not operate and maintain them itself, contracting that out to the private firm
PSEG. Currently there is a legislative commission tasked with providing the leg-
islature with “the specific actions, legislation, and timeline necessary to restructure
LIPA into a true publicly owned power authority.”
6
This commission is required
to produce a final report by April 2030.
Source: Energy Information Administration, U.S. Department of Energy
*Larger, full-color chart available at www.NextNewYork.net
*

THE NEXT NEW YORK
72
The largest public power authority in the United States is the New York Power
Authority, a public-benefit corporation established in 1931. NYPA’s seven trus-
tees are appointed by the governor with the approval of the Senate to five-year
terms.
NYPA generates around one-quarter of New York’s electricity.
7
In addition to
selling into the wholesale electricity markets, NYPA sells power to businesses,
not-for-profit organizations, public power systems and government agencies.
This includes selling power to the subways, airports, public schools, and public
housing in New York City. Over 80 percent of its electricity generation comes
from its seven upstate hydropower plants,
8
with the remainder coming from nat-
ural gas or dual-fuel power plants.
9
Currently proposed legislation, the “Build Public Renewables Act,” would re-
quire NYPA to divest itself of its non-renewable energy portfolio and build only
renewable power in the future.
10
While NYPA has invested in nuclear power in
the past (but since divested from it), this proposed legislation would not allow
investment in or purchases from that emissions-free source. NYPA itself has op-
posed this bill, preferring the flexibility to ensure it can meet customer’s needs
reliably. However, under the CLCPA, NYPA, along with all other utilities, will
ultimately be forced to divest itself of any emission-producing generating facilities
and use only clean energy.
New York’s Electricity Grid
New York relies heavily on hydropower and nuclear power and has replaced
all coal-fired plants and most petroleum-fired plants with cleaner burning natural
gas (see Figure 2, below).
11
This significantly reduced the state’s greenhouse gas
emissions (see Figure 3 on next page) and gives New York one of the cleanest
electricity sectors in the country even before current clean air policies begin to
take effect.
*Larger, full-color chart available at www.NextNewYork.net
*

Renewing and Reforming the Empire State
73
Overall, the state is frequently described as “a tale of two grids,” an upstate
grid that is over 90 percent emissions-free electricity and a downstate grid that is
almost 90 percent fossil-fuel electricity.
12
In addition, the two grids are constrained
by limited high-voltage transmission connections between them, but progress is
being made on several major transmission projects, both East-West and North-
South, that will help connect upstate generation with downstate demand.
The state’s clean air improvements were partially reversed by the 2021 shut-
down of the Indian Point nuclear plant in Westchester County and its replacement
with dual-fuel power generation downstate. However, the emissions-free compo-
nent of generating capacity serving the New York City area is supposed to in-
crease with the projected 2025 completion of Champlain Hudson Power Express,
bringing Quebec hydropower via underground and underwater cable from Can-
ada to Queens, and the projected 2027 completion of the Clean Path NY project,
a 175-mile underground transmission line linking upstate wind and solar genera-
tors to the city’s grid. Additionally, offshore wind power—when eventually
built—is supposed to replace fossil-fuel generation in the downstate region.
Clean Energy Policy
New York’s greenhouse gas emissions have dropped substantially due to the
replacement of coal with natural gas, which produces roughly half the carbon di-
oxide of coal. However, this improvement has not been enough to satisfy clean
energy advocates. New York State officials have embraced policies fueling the
push toward an idealized zero-emission electricity future:
o The Regional Greenhouse Gas Initiative (RGGI) —New York is one
of 11 states to have opted into the Initiative, which dates to 2005. Mem-
ber states commit to a regionwide cap on carbon dioxide emissions, de-
clining by 3 percent a year through 2027, with each state assigned its own
*
*Larger, full-color chart available at www.NextNewYork.net
THE NEXT NEW YORK
74
CO2 quota. As part of this process, NYSERDA administers New York
in-state auctions of CO2 permits, directing proceeds toward energy effi-
ciency and renewable energy programs. The effects of RGGI in New
York are hard to assess because, independently of the carbon dioxide cap,
cheaper natural gas replaced coal since the Initiative was launched.
o Renewable and Nuclear Energy Subsidies—Under Governor An-
drew Cuomo, New York established subsidies for renewable energy
through the mandated ratepayer-subsidized purchase of renewable energy
credits, as well as subsidies for nuclear power plants via zero-emission
credits. Utilities must purchase these credits from either NYSERDA, the
renewable or nuclear electricity generators, or third-party intermediaries
13
with costs passed onto utility’s ratepayers. The state, however, forbids
line itemization of these renewable energy credits and zero-emission cred-
its, so ratepayers cannot know just how much they are paying for them.
Solar energy is now alleged to be cheaper than fossil fuels, and onshore
wind nearly equal to fossil fuels in price.
14
If so, the renewable energy
credits are no longer needed.
o Opposition to natural gas pipeline projects—The Cuomo administra-
tion also established a de facto moratorium on natural gas pipeline con-
struction, with the DEC denying permits for multiple pipelines
15
that
would have expanded natural gas delivery capacity. The DEC was over-
ruled by the Federal Energy Regulatory Commission (FERC) and in fed-
eral court on its denial of a permit for the Northern Access pipeline,
16
but
has not yet granted permits,
17
FERC also overruled a permit for the Con-
stitution Pipeline,
18
which has since been canceled by the developer.
19
The
Northeast Supply Enhancement pipeline was also canceled after DEC de-
nied permits.
20
Constraints on the amount of gas that can be delivered
create shortages that are one of the causes of higher winter heating prices
in the state. In some cases, natural gas is intended to replace the use of
fuel oil for electricity production, which would substantially reduce green-
house gas emissions from current levels while maintaining high levels of
grid reliability.
Fracking Ban
Nearly two dozen upstate New York counties, including the entire Southern
Tier region, sit atop rich natural gas deposits in the Marcellus and Utica Shales.
The six-state Marcellus Shale formation is one of the largest in the world, con-
taining trillions of dollars worth of recoverable natural gas, which is already being
extracted by extensive fracking operations in neighboring Pennsylvania, as well as
Ohio and West Virginia.
21
Opponents of fracking have expressed concern about greenhouse gas emis-
sions and groundwater contamination. However, fracking occurs thousands of
feet below aquifers and properly encased well shafts minimize the risk of impact-
ing groundwater. Nonetheless, in December 2014, Governor Andrew Cuomo
cited “significant public health risks” as grounds for imposing a regulatory ban on
the process of injecting specially treated water under high pressure into deep-
Renewing and Reforming the Empire State
75
underground sedimentary rock formations as a means of accessing natural gas
deposits. The ban was codified in April 2020 in legislation packaged with the
state’s FY 2021 budget.
22
Fracking’s potential to ignite broad economic development in New York is
more limited than many industry advocates often imply,
23
because many jobs are
captured by experienced industry workers from other states and because the gas
industry has experienced pronounced boom-bust cycles. However, the potential
wealth effect for leasing landowners is undeniably significant, with inevitable local
spinoff effects.
24
In addition, fracking-related fees and income taxes accruing to
local and state governments could run into the hundreds of millions of dollars a
year.
25
The CLCPA
New York’s flagship energy policy is the Climate Leadership and Community
Protection Act (CLCPA), enacted in 2019.
26
The CLCPA is a “whole of economy”
policy, targeting energy production, transportation, buildings, industrial pro-
cesses, agriculture and forestry, and waste management.
The CLCPA’s overarching goal is an 85 percent reduction in greenhouse gas
emissions and a net-zero state economy by 2050. Intermediate steps on the way
include 6,000 megawatts of installed solar and 185 trillion BTU savings in energy
efficiency by 2025, 70 percent renewable energy production and 3,000 megawatts
of battery storage by 2030, 9,000 megawatts of offshore wind production by 2035
and 100 percent zero-emissions electricity production by 2040.
The CLCPA created a “Climate Action Council” to create a “Scoping Plan” to
help guide legislative and regulatory activity in each of these areas.” This Council
is required to produce a Scoping Plan to guide legislation and rulemaking by the
end of 2022.
The Fundamental Challenge
To say the CLCPA’s goals are ambitious is an understatement, and yet they will
not be adequate to provide the state with sufficient clean energy to ensure the
continuing reliability of the electrical grid.
The pace of building renewables will have to increase dramatically, as can be
seen in Figure 4, below. NYISO estimates that the state needs an additional 20
gigawatts of renewable generation to meet the 70 percent renewables by 2030
goal. But just under 13 gigawatts of new generating capacity has been developed
in the past 20 years, and over the past five years just 2.6 gigawatts of renewable
and fossil-fuel generation have come one line, while 4.6 gigawatts have been de-
activated, for a net loss of 2 gigawatts.
27
In short, the state is currently regressing
from, rather than moving toward, meeting its clean and reliable energy goals.
In addition, the challenge of having enough generating capacity is going to be
badly exacerbated by the DEC’s Peaker Plant Rule. Peaker plants are normally
natural gas or dual-fuel plants that provide dispatchable electricity (on demand).
Some operate daily for a few hours in the afternoon and evening to meet peak

THE NEXT NEW YORK
76
daily demand, while others operate only a few hours per year, during periods of
abnormally high demand generally caused by extremely hot or cold weather.
The express purpose of the rule is to tighten air quality standards over time to
protect the low-income communities where many peaker plants are located. How-
ever, the effect will be to force many plants, particularly older ones, to be shut
down completely as they will not be able to meet the standards. Ultimately, the
goal of 100 percent emissions-free energy will force the shutdown of all peaker
plants—but the risk is that reliable alternative sources won’t be available to fill the
gap. The NYISO predicts that approximately 950 megawatts of capacity will be-
come unavailable beginning in 2023, with 1,600 megawatts unavailable by summer
20025.
28
Due to future increases in electrical demand from electric vehicle charg-
ing and a transition to electric heating, “the New York grid may cross a ‘tipping
point’ in future years such that the transmission system and resources may not
fully serve the demand,” the NYISO warned.
29
The Climate Action Council’s own consultants anticipate that the amount of
offshore wind power needed by 2050 will be between 16,000 and 19,000 mega-
watts, double what is called for in the CLCPA. The first offshore wind turbines
are currently scheduled to come online in 2024, leaving 26 years for complete
buildout. At least 1,500 turbines will be required, necessitating the construction
of more than one offshore turbine per week between 2024 and 2050.
30
And by
2050 the earliest ones will need to be replaced.
The risk is exacerbated by the potential shutdown of three of the state’s re-
maining nuclear reactors—the Fitzpatrick and Nine Mile Point plants near
Oswego, and the Ginna plant northeast of Rochester—scheduled for relicensing
between 2029 and 2035. Many clean energy advocates oppose nuclear power, alt-
hough it is an emissions-free electricity source.
31
But if these three reactors are
not relicensed, another 2,000 megawatts of electricity generation must be found
to replace them.
*
*Larger, full-color chart available at www.NextNewYork.net
Renewing and Reforming the Empire State
77
Finally, and most importantly, except for hydropower, renewable energy
sources pose a fundamental problem for grid reliability. Natural gas can be turned
on and off as needed, and nuclear reactors provide a nearly uninterrupted base-
load power supply, but the same is not true of solar and wind power. Daily de-
mand generally peaks from mid-afternoon to late evening—precisely when solar
power becomes less available, particularly during the winter. Excessively cloudy
and stormy weather radically diminishes the generating capacity of solar panels
even during daytime.
At a minimum, this means wind and solar resources must be substantially over-
built. If a solar array has a potential capacity of 1,000 megawatts, but due to
weather conditions is only producing half that, then it will take 2,000 megawatts
of installed capacity to produce 1,000 megawatts of power. The same is true for
wind; as wind speed drops, it takes more wind turbines to produce the same
amount of electricity that fewer wind turbines would produce at ideal wind speed.
Because of this need to overbuild, renewable energy costs are not as cheap as
advertised. In California, which is New York’s primary competitor in the race to
achieve 100 percent emissions-free electricity, retail electricity prices have in-
creased faster than the average increase across the U.S., and by 2016 had become
50 percent higher than the U.S. average.
32
And states—such as New York—that
passed renewable portfolio standards to promote renewable energy production
had energy prices that on average were 11 percent higher after seven years and 17
percent higher after 12 years.
33
But even overbuilding isn’t sufficient—because the sun doesn’t always shine,
and the wind doesn’t always blow. It doesn’t matter how many gigawatts of in-
stalled solar panels the state has if none of them are receiving sunshine, and it
doesn’t matter how many wind turbines there are if the wind isn’t blowing. At the
extreme, there can be insufficient wind and sun simultaneously, a condition Ger-
mans call a dunkelflaute. While often overbuilding of wind power will enable wind
to make up for low solar output, and vice versa—even if the cost of the necessary
overbuilding is exorbitant—in the case of a dunkelflaute, neither resource can com-
pensate for the other.
This problem is recognized by both the Climate Action Council and NYISO.
The Climate Action Council’s Draft Scoping Plan admits that there are “many
weeks in the year—especially during the winter—in which the contributions from
renewables and existing clean firm resources are not sufficient to meet demand.”
34
And NYISO estimates that under the state’s current plans to shut down fossil
fuel-fired power plants, 10 percent of the needed winter supply by 2040 will be
missing.
35
The Search for Dispatchable Backups
The plan to phase out natural gas and dual-fuel power plants—both highly
reliable source of dispatchable power—threatens to leave New Yorkers at the
mercy of highly unreliable wind and solar. But energy sources that are both dis-
patchable and emissions-free, or DEFRs,
36
are not yet cost-effective or available
at utility scale. In any case, they likely would serve as forms of energy storage
rather than primary sources. This means public and private utilities will need to
THE NEXT NEW YORK
78
build out even more of the unreliable renewable sources to produce the extra
energy that will be stored for when the renewables are unavailable.
Storage can include batteries, as required by the CLCPA, but current battery
technology cannot provide electricity for more than a few hours. Even batteries
storing 100 hours or roughly three days’ worth of energy (the current holy grail
of zero-emissions advocates), may be insufficient during extended periods of low
wind and sun. Chemical battery costs will have to decline from current level by
more than 90 percent before they become cost-competitive with existing forms
of electricity production. Because of limited mining for the required elements, and
the extensive control by China over the refining process of these elements, future
supply-chain issues are expected, which may significantly delay the otherwise-ex-
pected price decreases that come with maturing technologies.
37
Two other prospective dispatchable options are natural gas and hydrogen pro-
duced from renewable sources, although both depend on immature technologies
that currently have very high costs. Renewable natural gas, produced from me-
thane originating primarily in animal waste, would have the advantage of being a
“drop-in” fuel that can directly replace conventionally produced natural gas using
the existing natural gas pipeline system. However, opponents of fossil-fuel based
natural gas also tend to oppose renewable natural gas, preferring to eliminate or
sequester agricultural methane.
Hydrogen can be made from either natural gas or water. Made from natural
gas, it is called “grey hydrogen,” because it releases significant amounts of carbon
dioxide, and is not considered environmentally friendly. The environmentally pre-
ferred method is to produce hydrogen from water, using either renewable energy
(“green” hydrogen) or nuclear energy (“pink” hydrogen). When combusted to
produce electricity or heat, the only waste product is water.
There are two specific difficulties with hydrogen that will be difficult to over-
come. First, as a very small molecule, it is more susceptible to leaking than is
natural gas. Second, it tends to make metals brittle, shortening their lifespan.
38
For
these reasons, the current approach to generating electricity with hydrogen is to
blend it with natural gas. Blends of 5 to 10 percent have been achieved in elec-
tricity generation, with some seeing the potential for blends of up to 30 percent.
39
However, some clean air advocates are opposed to all combustible gases, even
clean hydrogen.
Putting aside high costs, technological hurdles, and political opposition,
whether any dispatchable emission-free resources will be available on the required
scale within just 18 years—meeting the CLCPA’s 2040 deadline for 100 percent
emissions-free electricity—is currently unknowable.
MOVING FORWARD
Energy policy must struggle to balance three factors: reliability, affordability,
and low emissions. The fundamental error in New York policy is to over-empha-
size low emissions over affordability and, especially, reliability. Policy goals are
repeatedly stretched even before the original goals are achieved. The ideal of per-
petually being at the national and international forefront of the clean energy
movement has taken the place of ensuring benefits outweigh costs.
Renewing and Reforming the Empire State
79
The Climate Action Council claims the benefits of the CLCPA do outweigh
the costs. But by the Council’s own accounting, most of the benefits are global,
and the portion of the benefits that accrue to the state are outweighed by the costs
its citizens will pay.
40
Further, if this economy-wide transition effort follows the
general pattern of such state-sponsored megaprojects, the benefits are likely to be
far less than predicted, and the costs multiple times what has initially been
claimed.
41
In short, the costs may be many times more than the benefits.
42
New York produces less than one-half of one percent of global greenhouse
gases, and most greenhouse gas emissions do not directly affect human health.
Energy policy should aim to keep New York on its gradual and steadily lower-
emissions path rather than rushing towards an idealized goal that cannot possibly
be met on the current schedule.
The following reform priorities will protect New Yorkers from the very real
risks of a costly and unreliable electricity supply:
• Scrap the current Climate Leadership and Community Protection
Act. The CLCPA does include an escape clause for fossil-fuel fired plants
and related infrastructure to meet reliability needs, but the conditions are
stringent and to date the DEC has been reluctant to approve such projects.
At a minimum, this escape clause should be strengthened to emphasize that
energy reliability and affordability are of equal importance to emissions re-
ductions. After all, metropolitan New York City area customers already pay
some of the highest utility rates in the country, and in the wake of the pan-
demic, more than one million New York customers statewide were collec-
tively nearly $2 billion in arrears on their energy bills.
43
Reliability is even
more crucial because power outages in extreme weather can kill people by
the hundreds, particularly the poor and elderly.
44
In a related move, the
DEC’s peaker plant rule should be modified to encourage progressively
cleaner emissions while allowing the plants to remain online until suitable
replacement power projects are developed.
• End the de facto natural gas pipeline moratorium. As opposed to all
other currently available technologies, the benefits of natural gas are obvi-
ous: gas is a more reliable, affordable and efficient energy source for elec-
tricity and heating reliability, especially as compared to fuel oil, which re-
mains a heavily relied upon heating fuel in much of the state. The next
DEC Commissioner should approve needed pipelines.
• Repeal the fracking ban. The fracking ban prohibits the beneficial devel-
opment of natural gas fields, constrains the development of property-
owner wealth, and causes local governments, as well as the state, to forgo
hundreds of millions in fees and income tax receipts. And as a geopolitical
matter, in the wake of the Russia-Ukraine war, increased natural gas pro-
duction is a major national strategic priority as well as a goal serving the
best interests of New Yorkers.
THE NEXT NEW YORK
80
• Rethink renewable and zero-emission energy credits. Renewable en-
ergy advocates increasingly boast that solar energy is cheaper than natural
gas and nuclear, and that onshore wind is nearly down to the price of those
resources and expected to be equal to them soon. If that’s true, they should
no longer require subsidies from ratepayers. Subsidies supporting extremely
expensive offshore wind projects should be phased out as soon as possible.
And with the goal of requiring all sources to meet a true market test, zero-
emissions credits for nuclear power plants ideally should be phased out in
the long run. In the short-term, however, as more unreliable wind and solar
sources come online, the credits may be required to keep reliable nuclear
power in place. In a system ultimately free of subsidies, nuclear plants may
yet prove be more cost-effective than solar, wind and other low- and zero-
emission renewables.
• Repeal the post-2035 ban on selling new internal combustion en-
gines. A troubling mandate on its own merits, the forced increase in bat-
tery-electric vehicles will increase the strain on the state’s power grid at a
time when it is facing unprecedented challenges from unreliable renewable
sources of electricity. The market is likely to create a sufficient growth in
electric vehicles to achieve much of the goal of reducing greenhouse gas
emissions from the transportation sector, but for grid reliability purposes,
that growth should not be artificially increased.
• Stop legislation likely to further increase costs and undermine relia-
bility. Among the most potentially damaging bills to have been introduced
in the last two years are the Build Public Renewables Act,
45
requiring
NYPA to prematurely take reliable fossil fuel-fired power plants offline and
invest only in renewable energy, reducing the reliability of the electric grid;
and the All-Electric Building Act,
46
which would prohibit new buildings
from having natural gas hookups for appliances or space heating.
•
Encourage investment in hydrogen, renewable natural gas, and ad-
vanced nuclear power. Recent governors have tended to view all eco-
nomic development incentives largely as a matter of tax breaks and in-
creased taxpayer subsidies for business. In the energy field, however, effec-
tive incentives can be crafted through regulatory reform. The Hochul ad-
ministration effort to position New York as a federally supported hydrogen
research hub should be continued—but beyond that, the state should aim
to create a more welcoming regulatory environment for innovative technol-
ogies. Advanced next-generation nuclear energy, in particular, relying on
small modular reactors, could potentially provide New York with plentiful
safe, reliable, emissions-free electricity.
47
The first experimental reactors are
expected to come online in other states by the end of the decade, and rapid
buildout could come in the two decades after that to help New York meet
its 2050 clean energy goals.
48

Renewing and Reforming the Empire State
81
ENDNOTES
1
By law, no more than four members of thrseven-member PSC can belong to the same political party.
2
New York Public Authorities Law. Title 9, Sec. 1852. https://newyork.public.law/laws/n.y._pub-
lic_authorities_law_section_1852.
3
New York Assembly. 1997. “Shedding Light on the Financial Structure of the LIPA/LILCO Proposal.”
https://nyassembly.gov/Reports/Energy/199709/.
4
“Long Island Power Authority. n.d. “About LIPA.” lipower.org/about-us/.
5
Harrington, Mark. 2022. “As interest on LIPA's debt climbs to $348M, it looks to refinance.” News-
day. June 19. https://www.newsday.com/long-island/politics/lipa-debt-borrowing-refinancing-
sfee2dyj.
6
New York Senate. “Consolidated Laws of New York, Chapter 32, Section 83-N. Legislative Commis-
sion on the Future of the Long Island Power Authority.” https://www.nysenate.gov/legisla-
tion/laws/LEG/83-N.
7
New York Power Authority. n.d. “New York’s Own Resources Generate Nearly 25% of the State’s
Power.” https://www.nypa.gov/power/generation/generation-over-
view#:~:text=Thanks%20largely%20to%20NYPA's%20three,fuels%20and%20their%20re-
lated%20emissions.
8
Ibid.
9
New York Power Authority. n.d. “NYPA Generating Facilities.” https://www.nypa.gov/power/gener-
ation/all-generating-facilities.
10
Assembly Bill A1466D/Senate Bill S6453C.
11
Prohaska, Thomas J. 2020. “New York’s Last Coal-Burning Power Plant Closes on Lake Ontario
Shore.” The Buffalo News. March 30. https://buffalonews.com/business/local/new-yorks-last-coal-
burning-power-plant-closes-on-lake-ontario-shore/article_969bcd79-b3d3-52cd-adb3-
f55ef10f98e5.html.
12
New York Independent System Operator. 2022. Power Trends 2022: The Path to a Reliable
Greener Grid for New York.
13
Girardin, Ken, and Annette Brocks. 2016. “Green Overload: New York’s Ratepayer-Zapping Re-
newable Energy Mandates.” The Empire Center for Public Policy. https://www.empirecenter.org/publi-
cations/green-overload/.
14
International Renewable Energy Agency. 2021. “Majority of New Renewables Undercut Cheapest
Fossil Fuel on Cost.” June 22. https://www.irena.org/newsroom/pressreleases/2021/Jun/Majority-of-
New-Renewables-Undercut-Cheapest-Fossil-Fuel-on-Cost.
15
Moran, Greta. 2021.”How Activists Successfully Shut Down Key Pipeline Projects in New York.”
Grist. January 4. https://grist.org/fix/advocacy/how-activists-shut-down-key-pipeline-projects-new-
york/.
16
Marcellus Drilling News. 2019. “Federal Court Slaps Down NY DEC Rejection of Northern Access
Pipe.” February 6. https://marcellusdrilling.com/2019/02/federal-court-slaps-down-ny-dec-rejection-of-
northern-access-pipe/.
17
Reuters. 2022. “U.S. Gives NFG More Time to Build Northern Access Natgas Pipeline.” June 30.
https://www.reuters.com/business/energy/us-gives-nfg-more-time-to-build-northern-access-natgas-pipe-
line-2022-07-01.
18
Arnold, Chad. 2019. “Feds Clear Way for Constitution Pipeline in New York Over State’s Objec-
tion.” Press Connects. 2019. https://www.pressconnects.com/story/news/local/new-
york/2019/08/29/feds-clear-way-constitution-pipeline-new-york/2150884001/.
19
Blanchard, Scott. 2020. “Constitution Pipeline Project Ends as Builder Cites ‘Diminished’ Return on
Investment. National Public Radio, State Impact Pennsylvania. https://stateimpact.npr.org/pennsylva-
nia/2020/02/25/constitution-pipeline-project-ends-as-builder-cites-diminished-return-on-investment/.
20
Reuters. 2020. “Williams Discontinues New York Pipeline Project After Key Permit Denial.” Pipeline
and Gas Journal. May 18. https://pgjonline.com/news/2020/05-may/williams-discontinues-new-york-
pipeline-project-after-key-permit-denial.
21
King, Hobart M. n.d. “Marcellus Shale – Appalachian Basin Natural Gas Play: A Resource that
Moved from ‘Marginal’ to ‘Spectacular’ as a Result of New Drilling Technology.” Geology.com.
https://geology.com/articles/marcellus-shale.shtml.
22
Chapter 58 of the Laws of 2020, Part WW.
23
Cosgrove, Brendan M., Daniel R. LaFave, Sahan T. M. Dissanayake, and Michael R. Donihue.”
2015. “The Economic Impact of Shale Gas Development: A Natural Experiment Along the New
York/Pennsylvania Border.” Agricultural and Resource Economics Review 44(2): 20-39.

THE NEXT NEW YORK
82
24
Shale Directories. n.d. “Natural Gas Royalties Paid in PA Reach Nearly $10B.”
https://www.shaledirectories.com/blog-1/natural-gas-royalties-paid-in-pa-reach-nearly-10b/.
25
Pennsylvania Public Utility Commission. n.d. “Disbursements and Impact Fees.” https://www.act13-
reporting.puc.pa.gov/Modules/PublicReporting/Overview.aspx.
26
Op cit endnote 16 citation
27
New York Independent System Operator. 2022. “2021-2040 System and Resource Outlook.”
28
New York Independent System Operator. 2022. “Power Trend 2022: The Path to a Reliable Cleaner
Grid for New York.”
29
Ibid.
30
Hanley, James E. 2021. “Green Scheme: The Climate Action Council’s Transition Cost Analysis.” Em-
pire Center for Public Policy. https://www.empirecenter.org/publications/greenscheme/.
31
Nuclear Information and Resource Service. 2020. “Nuclear Doesn’t Help with Climate or Play Well
with Renewables.” Oct. 8. https://www.nirs.org/nuclear-doesnt-help-with-climate-or-play-well-with-re-
newables/.
32
Makovich, Lawrence, and James Richards. 2017. ”Ensuring Resilient and Efficient Electricity Genera-
tion.” IHS Markit. https://www.globalenergyinstitute.org/ensuring-resilient-and-efficient-electricity-gen-
eration.
33
Greenstone, Michael, and Ishan Nath. 2019. Do Renewable Portfolio Standards Deliver?”
https://epic.uchicago.edu/wp-content/uploads/2019/07/Do-Renewable-Portfolio-Standards-De-
liver.pdf.
34
New York State Energy Research and Development Authority, Climate Action Council. “Draft Scop-
ing Plan.” https://climate.ny.gov/-/media/Project/Climate/Files/Draft-Scoping-Plan.pdf.
35
New York Independent System Operator. 2022. “Power Trend 2022: The Path to a Reliable Cleaner
Grid for New York.”
36
New York Independent System Operator. 2022. “2021-2040 System and Resource Outlook.”
37
Kuttner, Robert. 2022. “China Epicenter of the Supply Chain Crisis.” The American Prospect. Febru-
ary 1. https://prospect.org/economy/china-epicenter-of-the-supply-chain-crisis/.
38
California Public Utilities Commission. 2022. “CPUC Issues Independent Study on Injecting Hydrogen
Into Natural Gas Systems.” July 21. https://www.cpuc.ca.gov/news-and-updates/all-news/cpuc-issues-
independent-study-on-injecting-hydrogen-into-natural-gas-sys-
tems#:~:text=The%20Study%E2%80%99s%20findings%20include%3A%201%20Hydro-
gen%20blends%20of,of%20gas%20ignition%20outside%20the%20pipeline.%20More%20items.
39
Rhodes, Joshua D., Thomas Deetjen, F. Todd Davidson, Michael Lewis, and Robert Hebner. n.d.
“Hydrogen Blending in Texas Natural Gas Power Plants at Scale.” University of Texas at Austin.
https://sites.utexas.edu/h2/files/2022/01/TX-H2-Power-Plant-Blending.pdf.
40
Hanley, James E. 2022. “Written Testimony to the Climate Action Council.” The Empire Center for
Public Policy. April 14. https://www.empirecenter.org/publications/james-hanley-written-testimony-to-
the-climate-action-council/.
41
Flyvbjerg, Bent. 2021. “The Iron Law of Megaprojects: Over Budget, Over Time, Under Benefits,
Over and Over Again.” August 5. https://towardsdatascience.com/the-iron-law-of-megaprojects-
18b886590f0b.
42
Hanley, James E. 2021. “Green Scheme: The Climate Action Council’s Transition Cost Analysis.” Em-
pire Center for Public Policy. November 21. https://www.empirecenter.org/publica-
tions/greenscheme/.
43
Office of the New York State Comptroller. 2022. “Distribution of Utility Arrears in New York State.”
July 14. https://www.osc.state.ny.us/reports/distribution-utility-arrears-new-york-state-0.
44
Aldhous, Peter, Stephanie M. Lee, and Zahra Hiriji. 2021. “The Graveyard Doesn’t Lie. Buzzfeed
News. May 26. https://www.buzzfeednews.com/article/peteraldhous/texas-winter-storm-power-out-
age-death-toll.
45
S.6453/A1466-D of 2021-22.
46
S.6843-C/A.8431 of 2021-22.
47
Office of Nuclear Energy. n.d. “Advanced Small Modular Reactors (SMRs).” United States Depart-
ment of Energy. https://www.energy.gov/ne/advanced-small-modular-reactors-smrs.
48
McCarthy, Elizabeth. 2022. “Emerging Small Reactors Projected to Provide 90 GW of Nuclear
Power to US Grid by 2050: NEI Survey.” Utility Dive. August 18. https://www.utili-
tydive.com/news/emerging-small-reactors-projected-to-provide-90-gw-of-nuclear-power-to-
the/629936/#:~:text=The%20push%20for%20carbon%2Dfree,5.
7.
Transportation and Transit:
Back to Basics
By Nicole Gelinas
From Buffalo to Brooklyn, New Yorkers have inherited well-planned, well-
built transportation infrastructure, from New York City’s subway to the state
Thruway. These assets are the backbone of New York’s economy, with mass
transit enabling New York City’s density and the downstate region’s commuting
wealth, and with highways enabling major industry such as manufacturing, farm-
ing, and modern-day research and development.
Yet over the past two decades, New York State has lost its way in managing
these assets. The state has diverted scarce funding to multi-billion-dollar signature
megaprojects at the expense of safeguarding the long-term condition of existing
transportation and transit properties. Even as the state has lost sight of prioritizing
maintenance and repairs, it gets less return on each dollar deployed, due to the
increasing cost of constructing, maintaining, and operating transportation and
transit projects, already higher in New York State than elsewhere in the country
and the developed world.
Beyond re-establishing sound transportation management, New York faces
new challenges. The proliferation of electric vehicles (EVs), encouraged by federal
and state subsidies, presages a long-term decline in fuel-tax revenues, following
years of erosion due to greater fuel efficiency. The persistence of the work-from-
home phenomenon heralds a long-term decline in transit-fare revenues. Lastly, if
the state does not soon either implement a long-delayed congestion-pricing pro-
gram to support the Metropolitan Transportation Authority’s capital-improve-
ment budget, it must find an equivalent source of revenue.
Looking ahead from 2023 to the mid-decade, the governor and state lawmak-
ers should reassert key principles:
o First, major new transportation and transit new-construction projects
should pay for themselves (after federal grant money), if not entirely
through direct user revenues such as tolls or fares, then through bonds
approved by voters and/or through dedicated tax revenues.
o Second, revenues derived from transportation infrastructure should not
pay for non-transportation projects, and vice versa. General state tax rev-
enues should not subsidize large-scale transportation construction, and
transportation-related revenues should not support unrelated projects.
o Third, the state must prioritize repair and maintenance of existing assets
over new construction.
o Fourth, the state must control construction costs, and, in the case of
mass transit, operational costs.
THE NEXT NEW YORK
84
o Fifth and finally, New York’s governor should recognize that the state
eventually must replace fuel-tax revenues. The state should consider a
voluntary pilot to test a vehicle-miles-traveled fee.
THE STATUS QUO
Before the current era, New York’s modern transportation history falls into
three periods. The first, between the turn of the 20th century and the late 1950s,
was a period of major construction, initially of mass-transit projects such as the
New York City subway, and later of limited-access highways such as the Thruway.
Though the city raised municipal bonds to fund subway construction in the early
1900s, the state generally funded other such projects through debt repaid by a mix
of state and federal tax revenues (including, after 1929, the two-cents-a-gallon
state gas tax)
1
and by direct project-derived revenues (such as tolls on the Thru-
way). When the state borrowed money for a large-scale project whose expected
future user fees wouldn’t fully fund its construction, as in the case of the Thruway,
the state secured voter approval for such debt, as its constitution requires.
The second, from the 1960s through the mid-1980s, was a period of relative
inactivity. The state and its cities cancelled several planned highways. The state
neglected mass-transit assets and, to a lesser extent, existing highway assets.
2
The third period dates roughly to the early 1980s, when the state, under Gov-
ernors Hugh Carey and, later, Mario M. Cuomo, formalized a fiscal regime to put
both transit and transportation funding on a long-term sturdy footing.
Dedicated transportation revenues
Starting in 1980, the state Legislature approved a series of dedicated taxes for
the state-controlled Metropolitan Transportation Authority, which runs New
York City’s subway, bus, and commuter-rail networks. The most substantial pack-
age was the “mass transportation operating assistance” bundle of taxes reserved
for the MTA, including a ¼-of-one percent sales tax in the downstate region
served by the authority, a regional franchise-tax surcharge, a transportation and
transmission business tax, and a petroleum-business tax. The taxes were designed
to meet the MTA’s capital-infrastructure and operating-subsidy needs.
As the initial tax package proved insufficient in light of the MTA’s growing
costs, though, the Legislature has approved added taxes and fees roughly every
decade to supplement it. The most recent series of MTA-dedicated revenues in-
clude 2018’s congestion charge on for-hire vehicles within core Manhattan, which
raised more than $300 million in the year after its enactment. This was preceded
in 2009 by the MTA’s biggest new revenue source since the 1980s—the payroll-
mobility tax, a 0.34 percent levy on most downstate payrolls, which was generat-
ing $1.6 billion annually by 2019. (See Table 1 on next page.)
Along with new revenues came a requirement for long-term planning. In the
early 1980s, the Legislature directed the MTA to devise five-year, multi-billion-
dollar “capital plans” to prioritize investments in repair, replacement, and, starting
in the 2000s, new construction.

Renewing and Reforming the Empire State
85
In the early 1990s, the state Legislature took a similar approach to highways
and bridges: enacting dedicated taxes to fund transportation infrastructure that
could not pay for its capital costs through toll revenues (Table 2, below). In 1991,
the state created its dedicated highway and bridge trust fund. The goal, as state
comptroller Thomas P. DiNapoli puts it, was to fund “critical transportation in-
frastructure” on a “consistent, reliable basis.” The trust fund takes in revenues
from six taxes, namely the petroleum-business tax, motor-vehicle registration
fees, the motor-fuel tax (now eight cents a gallon), highway and fuel use taxes
(including a mileage fee on trucks), the auto-rental tax, and transportation and
transmission business taxes.
3
Unlike with mass transit, the state Legislature chose not to create a dedicated
tax to support operating costs for highways and bridges. One reason is that oper-
ating costs are much lower, as highway transportation is far less labor-intensive
than mass transit. The state’s Department of Transportation (DOT), for instance,
employs 8,147 full-time employees, and spends just $2 billion in operating costs.
THE NEXT NEW YORK
86
By contrast, the MTA employs nearly 70,000 full-time workers, and, not including
debt service, has a $15.5 billion annual budget.
4
By the turn of the 21
st
century, the state enjoyed dedicated tax streams for con-
struction, repair, and maintenance of mass-transit and highway-transportation as-
sets and enjoyed such streams for mass-transit operating costs, as well.
The dedicated funding stream for mass transit has, in the aggregate, more than
kept up with general cost inflation over the broad time frame. Due to economic
growth (as well as the gradual addition of new dedicated taxes), dedicated taxes
brought in nearly $6 billion annually to the MTA by 2019, the year before the
COVID-19 pandemic hit New York State, compared to $500 million in 1985 (the
equivalent of $1.2 billion in 2019 dollars). In the highway and bridge trust fund,
revenues reached more than $2 billion by 2019, although the taxes have not kept
pace with inflation over the past decade, due to greater fuel efficiency.
5
Distracted driving
Despite these dedicated taxes, the state’s highway and bridge transportation
funding is increasingly strained and must rely on general state revenues for major
capital projects as well as for maintenance and repairs. The state’s transportation
trust fund long ago stopped fulfilling its purpose, to fund transportation repair
and replacement from its dedicated taxes. In recent years, estimated spending has
recently begun to fall short of estimated needs, especially on bridges.
The biggest problem is an overreliance on borrowing not envisioned in the
original legislation. As the state comptroller has noted, a 1993 amendment to state
law allowed for borrowing against the highway and bridge trust fund’s dedicated
revenues, marking “a shift in the state’s transportation capital program from being
a self-funded system … to one that has become substantially debt-financed.”
That is, rather than using the dedicated tax revenues to fund capital projects
on a pay-as-you-go basis, the state borrowed against those future revenues. By
2019, debt service was consuming $1.4 billion annually, or nearly three-quarters
of the highway and bridge’s trust fund’s dedicated-tax revenues.
A smaller problem is that, though the initial plan for the trust fund was for the
money solely to fund large-scale capital projects, the state further amended the
law in 2001 to allow the trust fund to subsidize transportation operating costs,
just as dedicated taxes subsidize such deficits at the MTA. By 2019, the trust fund
was spending nearly $1.3 billion annually on state transportation-related opera-
tions costs, rivaling the amount spent on debt service.
Because payments on debt service and payments for operations now exceed
dedicated-tax revenues, the trust fund must rely on $800 million in annual trans-
fers from the state’s general fund, paid for by general tax revenues.
Because of these strains, the trust fund has not increased its investment in in-
frastructure. Over the past half-decade, the trust fund has spent just $560 million
annually, or fewer than 30 percent of its dedicated tax revenues, on the purpose
for which the trust fund was created: direct capital expenditures. Even as con-
struction-cost inflation has soared, the trust fund’s capital expenditures have re-
mained steady, meaning each dollar buys less capital.

Renewing and Reforming the Empire State
87
Running into potholes
The result is that, despite the existence of the highway and bridge trust fund,
the physical state of highway and bridge infrastructure has not improved much
over the past two decades.
The state’s goal is to maintain pavement conditions on its 42,742 lane miles of
roads between a federally recognized rating of 6.7 and 7.2 on a scale of 1 (very
poor) to 10 (excellent). Though New York has indeed achieved that goal, it has
not significantly improved road conditions in two decades, as shown in Figure 1.
The state has also achieved its goal of keeping structurally deficient bridges below
15 percent of the total 7,700 highway bridges. However, it has improved bridge
conditions slowly, reducing the percentage of structurally deficient bridges from
just under eight percent to just above seven percent over a half-decade.
These ratings may grow worse. Thanks to borrowing against the trust fund and
federal grants under Obama-era stimulus, the state’s highways and roads enjoyed
a decade and a half of robust investments until 2017.
Yet since then, from fiscal years 2018 through 2020, despite a $23.4 billion,
five-year transportation capital plan during that period, the state has failed to
spend enough money to keep up with the estimated amount needed to maintain
highways, roads, and bridges in their current state, as shown in Figures 3 and 4
on the following page. In 2019, the state DOT warned that “to achieve a state of
good repair … in ten years, [the agency] would require approximately $2.5 billion
per year for pavements and bridges from all levels of government, as compared
to the current annual funding level for these assets of $875 million.”
6
The state’s latest, $32.8 billion, five-year transportation capital plan, enacted in
April 2022 as part of FY 2023 state budget
7
, relies disproportionately on borrow-
ing (see Table 3 below). It contemplates $16.5 billion in new transportation-re-
lated debt, nearly all of it issued through public authorities and underwritten by
personal income tax collections—a form of “backdoor borrowing” designed to
avoid the constitutional requirement for voter approval of general obligation debt,
rather than through voter-approved general-obligation debt.

THE NEXT NEW YORK
88
Renewing and Reforming the Empire State
89
The projected debt from the DOT capital plan alone would increase the state’s
outstanding total debt, which was $66.5 billion as of FY 2021, by 25 percent. The
state risks a future in which day-to-day maintenance and repair work falls further
behind as more future resources, both general revenues and dedicated taxes, goes
toward servicing past debt.
The state plans to increase its transportation-related debt even as a key source
of transportation revenue, the motor-fuel tax, has stagnated, thanks to better fuel
efficiency.
Case study: the New York State Thruway
The New York State Thruway is a case study of how New York State has lost
its way. In the fall of 1951, then-Governor Thomas Dewey presented the pro-
posed New York State Thruway Authority as “self-liquidating,” modeled on Rob-
ert Moses’ Triborough Bridge and Tunnel Authority. That is, the toll revenues
the Thruway would produce would fund the costs of both operations and, over
time, the $500 million capital construction cost. Voters approved $500 million in
state-guaranteed debt for the project based on this prospect.
8
Yet as the state began Thruway construction, the cost of the project nearly
doubled, to almost $1 billion, and the Thruway’s revenues fell short.
9
In the mid-
1950s, the Thruway thus had to borrow $472 million in revenue-backed bonds in
addition to its state-guaranteed debt.
10
Nevertheless, the state turned the situation around. By 1969, thanks to toll
increases as well as increased volume, the Thruway was funding itself.
11
By the
early 1980s, the Thruway was taking in $155 million annually, and expected that
it could retire its debt within a decade-and-a-half.
12
By 1996, the Thruway still
“receive[d] no state tax dollars and depend[end] entirely on toll revenues,” even
after an eight-year toll freeze.
13
By the new century, however, the state government was taking advantage of
the Thruway’s self-sufficiency, using it to subsidize non-related costs that should
have been borne by the general New York State budget. In 1992, then-Governor
Mario Cuomo had forced the authority to take on the state’s money-losing canal
network.
14
By 2002, the canals comprised a $39 million operating expense, rising
to $64 million by 2017.
Though forcing the Thruway to subsidize non-Thruway costs was bad policy,
in the mid-2000s, Governors George Pataki, Eliot Spitzer, and David Paterson
did at least allow the nominally independent Thruway enough freedom from pol-
itics to maintain its finances to absorb these non-related costs. In 2005, for exam-
ple, the Thruway raised tolls in different segments by 25 to 35 percent. In 2009
and 2010, the Thruway once again raised tolls, by 10 percent.
Yet toll hikes were not sufficient. “From 2002 through 2011, Thruway-gener-
ated revenues grew by 4.0 percent on average annually, while [annual] expenses
grew by 5.0 percent,” the state comptroller reported.
15
Between 2010 and 2020,
tolls remained stagnant, with the passenger toll on the Tappan Zee Bridge remain-
ing at $4.75.
16
The Thruway might have been able to withstand a stagnant toll for some time,
as its budget is lean. Between 2011 and 2021, its operating costs (excluding asset
THE NEXT NEW YORK
90
deprecation) rose from $482 million to $511 million, a cut in real (inflation-ad-
justed) terms, thanks in part to the conversion to automatic tolling.
A bridge to more borrowing
But as operating costs were dropping, Governor Andrew Cuomo saddled the
Thruway with a substantial added expense: most of the $3.9 billion cost of replac-
ing the outmoded original Tappan Zee Bridge (opened in 1955) with a twin-span
structure named after former Governor Mario M. Cuomo. The authority has bor-
rowed $2.5 billion to fund its portion of the project, substantially increasing its
debt.
17
As of year-end 2021, the Thruway owed $6.8 billion,
18
well more than dou-
ble the $3.2 billion that it owed a decade earlier.
19
The Thruway Authority’s annual debt costs rose from $116 million in 2012 to
$195 million by 2021, or 24 percent of revenues. Its debt-service costs are set to
jump again significantly, to $308 million, a more than 50 percent increase, in 2022,
and to $362 million by 2023, peaking at $419 million by 2031.
20
Despite shedding the Canal Corporation in 2017, receiving state cash infusions
under a Cuomo-era “stabilization” plan, and approving two recent toll increases,
21
to a base rate of $5.75 on the new bridge in 2021, the Thruway is unable to cover
projected cost increases. In its financial plan, it estimates an “additional [annual]
revenue need” of $82 million.
22
The construction of the new Tappan Zee crossing, moreover, diverted re-
sources from other capital spending. The Thruway’s figures show a decrease in
pavement conditions since 2018.
A pile of mass-transit “priorities”
Unlike the Thruway Authority, the MTA has not enjoyed two decades of flat
operating costs, relative to inflation. In nominal terms, operating costs doubled
between 2003 and 2019, before the pandemic, far outpacing inflation (39 percent
growth), growth in fares and tolls (99 percent) and growth in tax subsidies (200
percent). Payroll costs have risen from $3.3 billion in 2003 to $5.6 billion in 2022,
growth of nearly 70 percent.
With growth in operating costs outpacing revenues, the MTA has also seen
escalation in its capital budget for infrastructure. As the Permanent Citizens Ad-
visory Committee to the MTA has written, the authority’s first capital plan, be-
ginning in 1981, totaled nearly $8 billion,
23
or $24 billion in today’s dollars; the
current five-year capital plan, which runs through 2024, projects to spend $52
billion, more than twice as much in real terms.
24
The MTA’s capital plans have increased in both ambition and cost per unit
since the early 1980s—graduating from a repair and replacement phase from the
early 1980s until the early 2000s, to a greater concentration on substantial new
projects, including the $12 billion East Side Access project, the $5 billion first
phase of the Second Avenue Subway, and the $1.4 billion Fulton Street subway
station in lower Manhattan. Though the MTA received partial federal grants for
such projects, escalating costs after those grant awards forced the authority to
bear a far greater share of the burden.
Renewing and Reforming the Empire State
91
This escalation has forced the MTA to rely increasingly on debt. During its
first decade, the MTA funded 29 percent of its capital plans with debt and 33
percent with federal grants, the remainder coming from state and city support,
according to the Permanent Citizens Advisory Committee. By 2004, the capital
funding mix was 47 percent with debt and 27 percent federal support.
25
The cur-
rent capital plan projects $12 billion in federal grants, up from $7.6 billion in the
previous plan. But because of the growth in the capital plan, federal revenues
would comprise just 21 percent of resources; the plan would depend on a record
63 percent debt (the remainder would come from state and local contributions).
26
Because of this trend, the MTA’s debt has risen from $32.7 billion in 2012 to
$47.8 billion.
27
Annual debt costs, just under $650 million in 2003, have escalated
to $3.1 billion, or 20 percent of revenues (including COVID federal rescue aid to
replace fare revenues), and are projected to increase to $3.5 billion by 2026.
28
The COVID-19 pandemic has exacerbated the MTA’s financial problems, with
fare and toll revenues down 36 percent from 2019 levels. Nearly 40 percent of
pre-2020 weekday subway and commuter-rail riders have yet to return. The MTA
faces indefinite annual deficits above $2.5 billion, papered over until 2025 by $14.5
billion in federal rescue funds.
An extra challenge: high construction costs
By any standard, the cost of building new transportation infrastructure in New
York State exceeds national averages. As the Engineering News Record (ENR) re-
ports, New York City’s construction-cost index is 67 percent above the 20-city
national average.
29
A 2018 study put the state’s highway-construction costs at
$65,712 per mile, fifth highest in the nation, and nearly twice the national aver-
age.
30
New York subway costs are multiples of those in the rest of the developed
world.
31
Costs are high due to a variety of factors, including:
o the state’s “prevailing-wage” law (mandating union-scale hourly benefits
as well as wages) adds 13 to 25 percent to a project’s cost, and effectively
mandates expensive union work rules as part of the deal;
32
o New York State’s longstanding contractual set-aside preferences for mi-
nority- and women-owned contractors and subcontractors;
o a shallow bidding pool for large projects; and
o expensive, politically-driven “change orders” to design and engineering
specifications after a contract is awarded, such on the Tappan Zee
Bridge replacement project.
Inflation is making the problem worse. As of September 2022, New York’s
construction costs were up 12.4 percent above 2019 levels, according to ENR.
Though materials costs are abating as global demand slows, construction workers
will likely request double-digit raises to account for increases in the cost of living,
and to cover investment shortfalls in their pension funds.
THE NEXT NEW YORK
92
MOVING FORWARD
The complex issues described here won't be fixed overnight. To begin address-
ing them, priority reforms include the following:
• Reconsider priorities for highway spending. Though most of the
state’s five-year, $32.8 billion highway- and road-transportation capital
plan is devoted to repairing and replacing existing assets, it also contains a
list of new “signature” projects worth $4.4 billion. And many of the priori-
ties outlined in the capital plan, such as decking over sections of the
Cross-Bronx Expressway come without cost estimates. Under the 2021
federal Infrastructure Investment and Jobs Act, New York will receive an
additional $4.6 billion in federal aid highway money over a half decade.
Yet absent clear prioritization and full cost estimations, federal grant
money will fall short of covering costs, and the projects will consume
money earmarked for repair and replacement, when such planned spend-
ing is already flat. To ensure rational signature-project prioritization, the
governor should pause such projects and instead fast-track development
of a 20-year “needs assessment.”
33
As with the initial MTA mass-transit
capital plans of the early 1980s, this review should prioritize projects based
on the need to ensure existing assets are in good condition before embark-
ing on new projects. The assessment also should feature a trade-off analy-
sis; e.g., for every large-scale new-construction capital project moved for-
ward, include an estimate how many miles of existing road repairs that
must be delayed.
• Identify highway funding sources before spending. Before launching
new-construction projects, the state should outline a clear revenue stream
to repay their construction costs (after federal grants), whether it be direct
user revenues (tolls), indirect revenues (dedicated taxes), or general state
revenues. For projects to be funded out of borrowing, the state should re-
frain from its current practice of raising bonds backed by personal income
taxes, and should put such proposed borrowing to general voter approval.
• Link tolls to reasonable costs. The governor should give the Thruway the
political freedom it needs to raise its identified $82 million in annual “reve-
nue needs.” In practice, this means additional toll increases. The Thruway
should consider indexing tolls automatically to general cost inflation, with
an annual cap of 3 percent.
• Reset dedicated taxes. The highway and bridge trust fund should signifi-
cantly increase its pay-as-you-go capital spending rather than embark upon
the full new borrowing proposed in the new capital plan. The trust fund
could more than double the current $560 million it is spending on pay-as-
you-go projects were the state to transfer even a portion of the responsi-
bility for state transportation operations, as opposed to capital, back to the
state budget and away from the trust fund. At least a portion of any sur-
plus funds should be transferred to the trust fund to make up for the past
Renewing and Reforming the Empire State
93
funding of state operations cost, thus allowing the trust fund to build a re-
serve for future capital expenditures. This would not eliminate the need to
borrow, but the state would be on its way to returning to the trust fund’s
original purpose: paying for repairs and maintenance. The state gradually
could reserve new debt for large-scale projects that create new assets or
extend the life of existing assets.
• Adopt a more realistic MTA capital plan. The current five-year capital
plan, running until 2024, contemplates fewer new big-ticket capacity pro-
jects than previous plans since 2000. Just as with the state’s highway-trans-
portation capital plan, 82 percent of the new plan’s resources, or $42.7 bil-
lion, go toward investments in existing core assets. Two of the capital pro-
ject’s most ambitious commitments are $9.2 billion for elevator and escala-
tor construction and replacement, and $7.1 billion to modernize subway
signaling. The biggest single-ticket expansion item is phase two of the Sec-
ond Avenue Subway to Harlem ($6.3 billion). Though its mix of projects
is sound, the MTA has not proven itself capable of committing such a
large amount of funding, 53 percent larger than its previous five-year capi-
tal program, by 2024. The new governor can buy some time for the MTA
in asking it to make a more realistic schedule of capital commitments.
• Rethink the Penn Station project. New York State has a role in two ma-
jor projects related to Penn Station: renovating the station itself and ex-
panding train capacity. On the first project, the MTA has not produced a
firm cost estimate to renovate Penn Station, a cost to be paid for (in part)
by large-scale commercial-real-estate development on the West Side, sub-
sidized by city tax incentives. The current capital plan includes only design
funding, but no formal cost estimate, although informal estimates put the
figure at $7 billion.
33
This project must be reconsidered before it goes any
further. By allowing light and air into the existing train station below Mad-
ison Square Garden, the changes it makes may be beneficial from a cos-
metic perspective—but they do not add train capacity.
34
The state should also reconsider its role in funding part of the cost of the
second, related multi-billion-dollar Penn South project to increase com-
muter-track capacity under Penn Station, managed by the Amtrak federal
railroad. Before investing in track capacity, the state should conduct a full
assessment of the MTA’s expected commuter-train schedules into Penn
Station after the scheduled late 2022 opening of the Long Island Rail Road
(LIRR) East Side Access terminal underneath Grand Central. ESA should
redirect at least half of the LIRR’s trains away from Penn Station, thus
freeing up track space. The new governor also should explore whether
smaller-scale changes that could be made by other government agencies,
including Amtrak’s redirecting Albany trains to and from Grand Central
Terminal using existing infrastructure, would reduce the need for track ca-
pacity under Penn Station. New York needs a full mock-up timetable of
train arrivals and departures circa 2030.
THE NEXT NEW YORK
94
• Control transit and commuter rail labor costs. The MTA’s subway
and bus division’s contract with its biggest bargaining unit, Local 100 of
the Transport Workers Union, expires next year. The stakes are enor-
mous; for example, raises linked to inflation over the past two years
would add more than $500 million to the MTA’s annual payroll costs.
Any such increases across the MTA’s workforce must be in return for
productivity enhancements.
35
The MTA also should assert state jurisdic-
tion over LIRR labor agreements, which anachronistically are still treated
as subject to federal railway law. Since the LIRR is not an interstate rail-
road, its workers should fall under the state Taylor Law—which, unlike
federal railroad law, prohibits strikes by public employees and thus re-
moves a point of leverage from unions during contract negotiations.
• Push for more transparent, productive capital contracts. The Legisla-
ture should mandate that all contracts subject to the so-called prevailing
wage law be made public, with such transparency facilitating ideas for
productivity enhancements. Similarly, the state should compile perfor-
mance statistics on contractors and subcontractors participating in minor-
ity- and women-contractor set-aside programs. The state should also re-
quire all contractors to provide bonded long-term warranties for work
quality, common in Europe.
36
Finally, the state should consider modifying
the requirement that contracts go to the lowest responsible bidder, allow-
ing for a full value and past-performance assessment.
37
• Find substitutes for fuel taxes. As autos and trucks have become more
fuel-efficient, the amount of money that the state collects from motor-fuel
taxes has stagnated. Electric vehicles will exacerbate this stagnation. New
York should decide how it might replace, or significantly supplement, mo-
tor-fuel taxes. In doing so, the state can take advantage of federal grant
funds for pilot projects to test a mileage-based user fee. The Eastern
Transportation Coalition, which includes New York as a member state,
has worked with four states–Delaware, New Jersey, North Carolina, and
Pennsylvania—in testing such pilots, with programs designed for heavy
trucks and for passenger vehicles.
38
A pilot program goal would not be im-
mediately to raise money; rather, it would be to assess voluntary partici-
pants’ experience of the pilots for improvement. The state also might con-
sider whether, over the long term, it could devote some vehicle-miles trav-
eled revenues to create a dedicated tax to fund transportation operations.
• Make a fast, final decision on congestion pricing. New York State’s
congestion-pricing program, enacted by the state Legislature in 2019, faces
potential pitfalls. Expected to raise $1 billion for the MTA’s future capital-
program debt service via a $9 to $23 cordon toll for cars and trucks below
Manhattan’s 60th Street, the program would create a burden on both the
Bronx and Staten Island in terms of additional “vehicle miles travelled,”
including hundreds of additional trucks daily to the Cross-Bronx Express-
way.
39
If New York does not go forward with congestion pricing, however,
it will need $1 billion in revenue replacement for the MTA, even assuming

Renewing and Reforming the Empire State
95
cost reforms. A large-scale rethink might include a vehicle-miles-travelled-
fee surcharge within Manhattan below 60th Street, or a pilot test of fees
for loading and parking within core Manhattan, with the money to be
shared between the MTA and the city.
• Appoint independent experts to the MTA board. The governor con-
trols the plurality of the MTA’s board via seven appointments, including
the chairperson. The governor’s goal in appointing members should be in-
dependence, to further the principle of checks and balance. Gubernatorial
MTA board appointees should not hold agency jobs reporting to the gov-
ernor’s office, but should have experience in the transportation, project
management, or financial sectors.
ENDNOTES
1
“The New State Tax,” New York Times, April 10, 1929, https://timesmachine.ny-
times.com/timesmachine/1929/04/10/95906625.pdf?pdf_redirect=true&ip=0.
2
Edward Hudson, “Motorists to Face Delays as Repairs Begin on Roads,” New York Times, June 24, 1984,
https://www.nytimes.com/1984/06/24/nyregion/motorists-to-face-delays-as-repairs-begin-on-
roads.html?searchResultPosition=14 , https://www.nytimes.com/1982/07/18/us/alarm-rises-over-decay-in-
us-public-works.html?searchResultPosition=12.
3
“The New York State Dedicated Highway and Bridge Trust Fund: At a Crossroads,” Office of the New
York State Comptroller, January 2022, https://www.osc.state.ny.us/files/reports/pdf/new-york-state-dedi-
cated-highway-and-bridge-trust-fund-crossroads.pdf.
4
FY2023 Executive Budget Financial Plan, State of New York, April 2022,
https://www.budget.ny.gov/pubs/archive/fy23/ex/fp/fy23fp-ex-amend.pdf; MTA 2023 Preliminary
Budget, Metropolitan Transportation Authority, Vols, 1 and 2, July 2022, https://new.mta.info/docu-
ment/91776, https://new.mta.info/document/91781.
5
MTA 2019 Adopted Budget, Metropolitan Transportation Authority, February 2019,
https://new.mta.info/sites/default/files/2019-03/MTA-2019-Adopted-Budget-February-Financial-Plan_2019-
2022.pdf; “The New York State Dedicated Highway and Bridge Trust Fund: At a Crossroads,” Office of the
New York State Comptroller, January 2022, https://www.osc.state.ny.us/files/reports/pdf/new-york-state-
dedicated-highway-and-bridge-trust-fund-crossroads.pdf.
6
Transportation Asset Management Plan, New York State Dept. of Transportation, June 2019,
https://www.dot.ny.gov/programs/capital-plan/repository/Final%20TAMP%20June%2028%202019.pdf.
7
“Governor Hochul Announces Record $32.8 Billion for Transportation Infrastructure,” Office of the Gover-
nor, New York State, April 9, 2022, https://www.governor.ny.gov/news/governor-hochul-announces-rec-
ord-328-billion-transportation-infrastructure-part-fy-2023-budget.
8
Paul Heffernan, “Thruway is Seen as Self-Liquidating,” New York Times, November 7, 1951,
https://timesmachine.nytimes.com/timesmachine/1951/11/04/96222453.pdf?pdf_redirect=true&ip=0 ,
https://www.nytimes.com/1951/11/07/archives/all-8-amendments-are-approved-thruway-and-transit-far-in-
lead-all-8.html?searchResultPosition=1.
9
“Thruway is Seen as Self-Supporting,” New York Times, June 8, 1954, https://timesmachine.ny-
times.com/timesmachine/1954/06/08/83761074.pdf?pdf_redirect=true&ip=0;
Warren Weaver, Jr., “State Unit Calls Thruway ‘Sound,’” New York Times, January 30, 1957,
https://timesmachine.nytimes.com/timesmachine/1957/01/30/84720073.pdf?pdf_redirect=true&ip=0.
10
New York State Thruway Authority General Revenue Bonds Series O, New York State Thruway Authority,
September 23, 2021, https://www.thruway.ny.gov/about/financial/bond/sales/genrevserieso.pdf.
11
“Thruway To Raise All Users’ Tolls,” New York Times, June 23, 1969, https://timesmachine.ny-
times.com/timesmachine/1969/06/23/89002191.pdf?pdf_redirect=true&ip=0.
12
Harold Faber, “Thruway’s Tolls to End in ’96 with Federal Aid,” New York Times, July 20, 1982,
https://www.nytimes.com/1982/07/20/nyregion/thruway-s-tolls-to-end-in-96-with-federal-aid.html.
13
Lawrence Van Gelder, “Thruway Chief Says Toll Rise May Be Needed,” New York Times, August 2,
1996, https://www.nytimes.com/1996/08/02/nyregion/thruway-chief-says-toll-rise-may-be-
needed.html?searchResultPosition=13.
14
Sarah Lyall, “Cuomo Proposes to Enlarge Thruway Agency’s Powers,” New York Times, May 7, 1992,
https://www.nytimes.com/1992/05/07/nyregion/cuomo-proposes-to-enlarge-thruway-agency-s-

THE NEXT NEW YORK
96
powers.html?searchResultPosition=2; Audited Financial Statements, New York State Thruway Authority, De-
cember 31, 2010 and 2009, https://www.thruway.ny.gov/about/financial/statements/2010-audited-finan-
cial-statements.pdf.
15
“Assessment of the Thruway Authority’s Finances and Proposed Toll Increase,” Office of the State Comp-
troller, August 2012, ttps://www.osc.state.ny.us/files/reports/special-topics/pdf/thruway-policy-
08142012.pdf.
16
“New York State Thruway Traffic and Revenue Report,” New York State Thruway, September 14, 2021,
https://www.thruway.ny.gov/about/financial/bond/traffic-revenue-report.pdf.
17
New York State Thruway Authority General Revenue Bonds Series O, New York State Thruway Authority,
September 23, 2021, https://www.thruway.ny.gov/about/financial/bond/sales/genrevserieso.pdf.
18
Audited Financial Statements, New York State Thruway Authority, December 31, 2021,
https://www.thruway.ny.gov/about/financial/statements/2021-audited-financial-statements.pdf.
19
Audited Financial Statements, New York State Thruway Authority, December 31, 2011,
https://www.thruway.ny.gov/about/financial/statements/2011-audited-financial-statements.pdf.
20
New York State Thruway Authority General Revenue Bonds Series O, New York State Thruway Authority,
September 23, 2021, https://www.thruway.ny.gov/about/financial/bond/sales/genrevserieso.pdf.
21
Audited Financial Statements, New York State Thruway Authority, December 31, 2017,
https://www.thruway.ny.gov/about/financial/statements/2017-audited-financial-statements.pdf.
22
2022 Budget, New York State Thruway Authority, https://www.thruway.ny.gov/about/financial/budget-
books/books/2022-budget.pdf.
23
“The Road Back: A Historic Review of the MTA Capital Program,” Permanent Citizens Advisory Commit-
tee to the MTA, May 2012.
24
MTA 2020-2024 Capital Program, MTA, https://new.mta.info/capital/2020CapitalProgram.
25
“The Road Back: A Historic Review of the MTA Capital Program,” Permanent Citizens Advisory Commit-
tee to the MTA, May 2012.
26
Executive Summary, MTA Capital Program 2020-2024, MTA, September 25, 2019,
https://new.mta.info/sites/default/files/2019-09/MTA%202020-2024%20Capital%20Program%20-
%20Executive%20Summary.pdf.
27
MTA Debt Outstanding, MTA, September 1, 2022, https://new.mta.info/document/37176.
28
MTA 2023 Preliminary Budget, Metropolitan Transportation Authority, Vol. 1, July 2022,
https://new.mta.info/document/91776.
29
“Construction Economics,” Engineering News-Record, September 5, 2022, https://www.enr.com/ext/re-
sources/static_pages/Economics/2022/0905_CE_WK2-combined.pdf (via subscription only).
30
Mary Craighead, “A Comparison of Highway Construction Costs in the Midwest and Nationally,” Mid-
west Economic Policy Institute, March 20, 2018, https://midwestepi.files.wordpress.com/2017/05/cost-per-
lane-mile-nationally-and-in-the-midwest-updated-final.pdf.
31
Alon Levy, “Quick Update On Where We Are on New York Costs,” Pedestrian Observations, October
17, 2021, https://pedestrianobservations.com/2021/10/17/quick-update-on-where-we-are-on-new-york-
costs/.
32
E.J. McMahon, “Prevailing Waste: New York’s Costly Public-Works Pay Mandate,” Empire Center, April
24, 2017, https://www.empirecenter.org/publications/prevailing-waste/
33
“The Penn Station $7 Billion Fix-Up Moves Ahead: Here’s What to Know,” New York Times, July 21, 2022.
34
“MTA Moving Forward With Capital Projects to Improve Transit Equity,” MTA, July 25, 2022,
https://new.mta.info/press-release/mta-moving-forward-capital-projects-improve-transit-equity.
35
Alex Armlovich, “The Track To Fiscal Stability: Operations Reforms for the MTA,” Citizens Budget Com-
mission, May 25, 2021, https://cbcny.org/research/track-fiscal-stability.
36
Ian Jack, “Chasing Steel,” London Review of Books, September 22, 2022, https://www.lrb.co.uk/the-
paper/v44/n18/ian-jack/chasing-steel .
37
Carlo Scissura, “Build Faster and Cheaper, NYC,” New York Daily News, October 5, 2022,
https://www.nydailynews.com/opinion/ny-oped-how-nyc-can-build-big-things-again-20221005-7kwzugam-
zzh2vdkfplz36aj6ma-story.html .
38
Paving the Way to Transportation Funding’s Future, Eastern Transportation Coalition, https://tetcoali-
tionmbuf.org/.
39
Central Business District Tolling Program Environmental Assessment Executive Summary, MTA et. al., Au-
gust 2022, https://new.mta.info/document/92756.
8.
Housing New York
By Howard Husock
To a far greater extent than any other state, New York has made substantial
public investments in its housing sector—both through direct financial support
and indirect tax subsidies. The state’s subsidies aim to create what is often referred
to as “low-income” or “affordable” housing, but might better be described as
income-restricted housing.
1
Governors Andrew Cuomo and Kathy Hochul doubled
down on this approach, launching a new multibillion-dollar wave of government-
backed affordable housing construction and preservation, financed by a combi-
nation of federal grants and billions of dollars in new state borrowing adminis-
tered by agencies answerable solely to the governor’s office.
State-authorized regulation of local rental markets has also been significantly
extended in recent years. In 2019, then-Governor Cuomo signed the Housing
Stability and Tenant Protection Act, making permanent New York City’s long-
standing “emergency” rent control system, in the process rolling back a modest
“decontrol” reform enacted in the late 1990s.
2
The law also extended rent regula-
tions and a local rent-control option to upstate communities that already have
ample affordable housing. Some state lawmakers have continued to push for more
widespread rental regulations, including laws capping rent increases on all private
market-rate properties and requiring landlords to show “good cause” for failing
to offer automatic lease extensions to their tenants.
In a bid to boost housing supply in suburbs, Governor Hochul’s fiscal 2023
budget bills included a provision that would have effectively overridden local zon-
ing laws by requiring towns and cities to allow accessory dwelling units (ADUs)
in neighborhoods now limited to single-family homes. That proposal ultimately
was dropped but seems likely to emerge in new forms.
For all the political focus on housing issues, however, New York’s policies
have produced meager or counterproductive results—when they haven’t arguably
undermined supply and affordability.
On Long Island and in the lower Hudson Valley, little new housing has been
built, and the existing supply is both scarce and expensive.
New York City added a rising annual total of housing before the 2020 pan-
demic lockdown disruption, but not enough to compete with demand. The city’s
housing market remains hobbled by counterproductive regulations, inequitable
taxes, high prices, and a massive but dysfunctional public housing complex.
Upstate urban areas, by contrast, have higher vacancy rates and more afforda-
ble housing stock—reflecting generally stagnant economic conditions. They, too,
nonetheless have been targeted for expensive state-subsidized development—
and, under the 2019 state law, upstate rental markets may now also be subject to
disruption by local adoption of state-authorized rent regulation.
THE NEXT NEW YORK
98
THE STATUS QUO
As of 2021, according to federal Department of Housing and Urban Develop-
ment (HUD) estimates, New York had 591,065 units of publicly “assisted hous-
ing,” or three units for every 100 state residents, which is double the national
average relative to population and by far the most of any state. The total included
187,699 apartments in public housing projects, the vast majority owned and man-
aged by the New York City Housing Authority, as well as some 271,000 privately
owned units whose tenants qualified for government housing vouchers, and
108,000 units whose development was subsidized by the federal Section 8 Low
Income Housing Tax credit, which requires a percentage set-aside of units for low
and moderate-income households.
Even excluding publicly owned projects, New York’s stock of 403,366 subsi-
dized units (2.03 per 100 residents) far exceeded the total in every state except
California, which had 475,341 units for a population nearly twice as large (or 1.2
per 100 residents). Notably, the HUD figures do not include the roughly one mil-
lion rent-regulated apartments in New York City, which are also insulated from
the private housing market, although not income-restricted.
New York State’s housing finance debt of $18 billion is roughly six times larger
than those of two states with larger populations, Texas and Florida, where state
housing finance agencies most recently reported indebtedness of $2 billion
3
and
$2.1 billion
4
respectively.
In recent years, the Empire State has committed itself to subsidizing even more
“affordable housing,” as well as renewing existing housing subsidies due to lapse.
In 2017, then-Governor Cuomo launched what was described as “a landmark $20
billion, five-year plan to combat homelessness and advance the construction of
affordable housing in New York State,” including creation or preservation of
“more than 110,000 units of affordable and 6,000 units of supportive housing”
over five years, which his office touted as “the largest investment in the creation
and preservation of affordable housing and efforts to end homelessness in the
history of New York.”
5
Incorporating and expanding on this program, the FY 2023 state budget in-
cluded what Governor Hochul called “a bold $25 billion, five-year housing plan
that will create or preserve 100,000 affordable homes across New York, including
10,000 with support services for vulnerable populations.”
The latest version of the state plan includes $5.7 billion in capital resources
(funded by legislatively authorized but non-voter-approved state bonds, also
known as backdoor borrowing), $8.8 billion in State and Federal tax credits and
other federal allocations, and $11 billion to operate shelters and supportive hous-
ing units, and to provide rental subsidies.
While they are billed as affordable to low- or moderate-income renters, subsi-
dized apartment complexes have been expensive to construct—typically ranging
between $250,000 to upwards of $400,000 per unit even in low-cost upstate metro
areas, depending on the extent of added amenities and “supportive” services in-
cluded in each package.
6
By contrast, as of mid-2022, median single-family home
Renewing and Reforming the Empire State
99
prices in the largest upstate New York cities ranged from $174,900 in Syracuse to
$242,700 in Albany.
7
Rent regulation
New York State (principally New York City) contains the vast majority of the
nation’s rent-regulated apartments—some 1,048,860 “rent-stabilized” units, plus
a dwindling 16,400 apartments with pre-1971 tenants grandfathered into older,
more stringent “rent control” provisions.
State law requires owners of rent-regulated apartments to apply annually for
any increase in unit rent. Requests for higher rents must be based on demon-
strated higher costs to landlords, rather than any assessment of what the rental
market would bear. Rent-regulated units, in contrast to government-subsidized
“affordable” units, do not require an income test for potential tenants.
Like all forms of government price control, rent regulation has had the coun-
ter-productive effect of creating what the political scientist Peter Salins has termed
“scarcity by design.”
8
First, rent regulation discourages the normal turnover that makes way for new-
comers to a city. A 2014 study found that more than three times as many rent-
regulated tenants (23.1 percent) as market-rate tenants (7.1 percent) have lived in
their units for 20 years or more.
9
Long-time tenants who may no longer need as
much space naturally cling to their good deal rather than moving and making way
for new arrivals, as they do in normal housing markets. Compared to tenants in
market-rate units, twice as many rent-regulated tenants are over 65 in New York
City.
Moreover, rent regulation does nothing to ensure that regulated units will serve
those of modest means—just the opposite, in fact. When property owners face
limits on how much rent they can charge, they have more incentive to seek tenants
who are financially able to pay in full and on time. Indeed, the same 2014 study
found that less than half of rent-regulated tenants in core Manhattan could be
classified as low-income or “rent-burdened.”
10
Rent regulation also discourages capital investment and long-term building
maintenance—a problem exacerbated by 2019’s Housing Stability and Tenant
Protection Act, which sharply limited maintenance-related investments that may
be used to justify rent increases.
11
Specifically, the law capped non-capital up-
grades at $15,000 to three separate units over a 15-year period; it also capped
major capital improvements at two percent, amortized over 12 years for buildings
with 35 or fewer units, or 12.5 years for those with more than 35.
By explicitly trading off building upkeep for limits on rent increases, regardless
of tenants’ ability to pay, state law creates a recipe for the long-term decline or
“shabbification” of New York City’s housing stock. The questionable changes in
the 2019 law notably included an indefinite extension of rent regulation, which
had previously been linked to a finding that a housing “emergency” continued to
exist, as indicated by census data on rental vacancies. As a practical matter, the
law—including its deterrent effect on new investors and new construction, con-
cerned about the possibility of further expansion of regulation—will perpetuate
the “emergency.”

THE NEXT NEW YORK
100
Supporters of added rent regulation are pushing to go further via a “just-cause
eviction” law, proposed in the 2022 state legislative session and likely to be rein-
troduced in 2023.
12
That proposal would bar the initiation of eviction proceedings
if an apartment rent had been increased by more than three percent (or 150 per-
cent of the Consumer Price Index as measured at a set point in the calendar year).
The proposal would effectively extend rent regulation statewide—and pose a par-
ticular problem during a period of increasing overall inflation.
13
In fact, rising rents
in many of the state’s older cities would actually be a positive sign—of rising de-
mand and returning prosperity. The idea that property owners should be com-
pelled to provide low-cost housing is distinct from the markets for virtually all
other goods and services.
Big investments, scant return
New York state’s ongoing public investment in financing housing construction
has not significantly boosted growth in housing supply, especially when compared
to other states, even in the expensive, slower-growing northeast, according to
Census Bureau data illustrated in Figure 1, below.
In 2021, when new housing starts surged across the country in the wake of the
pandemic, New York State municipalities issued building permits for 40,135 res-
idential units in single- and multi-family homes, a ratio of just 1.99 units per 1,000
residents. This was well below the 50-state median, which was 4.4 units per 1,000.
Only three states—Connecticut, Illinois, and Rhode Island—authorized fewer
new housing units relative to population, while neighboring Massachusetts (2.82),
New Jersey (3.99) and Pennsylvania (3.68) approved more housing construction.
Figure 1: Housing Units Authorized, 2021
Building permits issued per 1,000 residents
Source: U.S. Census Bureau

Renewing and Reforming the Empire State
101
A similar pattern had been in place for years before the pandemic; in 2019, for
example, the New York residential permits ratio was 2.09 per 1,000, just over half
the national ratio of 3.75.
14
Only eight states issued fewer new housing permits
per 1,000 in the seven years leading up to the pandemic.
15
In 2021, New York residential building permits were concentrated in just two
residential categories: single-family homes (11,099 units) and apartments in build-
ings of five or more units (27,510) units. Across the Empire State, only 908 two-
family homes were issued permits in 2021—just three percent of the total—ef-
fectively limiting the range of housing types available, repeating a pattern from
recent years.
16
This “missing middle” in the new multi-family housing market is
less reflective of tenant preferences than of the strict, single-family zoning pre-
vailing in many municipalities across the state.
On a regional basis within the state, permits for new housing units were con-
centrated in the four largest boroughs of New York City, particularly in buildings
of five or more housing units. But even in a city where housing variety abounds,
fully 25 percent of Queens and 22 percent of Staten Island remains zoned exclu-
sively for single-family dwellings.
17
In those areas, a single-family home could nei-
ther be replaced by a two or three-family home nor converted into one.
The situation is more extreme in downstate suburbs such as Suffolk County,
where single-family homes account for more than 81 percent of the housing
stock.
18
Among the nation’s 100 most populous counties, between 2008 and 2018,
Suffolk and neighboring Nassau County ranked near the bottom in measures of
new residential building permits per 1,000 residents, even amid continuing politi-
cal talk and media reporting of an affordable housing “crisis.” This was not just a
northeastern phenomenon; most notably, Hudson County, NJ, part of the met-
ropolitan New York City market, authorized nearly 48 residential permits per
1,000 during, the fifth largest ratio among the 100 most populous counties.
This pattern also continued as pandemic restrictions were being lifted. In 2021,
among the nation’s 281 most populous counties (those with 250,000 or more res-
idents) the median rate of new housing permits was 43.5 per 1,000. But four large
New York counties—Nassau, Onondaga, Suffolk, and Richmond—were among
only a dozen out of the 281 issuing fewer than 10 permits per 1,000.
Stifling opportunity
Limiting the variety of housing stock also limits homeownership opportunities
for individuals who could otherwise offset their costs with rental income. It not
only limits buyer choice but inhibits the construction of what has been called
naturally occurring affordable housing—homes within a variety of price ranges,
reflecting modest size and rental income.
Government’s “affordable” housing solution doesn’t come cheap to taxpayers.
New York’s per-unit cost of developing subsidized housing, financed through
federal and state tax credits and administered by the state’s Housing Finance Au-
thority, is among the highest in the nation—ranging as high as $450,000, with
medians of $282,000 in New York City and $264,000 in the rest of the state, ac-
cording to a 2018 federal study based on data from 2011-15.
19
THE NEXT NEW YORK
102
If government-subsidized housing were the best way to alleviate housing short-
ages and economic burdens, New York State should have done better in ap-
proaching those problems than any other state. Not only does it have a greater
number of subsidized units, but it has invested more capital, as reflected by
bonded indebtedness, than any other state. Moreover, it has facilitated the highest
amount of subsidized housing during the same post-1960 period in which its pop-
ulation has persistently declined in relationship to other states.
As older New York cities and neighborhoods struggle with vacant housing
units, it’s important to recognize that new subsidized housing competes with pri-
vately-owned, unsubsidized but still relatively affordable units—and thus actually
can encourage more abandonment of older housing in marginal neighborhoods.
New subsidized units with contemporary amenities, priced below what the un-
subsidized market would otherwise demand, logically divert demand from older
but adequate private housing—just as subsidized steak would divert demand from
ground beef, or subsidized lobster from catfish.
More space for fewer tenants
A more subtle problem with the New York housing market is its failure to
make the best use of existing public housing units. Many tenants, particularly in
subsidized complexes, effectively are “over-housed,” epitomized by apartments
with one resident and multiple, unused potential bedrooms. What HUD defines
as “more bedrooms than people” characterizes 17 percent of all subsidized hous-
ing nationwide—but 27 percent of public housing households in New York State.
Among tenants of the New York City Housing Authority (NYCHA), the nation’s
largest, nearly one-third of residents are over-housed by HUD standards.
20
The over-housing syndrome reflects a larger problem stemming from state
policies: low rates of tenant turnover. The limited supply of new market-rate
housing, combined with the rules surrounding subsidized and regulated rents, en-
courages renters to continue to avail themselves of what they inevitably regard as
a good deal. For many prospective tenants, landing an apartment in a public com-
plex or state-subsidized system is akin to hitting the housing lottery, providing
subsidized rent without a time limit even when income or assets increase.
Compounding the problem, the 2019 rent regulation law repealed a key provi-
sion of the Rent Regulation Reform Act of 1997
21
lifting price controls from units
whose regulated rents moved above a “luxury” threshold (initially $2,000, most
recently $2,744 a month), or whose tenants earned more than $250,000 a year.
The so-called luxury decontrol provision served as gradual means of returning
high-rent units to the free market, inducing turnover and investment that, indi-
rectly, can benefit tenants of all income levels.
New York’s current subsidized housing regulations not only limit turnover but
also discourage upward mobility on the part of low-income households in public
or voucher-subsidized housing. Like most similar agencies around the country,
NYCHA and other authorities in New York link rent to tenant’s incomes (typi-
cally pegged at 30 percent), rather than offering fixed-rent leases, which is the
private-sector norm. This discourages subsidized households from increasing
their income—which, after all, will only lead to higher rent.
Renewing and Reforming the Empire State
103
Low turnover also leaves low-income newcomers, many of them immigrants,
figuratively out in the cold. Asian-Americans, for instance, comprise 11.1 percent
of New York City’s households in poverty, based on median income, but make
up only 4.7 percent of households in subsidized housing.
22
Many have no alterna-
tive but to turn to informal, illegal arrangements, as reflected by the estimated
100,000 people living in non-legal basement apartments across the five boroughs,
many concentrated in immigrant-magnet neighborhoods such as Jackson Heights
in Queens.
23
Excluded from property tax assessments and uninspected by the city Buildings
Department, these units are more likely to pose safety hazards to their inhabit-
ants—as evidenced by the 11 drowning deaths in such units following the Hurri-
cane IDA storm surge in the fall of 2021. However, safe and legal basement units
could also provide much-needed additional housing.
Rethinking policy
It is time for a sharp departure from New York’s past housing policy focus on
subsidies and regulations, shifting to an approach aimed at harnessing private
market forces by encouraging more new construction and renovation of existing
vacant units.
Given the extent of debt financing for housing subsidies, and the much higher-
than-average cost of construction of subsidized units, the state should adopt a
moratorium on new subsidized housing construction. However, this need not
preclude investment in maintenance and repairs in existing subsidized housing,
such as that of the New York City Housing Authority, whose capital needs have
been estimated at $40 billion. A good start is the New York City Public Housing
Preservation Trust, created by 2022 legislation,
24
which has assumed responsibility
for NYCHA renovations through a 99-year ground lease of the housing author-
ity’s properties. The Trust structure gives NYCHA access to twice as much fed-
eral funding, which will be used to leverage bond financing for capital projects.
There is no justification, however, for a provision requiring the Preservation Trust
to contract with NYCHA for property management, given the abysmal record
NYCHA’s unionized workforce. At the very least, the authority’s staff should
have to compete with private contractors.
It is also worth re-examining the promise of long-term affordability—up to 30
years—for current tenants, in the context of re-imagining public housing as a
means of transition up and out of poverty, rather than remaining indefinitely in
subsidized units. The state should seek federal permission to participate in the
Moving to Work program, which permits local housing authorities to give pref-
erence to potential tenants who agree to a time limit, as well as to adopt fixed
rents so as not to discourage earnings. Adoption of the Moving to Work approach
in one California housing authority (San Bernadino), has led to striking results,
including an average increase in earned income among program participants of
45.5 percent following a voluntarily adopted five-year stay in public housing. Dur-
ing the same period, full-time employment of participating tenants increased by
25 percent.
25
THE NEXT NEW YORK
104
There are other potential ways to make better use of existing housing stock,
both subsidized and non-subsidized. New York state households, according to
Census data, average 2.55 persons per household,
26
That is slightly smaller than
the US average of 2.60, which itself has been in long-term decline, as households
have come to have fewer members.
27
The prevalence of “over-housing” reflects
that trend. While New York state is not an outlier in this regard, it can make better
use of housing by encouraging somewhat larger households. To do so, local hous-
ing authorities could consider permitting tenants to sublet empty bedrooms to
lodgers or single parents, without being penalized by paying higher rent. This also
would also increase income for the subsidized tenants.
Allowing Accessory Dwelling Units (ADUs) in single-family neighborhoods
could both increase household size and spur housing construction. These so-
called “granny flats” may take the form of an additional small building on a single-
family home lot, or the carving out of a small apartment in an existing home. This
is an especially practical option for the lower levels of the raised-ranch and split-
level houses common in New York City suburban subdivisions.
Expansion of ADUs throughout the state was among the non-budget items
packaged with legislation presented to the Legislature in January 2022 as part of
part of Governor Hochul’s FY 2023 Executive Budget. Her supporting memo-
randum for the proposal emphasized the potential benefit of ADUs to elderly
residents living in multi-generational homes.
28
However, the governor’s original
bill language would have taken a coercive approach, forcing localities to authorize
creation of at least one ADU per residential lot, overriding local single-family zon-
ing statewide.
Unsurprisingly, the proposal ultimately ran into opposition from suburban leg-
islators in both parties. The governor amended her bill to eliminate the statewide
mandate, focusing instead on an authorization for New York City to establish a
program to legalize pre-existing ADUs; the final budget, however, contained no
new ADU language. Widely viewed as interference with local zoning, the gover-
nor’s approach of wrapping an ADU mandate in the massive budget package
squelched a statewide debate that would have clarified the issue on all sides. None-
theless, ADUs remain a housing option deserving of consideration in many sub-
urban areas, especially downstate communities.
Local-control issues aside, another obstacle to housing development in New
York’s suburbs, and to ADUs in particular, is a lack of municipal water and sewer
infrastructure—especially on eastern Long Island, as well as in New York City’s
further northern suburbs. For example, as Newsday reported in 2018, “nearly 75
percent of homes in Suffolk County—some 360,000 residences—are not con-
nected to sewers and rely instead on septic tanks and/or cesspools, through which
wastewater flows into the ground and Long Island’s bays, rivers and the Sound.”
29
Another obstacle to housing development is New York State Environmental
Quality Review Act (SEQRA), which is among the most expansive and restrictive
environmental planning laws in the nation. For decades, in countless cases across
the state, SEQRA has been employed by development opponents to delay and
ultimately stifle new construction of all types, including housing, as explained in
a 2013 Empire Center report.
30
Renewing and Reforming the Empire State
105
MOVING FORWARD
New York State faces a seemingly perennial “housing crisis” which political
and policy intervention has not solved. Rent regulation rewards the affluent and
inhibits the housing turnover a dynamic city like New York City relies on to ac-
commodate ambitious newcomers and their innovative idea. Public housing—
including the nation’s largest such system, in New York City—is structured to
discourage increased household earnings and upward mobility, while making poor
use of what could be valuable development sites. Single-family zoning—the norm
in most suburbs—acts as a straitjacket, limiting housing choices and making home
ownership more difficult for households of modest means. So, too, does large-lot
zoning (one-acre or more), which increases cost by limiting density.
Each of these problems cries out for common-sense reform. As priority steps,
policymakers should:
• Reverse rent regulation. To prevent the spread of “scarcity by design,”
the Legislature should repeal provisions of the Housing Stability and Ten-
ant Protection Act that allowed adoption of local rent regulations in munic-
ipalities not already covered by the pre-2019 rent law.
31
In New York City
and other communities that were already subject to rent control and regula-
tion, the law ideally should be amended to provide for a phase-out to pro-
tect existing tenants but restore and broaden vacancy decontrol of regu-
lated units. Short of that, state law at a minimum should restore the va-
cancy decontrol provisions of the pre-2019 law, which affected only the
highest-priced units and the most affluent tenants and repeal those provi-
sions capping rent hikes related directly to capital investments. Additionally,
the Governor and Legislature should reject the proposed “just cause evic-
tion” law, which would effectively extend rent regulation statewide by limit-
ing rent increases to a cost-of-living adjustment. In a period of high infla-
tion, such a measure quickly becomes outdated. Moreover, any rule restrict-
ing rent increases will spread the distortions of the New York City housing
market statewide.
• Encourage New Private Housing Development. The ADU issue can be
revisited without resorting to the coercive, top-down mandate proposed by
Governor Hochul in 2022. Rather, the state should develop and promote a
model ADU law for local governments, including guidelines for housing
types and neighborhoods most appropriate for the change. To head off
community opposition, this should be approached with the goal of mini-
mally disrupting existing neighborhood housing patterns and streetscapes.
For instance, ADUs close to commercial and transit hubs make more sense
than mandating them in areas further away. These can be coupled with lo-
cal financial incentives including but not limited to added grant money for
road improvements, expanded transit networks, and—last but not least—
water and sewer infrastructure in areas that lack it. More broadly, similar
state financial incentives should be linked to more relaxed local zoning that
would accommodate the natural affordability of small, multi-family homes,
THE NEXT NEW YORK
106
such as two- and-three-unit structures. Historically, in the era before draco-
nian single-family zoning, even affluent communities had a “poor side of
town”, where younger families, public employees and service workers could
afford to live. Far-sighted zoning would recognize the need for such
“workforce” housing.
• Reform and Repurpose Public Housing. Municipal housing authorities,
especially NYCHA, should be encouraged (including through conditional
state financial assistance) to seek participation in the federal Moving to
Work program, giving preference to potential residents who agree to a ten-
ancy time limit, as well as to adopt fixed rents so as not to discourage
higher earnings. Housing Authorities should also be encouraged to sell
properties on very high-value sites that could be used for other purposes.
To do so, tenants should qualify for buyouts based on their years in a unit.
Many public housing developments, especially in New York City, stand on
extremely valuable real estate sites that could generate revenue sufficient to
buy out tenants, on a voluntary basis. Both zoning changes and public
housing site repurposing should be thought of as tools to unfreeze local
housing markets whose constraints and distortions have combined to cre-
ate, not resolve, a never-ending housing “crisis.”
• Cut red tape. Zoning is not the only barrier to new housing construction.
New York should streamline State Environmental Quality Review Act to
curb undue delay of housing developments that otherwise comply with all
relevant state and local environmental standards. This should include a
fixed time-limit for review, so as not to discourage developers concerned
about open-ended regulatory delay. More broadly, an open-minded state
administration should consult with housing developers as to what they con-
sider to be the chief deterrents to new construction, including zoning, per-
mitting and regulation. The question should be asked of housing providers:
what would it take for you to build more? Their answers should not be dis-
positive—but they should not be overlooked.
CONCLUSION
Viewing developers and property owners as a special interest, while viewing
tenant “advocates” as representing the public interest, has led to a distorted and
dysfunctional housing market in New York State. The time is right for a new,
fairer balance—one that will broaden access to housing for New York State resi-
dents and potential newcomers.

Renewing and Reforming the Empire State
107
Appendix
The Structure of New York State Housing Agencies
The state Division of Housing and Community Renewal (HCR) stands
at the top of an organizational chart including a series of housing-re-
lated financial entities, all with the capacity to issue implicitly state-
backed bonds and which rely on the interest income from developers,
tenants, homeowners, and others to repay its bondholders.
Despite its high-profile role, statewide footprint, and extensive invest-
ments, HCR (now calling itself “Homes and Community Renewal”) is not
among the 20 cabinet-level agencies authorized by the state Constitu-
tion. Rather, it is an outsized division within the Executive Department,
directly controlled by and answerable to the governor, who appoints its
commissioner without a requirement for legislative confirmation. As of
FY 2023, HCR had a $1.37 billion budget, funded overwhelmingly by
federal grants, and all but $66 million was distributed in grants to local
public chousing agencies. (As its name implies, HCR’s Office of Rent Ad-
ministration also administers rent regulations in all cities subject to
them.)
The main sources of subsidized housing finance in New York state
are a series of agencies grouped under the HCR umbrella but operating
independently, directed by their own boards of gubernatorially-ap-
pointed directors. Operating like independent public authorities and for-
mally categorized as public benefit corporations, these entities include
State of New York Mortgage Agency (SONYMA) and the New York
State Affordable Housing Corporation, both of which subsidize home
ownership by using their bond-financed appropriations for such pur-
poses as providing lower-income borrowers with financial assistance for
home mortgage down payments.
By far the largest entity under the HCR umbrella is the New York
State Housing Finance Agency (HFA), which is in the business of float-
ing “social bonds” to finance subsidized, income-restricted multifamily
apartment complexes. HFA has issued more than $31 billion in bonds
since 1960, including $1.1 billion in 2020 alone.
32
Its accumulated lia-
bilities total some $18 billion, as of February 2021. In effect, the HFA
functions as a state-owned bank dedicated to allocating capital for a
single purpose—subsidizing housing.
THE NEXT NEW YORK
108
SUGGESTED READING
Peter D. Salins and Gerald C.S. Mildner, Scarcity by Design: The Legacy of New York
City’s Housing Policies, Harvard University Press, Cambridge, MA, 1992
Howard Husock, The Poor Side of Town—and Why We Need It; Encounter Books, New
York, 2021
Howard Husock, America's Trillion-Dollar Housing Pollicy Mistake; Ivan R. Dee, Chi-
cago, 2003
Howard Husock, What is the Future of Public Housing in America’s Cities? American En-
terprise Institute, July, 2022
Howard Husock, “Ending NYCHA’s Dependence Trap,” Manhattan Institute for
Policy Research, September, 2019
Howard Husock, “Unlocking Public Housing’s Value,” City Journal, June, 2022
Howard Husock, “New York City’s Public Housing Fails the City’s New Poor,” Oc-
tober, 2017
Bernard H. Siegan, Land Use Without Zoning, Rowman and Littlefield/Mercatus Cen-
ter at George Mason University, March, 2021
William Fischel, “Zoning Rules! The Economics of Land Use Regulation,” Lincoln
Institute of Land Use Policy, Cambridge, MA, 2015
Jane Jacobs, Death and Life of Great American Cities, Modern Library, Random House,
New York, 1993
Nicholas Dagen Boom and Mathew Gordon Lasner, Affordable Housing in New York,
Princeton University Press, Princeton, New Jersey, 2016
David Autor, Christopher J. Palmer, and Parak A. Pathat, “Housing Market Spillo-
vers: Evidence from the End of Rent Control in Cambridge, Mass.”; National Bureau
of Economic Research, Cambridge, MA, June, 2012

Renewing and Reforming the Empire State
109
ENDNOTES
1
Eligibility for affordable and low-income housing units in New York is limited to tenants whose income
falls within a set percentage—typically 50 or 60 percent— of “area median income” based on family
size.
2
Ch. 36 of the Laws of 2019.
3
Texas Department of Housing and Community Affairs. “Basic Financial Statements Fiscal Year 2020,”
December 18, 2020. https://www.tdhca.state.tx.us/pdf/fa/20-BasicFinancials.pdf.
4
Florida Housing Finance Corporation. “2020 Financial Report,” 2021. https://www.floridahous-
ing.org/docs/default-source/data-docs-and-reports/finance/audited-financial-reports/2020-audited-fi-
nancial-statements.pdf?sfvrsn=65b3317b_2.
5
Press release at
https://hcr.ny.gov/governor-cuomo-launches-landmark-20-billion-plan-combat-homelessness-and-create-
affordable-housing
6
To cite one recent example: in the small city of Olean in western New York’s Cattaraugus County,
where the median 2021 home price was $125,000, the state in September 2022 announced the start
of construction on a 46-unit affordable housing complex with an estimated cost of $16 million—or
$347,826 per unit. See https://www.governor.ny.gov/news/governor-hochul-announces-start-construc-
tion-16-million-affordable-housing-development
7
New York State Department of Taxation and Finance. “Residential Median Sale Price Information by
County.” Accessed September 1, 2022. https://www.tax.ny.gov/research/property/as-
sess/sales/resmedian.htm.
8
Salins, Peter, and Mildner, Gerald C.S., “Scarcity by Design: The Legacy of New York City’s Housing
Policies,” Harvard University Press, 1992.
9
“Profile of Rent-Stabilized Units and Tenants in New York City.” New York University Furman Center.
Accessed September 1, 2022. https://furmancenter.org/research/publication/profile-of-rent-stabilized-
units-and-tenants-in-new-york-city.
10
Op cit Furman Center
11
The Housing Stability and Tenant Protection Act of 2019.
12
S.3082, 2021-2022 Session.
13
Husock, Howard. “The War on Landlords Continues.” City Journal, January 17, 2022.
https://www.city-journal.org/war-on-landlords-continues-with-new-york-state-good-cause-eviction-legisla-
tion.
14
US Census Bureau. “Building Permits Survey Annual Data 2021.” Accessed September 1, 2022.
https://www.census.gov/construction/bps/stateannual.html.
15
The eight states authorizing less new housing than New York from 2012 to 2019 were Rhode Island,
Connecticut, West Virginia, Illinois, Pennsylvania, Michigan, Ohio and Alaska.
16
US Census Bureau. “Building Permits Survey Annual Data 2021.”
17
Badger, Emily, and Quoctrung Bui. “Cities Start to Question an American Ideal: A House With a
Yard on Every Lot.” The New York Times, June 18, 2019. https://www.nytimes.com/interac-
tive/2019/06/18/upshot/cities-across-america-question-single-family-zoning.html,
18
Appelbaum, Binyamin. “Long Island, We Need to Talk (About Housing).” The New York Times, Feb-
ruary 24, 2022. https://www.nytimes.com/2022/02/24/opinion/long-island-housing.html.
19
Government Accountability Office. Low-Income Housing Tax Credit: Improved Data and Oversight
Would Strengthen Cost Assessment and Fraud Risk Management. GAO-18-637. Washington, D.C.:
Government Accountability Office. Accessed September 1, 2022. https://www.gao.gov/prod-
ucts/gao-18-637.
20
Department of Housing and Urban Development. “Assisted Housing: National and Local.” Accessed
September 1, 2022. https://www.huduser.gov/portal/datasets/assthsg.html.
21
Ch. 116 of the Laws of 1997
22
Husock, Howard. How New York’s Public Housing Fails the City’s New Poor. New York, NY: Man-
hattan Institute, 2017.
23
“Legislators aim to legalize underground basement apartments,” Crain’s New York Business, May 6,
2022. https://www.crainsnewyork.com/politics/officials-want-regulate-thousands-basement-apartments-
following-11-deaths-during-hurricane
24
Ch. 225 of the Laws of 2022.
25
Housing Authority of the County of San Bernardino. 2023 Moving to Work Annual Plan. San Ber-
nardino, CA: Housing Authority of the County of San Bernardino, 2022.

THE NEXT NEW YORK
110
26
U.S. Census Bureau. “QuickFacts: New York.” Accessed September 7, 2022. https://www.cen-
sus.gov/quickfacts/NY.
27
U.S. Census Bureau. “QuickFacts: United States.” Accessed September 7, 2022. https://www.cen-
sus.gov/quickfacts/fact/table/US/HCN010217.
28
Part AA of budget bills S.8006/A.9006
29
David M. Schwartz. “Here’s Why Most of Suffolk County Doesn’t Have Sewers.” Newsday, April
29, 2018. https://www.newsday.com/long-island/suffolk-clean-water-t23000.
30
Wright, Michael, “Streamlining SEQR.” Empire Center for Public Policy, December 16, 2013.
https://www.empirecenter.org/publications/streamlining-seqr/.
31
The city of Kingston in 2022 became the first municipality to opt into rent regulation for the first time
under the new law. Others reportedly were considering it.
32
New York State Housing Finance Agency. “2021 Fiscal Year Statutory Report,” February 1, 2022.
https://hcr.ny.gov/system/files/documents/2022/03/hfa-annual-report-2021-final.pdf.

9.
Taming a “Taylor Made”
Public-Sector Workforce
By Ken Girardin
The size and composition of state and local workforces is a major contributor
to the exceptionally high cost of New York’s public sector. The fiscal challenges
faced by state and local governments, along with many operational challenges,
stem directly from made-in-Albany public employment policies.
New York has more state and local government employees per capita (55 per
1,000 residents) than any other large state, and more than the nationwide average
(45 per 1,000), as shown in Figure 1. In 2021, about 1.2 million of payroll jobs in
New York—one in every seven—were in state and local government.
1
About half
of these public employees work for one of three entities: the City of New York,
the State of New York, or the Metropolitan Transportation Authority (MTA).
Measured by program category, public elementary and secondary schools ac-
counted for close to half of New York’s public payroll jobs (504,000).
The rules around public employment affect more than just the cost or quality
of services. Organized labor’s political power in New York is rooted in extensive
unionization of the public sector, both in isolation and as a share of the total.
Twenty-four percent of all public and private payroll jobs in New York were
covered by collective bargaining agreements in 2021—more than all but one state,
and double the national union coverage rate of roiughly 12 percent.
2
Fully half of
New York’s unionized jobs were in the public sector, including many middle-
management and supervisory titles.

THE NEXT NEW YORK
112
Nearly 71 percent of all public-sector jobs in New York were unionized, more
than double the national median of 28 percent. The resulting flow of taxpayer-
supported union dues nourishes a political apparatus that champions both in-
creased government spending and expanded intervention in the private economy.
But this situation is not irreversible. Legislative and administrative remedies exist
that would allow New York’s governor to meaningfully reduce both the cost of
government—and labor’s stranglehold on the Empire State.
THE STATUS QUO
Personnel costs are the single biggest expense at nearly every level of govern-
ment—with the exception of the state government, whose operating expenditures
consist largely of support for Medicaid and aid to school districts (which, in turn,
spend mostly on salaries and benefits). For local governments outside New York
City, the average share of expenditures covering employee wages, salaries and
benefits range from just over one-third for counties to nearly two-thirds of total
budgets for school districts (Table 1).
Table 1
Employee Compensation
Share of Spending by NY Government Level
School districts
a
64%
Cities
a
59%
Villages
47%
Towns
43%
New York City
48%
County governments
36%
State government
16%
a
Excluding New York City
Source: Office of State Comptroller, author's calculations
Subject to federal and state mandates, local officials get to decide how much
they spend for services, but the bang-for-buck quotient is ultimately shaped by
the state Civil Service Law, including provisions governing unionization and col-
lective bargaining law.
The New York State Constitution requires most government jobs be assigned
based on “merit and fitness,”
3
underpinning civil service rules that require the use
of written exams to measure qualifications, set hiring and layoff procedures, and
give due-process rights in discipline matters. State civil service law applies to most
employees of state agencies, public authorities, local governments, and school dis-
tricts. K-12 teachers and administrators and state university professors are cov-
ered by separate but similar rules.

Renewing and Reforming the Empire State
113
The civil service system, which dates to the late 19
th
century, has been slow to
adapt to 20
th
and 21
st
century needs. Prior to major reforms under the Pataki ad-
ministration in the 1990s, state agencies struggled to modify or eliminate positions
without having to also lay off employees. More recently, the drawn-out hiring
process complicated recruitment amid the tighter labor market as exam-takers
moved on to other employment and would-be applicants were skeptical about
taking a job from which they might be fired if three other people outperformed
them on a future exam.
An appreciation of this system is necessary because it represents the baseline
on which union agreements (discussed in detail below) are made. With few ex-
ceptions, New York public employees enjoy greater job security and safeguards
than any of their private-sector peers–and this is without considering the protec-
tions that have been layered on top by union contracts.
Beyond pressing for more favorable contract terms, public employee unions
are regularly pushing for advantageous changes to the civil service law. Because
such changes raise the floor from which they negotiate. For instance, a 2020 pro-
posal would have required almost any public employee facing discipline to be put
on paid leave while charges were pending, unless the union contract required oth-
erwise.
While the civil service law is a complex and important system, it does not affect
public employment to nearly the same extent as the collective-bargaining regime
the Legislature has grafted on top of it.
The Taylor Law
New York routinely ranks among the most unionized states, in no small part
because of the size, and extensive unionization, of its public-sector workforce.
Relative to population, as shown in Figure 2 below, New York has significantly
more total state and local employees than any of the nation’s largest states, and is
well above the national average.
THE NEXT NEW YORK
114
Virtually all public school teachers, approximately 94 percent of New York
state government employees,
4
and 95 percent of New York City employees
5
are
unionized, with nearly all the remaining workers in positions that make them in-
eligible. Police officers, corrections officers, and paid firefighters are almost uni-
versally unionized, as are the general municipal employees in most cities and coun-
ties. All told, about 71 percent of all public employees in New York are repre-
sented by a labor union.
4
While federal law controls labor relations in the private sector, New York’s
state and local public employees bargain under its public-sector collective bargain-
ing law, the Taylor Law. (Most New York City employees are covered by the city’s
own bargaining rules, with the city’s teachers being the most notable exception
subject to the Taylor Law).
The difference between public- and private-sector union relations, particularly
in New York, cannot be overstated. Public employee unions in many cases arrived
at the bargaining table in the 1960s and 1970s far ahead of their private-sector
peers, already enjoying job security, retiree healthcare, and defined-benefit pen-
sions, among other things.
While the right of private-sector workers to form and join labor unions was
guaranteed by the state constitution in 1938, New York State law over two dec-
ades following World War II did not establish any guidelines for dealing with the
burgeoning union movement in government. It allowed managers to fire strikers,
and stripped strikers of any tenure protections and barred them from getting any
immediate financial benefit from the strike. This made settlements more difficult.
In 1958, then-Mayor Robert Wagner issued an executive order granting collec-
tive bargaining rights to New York City employees — although the order did not
initially cover teachers, whose newly formed union won the same rights after stag-
ing a walkout in 1960. The city’s crippling transit strike of 1966, staged by a union
that had organized subway workers when much of the system was still privately
controlled, was cited by Governor Rockefeller as justification for rethinking state
laws on public-sector collective bargaining.
Under Rockefeller’s prodding, the Legislature in 1967 adopted the Public Em-
ployees’ Fair Employment Act (Article 14 of the Civil Service Law). The state’s
previous draconian strike penalties were eased (though strikes remained illegal),
and a system was created for holding elections and recognizing employee unions,
requiring public employers to negotiate with them, and for resolving disputes. The
law became known as the Taylor Law, after Wharton professor George Taylor,
who helped craft it.
The Taylor Law obligates employers to deduct union dues from the paychecks
of workers covered by union contracts.
5
In recent years, these deductions have
totaled about $700 million annually. The Taylor Law framers viewed dues privi-
leges as a lucrative incentive to discourage strikes. The money collected under the
Taylor Law feeds a continual cycle in which the unions use political influence (and
money) to win more favorable provisions from the Legislature, which in turn
gives them more influence and resources.
As explained below, instead of requiring employers to bargain specifically over
wages and benefits, the Taylor Law treated union negotiations as an open-ended
proposition—anything that wasn’t expressly determined by state law was figura-
tively on the table, in hopes of keeping talks from breaking down. With little by
Renewing and Reforming the Empire State
115
way of legal guardrails, New York’s elected leaders were free to trade away their
managerial authority in the name of “labor peace.”
The regulatory structure
The Taylor Law created the state Public Employment Relations Board (PERB)
to regulate the negotiation process, oversee unionization elections, and provide
mediation services. PERB’s three members, appointed by the governor subject to
Senate confirmation, serve six-year terms. The governor designates one board
member as the PERB chairperson, who acts as chief executive of an agency staff
of about 30.
PERB’s most important function is arguably its ability to decide which terms
and conditions of employment must be negotiated, may be negotiated, or may
not be negotiated, the last case being when such negotiations would conflict with
another section of state law.
For instance, an employer must negotiate when it wants to change a unionized
employee’s rate of pay. An employer may negotiate how overtime is assigned. And
an employer may not negotiate over pension benefits, which since the early 1970s
have been determined solely by state law. (A separate agency, the New York City
Office of Collective Bargaining, performs a subset of PERB’s duties for New
York City unions).
PERB for its entire history has taken a position that more negotiation is better
than less, leaving management with less discretion. Over the course of 55 years,
the Taylor Law has been expanded beyond anything its framers had in mind. What
follows is a description of some areas in which the playing field has tilted most
decisively to favor unions and against the interests of management and taxpayers.
o Disciplinary procedures—Union contracts are allowed to have discipli-
nary matters decided by unelected arbitrators instead of elected officials,
going far beyond the already-strong due process protections granted by
the civil service law. A 2011 New York Times investigation of state homes
for the developmentally disabled found the state’s arbitration rules had
prevented officials from firing employees in 99 out of 129 reviewed
cases.
6
More recently, union records revealed that arbitration had pre-
vented termination of workers who had forged time records, violently at-
tacked a resident in a state-run home, viewed pornographic material at
work, and committed other serious offenses.
7
Disciplinary arbitrations
can be slow and extremely costly, prompting officials to avoid trying to
terminate bad actors altogether. While state courts have affirmed that
elected officials and their appointees, not contract provisions, have the
last word in police discipline cases in the City of New York and some
municipalities, state agencies would face arbitration in attempting to ter-
minate many if not most employees.
o “Unit work”—PERB has given unions veto power over any effort that
would transfer work done exclusively by members of a particular public-
sector union to a private contractor or even other public employees who
are not represented by the same union. This means even if an employee

THE NEXT NEW YORK
116
retires, employers often must hire a new union-represented person rather
than shift responsibilities to other employees or vendors. The New York
City Transit Authority, which operates the city subway, had to get per-
mission from the Transport Workers Union merely to have stations
deep-cleaned by a contractor. PERB has explicitly ruled that “improved
service” does not justify taking away work from unionized employees.
8
o Minimum staffing—Union contracts, particularly for police and fire
employees, sometimes require municipalities to employ a minimum num-
ber of uniformed employees or to have a minimum number working at
any time. This is an especially costly requirement for municipalities where
the need for fire protection has changed as populations have declined and
building standards have improved.
o Union privileges—PERB (enabled by the state Legislature) has gone far
beyond allowing unions to negotiate for employee benefits by allowing
unions to demand—and friendly officials to grant—benefits for the un-
ion itself. PERB allows contracts to require paid union release time for
union officers and their designees, allowing them to perform union work
(or campaign for political candidates) during work hours without having
to reimburse the employer. Other contract provisions force employers to
deduct and remit funds to union political action committees, meaning
taxpayers absorb the administrative cost of their political fundraising.
In addition, PERB has held that an employer must continue providing a ben-
efit, even if that benefit was being conferred improperly or without legal authori-
zation, if employees have a reasonable expectation that it will continue. Moreover,
both PERB and state courts have together developed a complex patchwork of
instances when policies affecting retired government workers must be negotiated.
Applying union contracts to former employees presents myriad practical issues:
retirees, for one thing, don’t vote on the deals.
The Legislature excluded pension benefits from union negotiations in 1973,
but PERB has ruled unions and employers can still negotiate over retiree health
benefits—an open-ended proposition with costs far outlasting any one contract.
Pushbacks and poor data
New York’s adversarial approach to public-employee labor relations is funda-
mentally biased against smaller local governments, which lack the resources to
adequately challenge the state’s worst rules. When a local government pushes back
and tries to assert management’s rights on a particular issue, it must assume the
legal costs, and risks, of rolling the dice on challenging PERB in court. Officials
must go it alone, even if other municipalities would benefit if they prevail. But
when local disputes arise, large parent unions have an interest in pushing for more
favorable precedents that can benefit hundreds of bargaining units all at once.
For example, in 2007, former Mayor Brian Stratton of Schenectady (population
67,000) launched what would become a decade-long battle to reclaim disciplinary
powers over the city’s troubled police department. Forced to keep several sus-
pended officers on the payroll while the dispute was litigated in state courts, the

Renewing and Reforming the Empire State
117
city’s eventual victory at the Court of Appeals came at a price of well over $1
million in combined payroll and legal costs. And the small city of Watertown
(population 25,000) spent four years and more than $850,000 in legal costs
fighting to overturn a contract provision that required the city to have 15 fire-
fighters on duty.
9
The city ultimately had to pay an additional $130,000 penalty.
10
PERB’s discretion is quite broad. Any effort to make either the state workforce
or New York’s public sector in general more efficient runs through PERB. The
PERB chair, a gubernatorial designee, has significant discretion over the agency’s
staff and operations.
11
Besides making rulings about the Taylor Law, PERB has a statutory responsi-
bility to “make studies and analyses of, and act as a clearinghouse of information
relating to, conditions of employment of public employees throughout the
state.”
12
But in recent years it increasingly has failed to live up to this mandate.
PERB’s budget in fiscal 2023, just under $3.8 million, is more than 33 percent
below its fiscal 1999 level on an inflation-adjusted basis—even though, in that
time, the board has absorbed the responsibilities of a smaller agency that adjudi-
cates private-sector labor matters, increasing its workload without a commensu-
rate increase in resources. Under former Chair Michael Cuevas, who left the post
in late 2006, PERB reviewed contracts and identified trends, giving public em-
ployers a better read on the reasonableness of union demands. But the board
ceased compiling and releasing such information; indeed, its research capabilities
are so diminished that the agency presently cannot say how many unions in New
York are covered by the Taylor Law.
13
The lack of data and transparency at the state level puts municipalities at a
disadvantage. About half of the state’s roughly 5,300 union contracts in force to-
day were negotiated by local chapters of two large unions, CSEA and NYSUT.
This means union negotiators arrive at the bargaining table already possessing
necessary information about regional trends and emerging issues.
PERB regulations require employers to submit ratified agreements to the
board within 15 working days. Yet out of more than 1,000 contracts that appear
to have been ratified during 2021, PERB has so far added just two to its online
contract database.
Triborough Trouble
PERB in 1972 held that the Triborough Bridge and Tunnel Authority could
not suspend or change mandatory subjects of bargaining, such as pay and benefit
levels, after a contract expired.
14
This became known as “Triborough doctrine.”
With favorable contract provisions effectively locked in place, the Triborough
doctrine meant unions no longer had an incentive to come to the table before a
deal expired. However, a crucial portion of the administrative finding was rolled
back under a 1977 ruling by the state Court of Appeals, which held that employers
could not be required to pay longevity-based raises, sometimes known as “step
increases” or “increments,” after expiration of a contract.
“To say that the status quo must be maintained during negotiations is one thing;
to say that the status quo includes a change and means automatic increases in salary
is another,” Chief Judge Lawrence Cooke wrote for a unanimous court.
15
Cooke’s

THE NEXT NEW YORK
118
opinion also warned that “in times of escalating costs and diminishing tax bases,
many public employers simply may not be able in good faith to continue to pay
automatic increments to their employees.”
16
In 1982, however, following heavy lobbying by public employee unions, the
state enacted what became known as the Triborough Amendment to the Taylor
Law, requiring employers to continue all terms and conditions of expired con-
tracts, including seniority-based raises.
17
The amendment weakened union incen-
tives to settle on new contracts before the expiration of an existing agreement—
especially in the case of teachers’ unions, whose contracts typically include 20 or
more years of longevity-based step increases of two to four percent in addition to
any negotiated base pay increases. (See Figure 3, below.)
The Triborough Amendment gives public employees an incentive to hold out
when management is seeking contract concessions. As one state worker put it
when his union was asked to ratify contract givebacks in 2011: “We have Tri-
borough … [so] why do this to yourself?”
18
In Buffalo, for example, public school
teachers enjoyed raises for over a decade during a prolonged contract impasse
between 2004 and 2016—holding out, among other things, against demands that
they give up their free elective cosmetic surgery benefit. Thanks to step increases
and other contract provisions, Buffalo educators (primarily unionized teachers,
with a smaller group of administrators) had pay increases averaging 33 percent
between 2007-08 and 2015-16—even though their contract had expired.
19
When
a successor deal was ratified in 2016, teachers got between $2,000 and $9,000 in
backpay as well as immediate 10 percent raises.
20
Binding arbitration
Beginning in 1974, in “temporary” statutory provisions that have been re-
newed every few years since, the Legislature authorized unions representing po-
lice, firefighters, New York City transit workers and certain corrections officers
the right to seek binding “interest arbitration” to settle contract impasses.
21
Renewing and Reforming the Empire State
119
Binding arbitration, like the Triborough Law, gives unions added reason to
hold out for more in negotiations. The result: pay for uniformed police and fire
employees increased at roughly three times the rate of other general government
employees in the 38 years after they received arbitration privileges.
22
Arbitration chairs—whose livelihood depends on the willingness of unions to
go along with their selection—have discretion in choosing the “comparables”
against which each municipality’s terms and conditions are evaluated. Unions nat-
urally seek to have their contracts compared with the most generous terms found
in other jurisdictions. This led to a ratcheting-up effect, especially in downstate
suburbs where town and village police departments are more numerous. Long
Island departments, in particular, face constant cost pressures due to such com-
parisons and the specter of arbitration. Salaries in some years have averaged over
$200,000 in a handful of small downstate police departments.
Governor Cuomo in 2013 proposed significant reforms for fiscally distressed
municipalities that would have capped at two percent the pay raises arbitrators
could award, with a similar cap on the employer share of healthcare costs. But the
governor ultimately abandoned that proposal, instead settling for token changes
to the law including a vague requirement for arbiters to give greater consideration
to a municipality’s ability to pay.
23
The second major problem with binding arbitration is that awards tend to be
limited to basic questions on pay and benefits. While managers may be looking to
negotiate work rule changes, any union with arbitration privileges can be confi-
dent that an impasse will result in raises with little else changing as arbiters avoid
being seen as too tough on labor. The binding arbitration provision is set to expire
in July 2023 for transit employees and in July 2024 for uniformed police and fire
departments employees statewide. Allowing it to expire would give mayors and
other local leaders greater power to demand not only fiscal reforms but also im-
provements to how departments run.
Between Triborough and impasse arbitration, the Legislature has tipped the
tables heavily in labor’s favor, making it more difficult for elected officials to ef-
ficiently deliver public services.
Cones of silence
Collective bargaining negotiations are conducted behind closed doors, mean-
ing the public is unaware of contract demands, proposals and counter-proposals
by either side. Contracts are often ratified before the public can understand or
even view them. Employers bringing a tentative agreement to a local legislative
body need not provide an estimate of the deal’s added costs. The rush to ratifica-
tion means officials sometimes make mathematical and other errors in legally
binding documents, on which the state places no maximum duration.
A 2005 Suffolk County grand jury, investigating financial irregularities in local
districts, found “an abject lack of transparency regarding the issue for which
school districts spend the overwhelming majority of their funds—salaries and
benefits for their employees.”
24
The grand jury recommended that state law re-
quire that “copies of all proposed school district collective bargaining agreements,
employment contracts or amendments to those contracts be placed on the school
THE NEXT NEW YORK
120
district web site, if existing, and within the local public libraries and school district
offices, at least one month prior to the board of education’s vote upon the con-
tracts or amendments.”
25
What’s more, the grievance adjustments and disciplinary determinations that
flow from the agreements—and essentially set government policy—are almost
never made public. The Taylor Law essentially imposes a second lawmaking pro-
cess on New York state and local government—without the accountability that
comes with elections.
MOVING FORWARD
The Taylor Law and administrative rulings have been major contributors to
New York State’s exceptionally high state and local taxes. Public-sector contracts
also stand as a major obstacle to efforts to improve the efficiency and quality of
public services. Reform priorities for the governor and Legislature:
• Make collective bargaining more transparent. Tentative agreements
should be published on the internet, along with detailed cost estimates and
fiscal impacts, for at least one month before they are ratified. For state gov-
ernment itself, the Office of Employee Relations should promptly publish
all documents relating to labor union grievances, past negotiations, and dis-
ciplinary disputes.
• Rejuvenate PERB to focus on the broad public interest. The governor
and state lawmakers should insist that the board lives up to its mandate to
provide research and analysis that can inform employers and the public.
This includes, first and foremost, collecting contracts as its regulations al-
ready require.
• Repeal the Triborough Amendment. Triborough and impasse
arbitration make it difficult, if not impossible, for elected officials to make
reasonable changes to how government operates. The Triborough
Amendment should be repealed to prevent pay raises from taking effect
after a contract has expired.
• Set limits on binding arbitration settlements. Before extending the law
past currently scheduled sunsets, the Legislature at a minimum should enact
Governor Cuomo’s original 2013 proposal to cap at two percent the cost
of pay and compensation increases, which would give unions more incen-
tive to negotiate in good faith.
• Limit the scope of collective bargaining. New York’s experiment with
open-ended bargaining has been not only expensive but has caused con-
tracts to co-opt decisions that should be made by elected officials. Matters
that aren’t directly related to wage and benefit levels, including discipline
and work rules, should be excluded from bargaining, as pension benefits
were in 1973.

Renewing and Reforming the Empire State
121
Appendix:
The State Government Workforce
State agency headcounts of full-time equivalent employees (FTEs) as
measured in mid-calendar year peaked at more than 256,000 under
Governor Mario Cuomo in the early 1990s, but declined to just over
224,000 during the first two terms of Governor George Pataki, who
took office in 1995. The FTE count began rising again in the final
years of Pataki’s third term, and continued increasing under Gover-
nors Eliot Spitzer and David Paterson, hitting its most recent peak of
232,000 in 2009, early in a two-year fiscal crisis brought on by the
Great Recession.
Taking office in 2011, Governor Andrew Cuomo undertook a credi-
ble effort to restructure state agencies and reduce payrolls. Among
other things, he consolidated back-office functions performed by sep-
arate department-based operations such as travel, accounting, and
human resources. Agencies instead became clients of a new Business
Service Center at the Office of General Services. A year later Cuomo
centralized IT personnel, then scattered across 37 agencies, into the
Office of Information Technology Services.
26
The state by 2020 had
reduced its I.T. headcount by nine percent and was operating with
one- third fewer I.T. managers.
27
In the spring of 2020, Cuomo or-
dered a hiring freeze (with exceptions) that remained in effect until it
was suspended by Governor Hochul in September 2021. During the
freeze period, FTE headcounts dropped substantially, to a new low
of just over 200,000 FTEs in mid-2022, as illustrated below.

THE NEXT NEW YORK
122
Excluding State University, City University and State Police employ-
ees, the headcount most directly controlled by the governor hovered
around 149,000 for several years, but sank below 142,000 by Janu-
ary 2021 and bottomed out at less than 134,000 a year later. Gover-
nor Hochul this year is aiming to add back about 12,000 state em-
ployees to these agencies.
28
The biggest employee relations challenges faced by New York’s gov-
ernor in 2023 will include:
• Managing remote work. A significant portion of the state’s
white-collar workforce continues telecommuting on a part-time ba-
sis under rules determined by each agency. It’s unclear how per-
formance is being measured, but given the state’s longstanding
challenges with employee discipline, it is likely there are areas that
require immediate—and resolute—attention.
• Ongoing negotiations with unions. Excepting the Civil Service
Employees Association and AFSCME Council 82 (senior correc-
tions officers), all state union contracts will have expired by the
end of 2023. CSEA secured across-the-board raises of 3 percent
for fiscal years 2024 through 2026 in addition to one-time bo-
nuses, and is generally seen as setting the pattern for other unions.
• Implementing COVID lessons. The inflexibility of the state work-
force was on display in the early days of the pandemic as the
state struggled to retask employees to urgent matters such as pro-
cessing unemployment claims. With agency headcounts down, the
governor will have an opportunity to further restructure and poten-
tially centralize state functions such as customer-service operations
that remain distributed across agencies.
The state workforce is not managed in a vacuum. It is constrained in
many ways by the same policies that affect counties, school districts,
cities, towns and villages. Any change to the Taylor Law or civil ser-
vice regulations increase the flexibility of the state workforce would
have separate—if not larger—benefits for local officials eager to re-
duce property taxes and improve service delivery.

Renewing and Reforming the Empire State
123
ENDNOTES
1
Quarterly Census of Employment and Wages, U.S. Bureau of Labor Statistics
2
New York’s sole union coverage rival among all states was Hawaii, whose travel and leisure sector is
heavily unionized. Hawaii’s union ocverage rate of 24.1 percent was statistically indistinguishable from
New York’s 24 percent.
3
NYS Constitution, Article V, Section 6
4
Hirsch, Barry and David Macpherson, “Union Membership, Coverage, and Earnings from the CPS,”
UnionStats.com
5
CSL §208(1)(b)
6
Hakim, Danny, “At State-Run Homes, Abuse and Impunity,” New York Times, 12 Mar 11
nytimes.com/2011/03/13/nyregion/13homes.html
7
Girardin, Ken, “Double Insulation,” Empire Center, 2020. empirecenter.org/publications/double-insu-
lation
8
25 PERB ¶3081 (1992)
9
nny360.com/city-attorney-will-soon-part-ways-in-fire-department-case/article_f5b56f7d-788d-5132-
8110-3d85cfb6981e.html
10
Higgins, Oniqua, “Watertown and Fire Union Staffing Battles End,” Spectrum News, 14 Nov 19.
spectrumlocalnews.com/nys/buffalo/news/2019/11/14/watertown-fire-department-settlement-
11
As of the fall of 2022, it appeared all three members of PERB had “holdover” status, meaning they
have not been confirmed by the Senate to full terms. The last Senate confirmation of a PERB member
appears to have taken place in June 2016, when former NYSUT attorney John Wirenius was con-
firmed as board chair.
12
CSL §205(5)(e)
13
A statistical table on the agency’s own website, which presented complete numbers for negotiating
units and negotiable contracts as recently as 2018-19, has the notation “data not provided by public
employers and employee organizations” for the last three years. https://perb.ny.gov/perb-by-the-
numbers/
14
5 PERB ¶3037 (1972)
15
Board of Cooperative Educational Services v. New York State Public Employment Relations Board,
41 N.Y.2d 753, 363 N.E.2d 1174, 395 N.Y.S.2d 439 (N.Y. 1977)
16
Board of Cooperative Educational Services v. New York State Public Employment Relations Board,
41 N.Y.2d 753, 363 N.E.2d 1174, 395 N.Y.S.2d 439 (N.Y. 1977)
17
CSL §209-a(1)(e)
18
“PEF Deal Matches CSEA’s, To Dismay of Its Members,” The Chief, Aug. 1, 2011, p. 1.
19
Girardin, Ken, “Buffalo’s Murky Teacher Pact,” Empire Center, 18 Oct 16. empirecenter.org/publi-
cations/buffalos-murky-teacher-pact
20
Lankes, Tiffany and Jay Rey, “Teacher contract boosts pay, ends cosmetic rider,” The Buffalo News,
17 Oct 16. buffalonews.com/news/local/education/teacher-contract-boosts-pay-ends-cosmetic-rider/ar-
ticle_a9661016-ab84-5f19-991e-a7bfce898cb7.html
21
CSL §209(4) and (5). The Taylor Law did not originally provide for compulsory binding arbitration
of contract impasses. The panel of labor experts who drafted the original law said that “would be det-
rimental to the cause of developing effective collective negotiations,” and predicted: “The temptation in
such situations is simply to disagree and let the arbitrator decide.” (See State of New York, Governor’s
Committee on Public Employee Relations, Final Report, March 31, 1966, as reprinted in Jerome Lefko-
witz, Melvin H. Osterman and Rosemary A. Townley, eds, Public Sector Labor and Employment Law,
Second Edition, New York State Bar Association (1998), 60.
22
McMahon, EJ and Michael Wright, “Police and Fire Pay Keep Rising, Benefits Sticky Under Arbitra-
tion,” Empire Center, 9 May 13

THE NEXT NEW YORK
124
23
McMahon, E.J, “Cuomo backpedals on binding arbitration,” Empire Center, 18 June 13. empire-
center.org/publications/cuomo-backpedals-on-binding-arbitration
24
Suffolk County Court Special Grand Jury, Sept. 19, 2005 Term IE, CPL Section 190.85(1)(C), Grand
Jury Report Dated: June 26, 2006, page 188.
25
Suffolk County Court Special Grand Jury, Sept. 19, 2005 Term IE, CPL Section 190.85(1)(C), Grand
Jury Report Dated: June 26, 2006, page 195.
26
“Testimony of Brian D. Digman, State Chief Information Officer and Director NYS Office of Infor-
mation Technology Services,” NYS Senate, 6 Feb 13. nysenate.gov/sites/default/files/articles/attach-
ments/6-%20Office%20for%20Technology.pdf
27
“New York State Workforce Management Report,” NYS Dept. of Civil Service, 2020.
cs.ny.gov/businesssuite/docs/workforceplans/2020.pdf#page=101
28
“FIRST QUARTERLY UPDATE TO THE FY 2023 ENACTED BUDGET FINANCIAL PLAN,” NYS Divi-
sion of the Budget, p. 138. budget.ny.gov/pubs/archive/fy23/en/fy23en-fp-q1.pdf#page=138
10.
Opening a Wider Window
on New York Government
By Cameron Macdonald
Accountable government starts with transparency. Voters cannot evaluate
their government without knowing what it is doing, and why.
To prevent elected officials and government agencies from avoiding account-
ability, New York’s transparency laws should be reformed to increase transpar-
ency—using the latest technological tools—and to eliminate practices that dis-
courage public participation in government.
New York took its first significant step towards greater transparency in 1974
with the enactment of its Freedom of Information Law (FOIL). In the law’s open-
ing paragraph, the Legislature declared:
“[A] free society is maintained when government is responsive and responsible to
the public, and when the public is aware of governmental actions. The more open a
government is with its citizenry, the greater the understanding and participation of
the public in government...”
“The people’s right to know the process of governmental decision-making and to
review the documents and statistics leading to determinations is basic to our society.
Access to such information should not be thwarted by shrouding it with the cloak of
secrecy or confidentiality. The legislature therefore declares that government is the
public’s business and that the public, individually and collectively and represented by
a free press, should have unimpaired access to the records of government …”
1
Two years after becoming one of the first states to pass a government trans-
parency law in the wake of the Watergate scandal, New York was among the last
two states to pass an Open Meetings Law.
2
Here again, the Legislature began with the best of intentions, declaring it “es-
sential to the maintenance of a democratic society that the public business be
performed in an open and public manner and that the citizens of this state be fully
aware of and able to observe the performance of public officials and attend and
listen to the deliberations and decisions that go into the making of public policy.”
3
The FOIL statute and the Open Meetings Law taken together marked a strong
presumption of public access to government records and decision-making. But
both laws required amendments over time as agencies resisted disclosure and
technology changed.
THE NEXT NEW YORK
126
STATUS QUO
The 1974 version of FOIL focused on categories of records state and local
government agencies needed to make available for public inspection and copying.
Those categories included final opinions in adjudicatory matters, policy state-
ments or interpretations and documents and data underlying them, minutes of
meetings and public hearings, internal and external audits and statistical or factual
tabulations, staff manuals and instructions to staff that affect the public, and po-
lice blotters. The law also required each agency to create an itemized record con-
taining the name, address, title, and salary of every agency officer and employee,
with certain access restrictions to law enforcement records.
4
Repeal and replacement
By 1977, the Legislature had recognized the limits of transparency under the
existing law and repealed and rewritten the original FOIL to presume that all rec-
ords would be publicly available unless one of enumerated exceptions applied.
5
The core exceptions from disclosure remain in place today, covering records that:
o are exempt from disclosure under state or federal law;
o if disclosed would be an unwarranted invasion of personal privacy;
o if disclosed would impair present or imminent contract awards or collec-
tive bargaining negotiations;
o are trade secrets or sensitive commercial information submitted to an
agency;
o are compiled for law enforcement purposes;
o if disclosed could endanger the life or safety of any person;
o are inter-agency or intra-agency materials which are not statistical nor fac-
tual data, instructions to staff that affect the public, final agency policy or
determinations, or external audits, or
o
include examination questions or answers for an exam not yet adminis-
tered and final.
6
Unfortunately, agencies aiming to avoid disclosure of certain information have
taken aggressive approaches to claiming records fall under one of these excep-
tions, causing records to be withheld entirely or redacted to a point of being use-
less to the public.
7
Notable amendments since 1977
In making all records available to the public, the 1977 update to FOIL added
timeframes for disclosure that assumed agencies would disclose records within
five business days. If unable, agencies were to provide an approximate date for a
response.
8
The Legislature amended FOIL in 2005 to codify case law that had established
the approximate date for responding to a request must “be reasonable under the
circumstances of the request.” Further, any agency requiring over 20 business days
Renewing and Reforming the Empire State
127
to respond after acknowledging a request needed to explain the reason for delay
and provide a date certain for the response.
9
The 2005 FOIL changes also codified the concept of constructive denial,
which permits a requester to take an administrative appeal and resort to the courts
if an agency does not meet FOIL’s deadlines.
10
Courts have always been the ultimate arbiter of FOIL disputes. The Legislature
added a provision in 1982 to allow them to award prevailing requesters attorney’s
fees and other litigation costs “to create a clear deterrent to un-reasonable delays
and denials of access [and] encourage every unit of government to make a good
faith effort to comply with the requirements of FOIL.”
11
The Legislature noted
that “[c]ertain agencies have adopted a ‘sue us’ attitude in relation to providing
access to public records.”
12
Amendments to FOIL’s attorney’s fees provisions in 2006 and 2017 were de-
signed to increase the likelihood of attorney’s fee awards.
13
But resorting to the
courts is a significant financial commitment, even for a self-represented individ-
ual, at a risk of a court in its discretion not awarding fees and costs. Thus, agencies
can take a “sue us” attitude with little downside risk.
Changing technology
FOIL contains a broad definition of “record” to include “any information
kept, held, filed, produced or reproduced by, with or for an agency or the state
legislature, in any physical form whatsoever.” The information’s content or pur-
pose is irrelevant to being within FOIL’s scope.
14
But an agency need not create
records from information it possesses, including from electronically stored data.
In 2008, the Legislature codified case law and updated FOIL’s provisions to
reflect the new electronic age to counter government arguments that retrieving
data was creating a record. The amendments clarified that any programming re-
quired to retrieve electronic records is not the creation of a record.
MOVING FORWARD
Records received too late for them to be useful or so heavily redacted as to not
convey meaningful information frustrate government accountability. To live up
to the promise of making government “responsive and responsible to the public,”
New York’s FOIL provisions should be updated and reformed to:
• Mandate more proactive disclosure. The original 1974 FOIL contained
a version of proactive disclosure requiring every state and local agency to
have six categories of records ready for inspection and copying by the pub-
lic. It also required agencies to create a record of agency employee names,
titles, and salaries for the public to access. The Legislature should go back
to the beginning and codify more proactive disclosure in FOIL, especially
given today’s technology. Lawmakers took a related step in 2021 with pas-
sage of the Metropolitan Transportation Authority Open Data Act,
15
which
gave the MTA 180 days to create a catalogue of its “publishable data” and
schedules for publishing such data. Since the law went into effect, MTA has
THE NEXT NEW YORK
128
added 50 new databases to the state’s open data website.
16
The MTA law is
a “win-win” approach, since posting documents and data on agency web-
sites obviates the need for the public to request them via FOIL. It also re-
duces the volume of FOIL requests an agency must handle.
17
Taking ad-
vantage of free, widely available Internet programs or even social media
services, a government agency or local government of any size can pre-
emptively disclose a wide variety of records. For larger amounts of data,
terabytes of cloud storage can be obtained for less than $100 a year.
18
And
some agencies can add proactive disclosure by enhancing their existing sys-
tems; for example, the state comptroller maintains a searchable database of
state contracts at Open Book New York
19
that can be improved with links
to electronic copies of the contracts themselves.
Every level of New York government should index and post its contracts
and bidding for those contracts online. Agencies should also disclose pay-
rolls and budgets on their websites. Florida posts its state government pay-
roll online and so should New York.
20
Every local government should have
prominent links on their homepages to updated payroll information and
current budgets. Agencies and municipalities should further post and regu-
larly update their organizational charts.
21
• Set firmer deadlines for FOIL responses. The requirement that agencies
at first respond to FOIL requests within five business days hasn’t had the
intended effect. On-time acknowledgments often precede months of delay.
FOIL should provide more time for an initial response—for example, two
weeks—but make it tougher for agencies to impose delays beyond that initial
period. Within two weeks, agencies should be requirement to either disclose
the records, or certify that none exist, or highlight shortcomings in the re-
quest. Additional time periods should be limited to 20 business days from
receipt of the request, with any additional delay requiring a written explana-
tion and a firm date certain for a response—not (to cite a frequent current
stalling tactic) a time in the future for an update on the status of the request.
Imposing firm deadlines on agencies draws obvious lines for requesters to
seek remedies in court and judges to award attorney’s fees when lawsuits
become necessary. Accountability can be enhanced by mandating that agen-
cies track FOIL requests and responses in real time in an online database.
•
Improve the dispute resolution process. In 1982, FOIL was amended
to allow judges to award attorney’s fees and litigation costs to requestors
who take agencies to court and win if unreasonably denied access to rec-
ords.
22
But getting to court currently begins with a flawed process because
the initial, administrative adjudication is done by the agency denying the re-
quest. To avoid this, appeals should be routed directly to a third-party
agency tasked with promoting government transparency. Such an agency
can mediate disputes, provide consistent determinations, and flag issues
that may require FOIL amendments
.
23
Renewing and Reforming the Empire State
129
• Fix bad precedents. The Legislature recognized transparency can’t be ab-
solute when it repealed and replaced FOIL in 1977. Agencies may need to
assert legitimate exceptions at times. Over time, however, FOIL exceptions
have been distorted into loopholes used to keep valuable information from
the public. Vendors contracting to provide goods and services to the state,
for example, have critical contract terms withheld from the public as confi-
dential commercial information. Agencies also abuse FOIL’s “deliberative”
intra- or inter-agency materials exception. Intended to encourage the free
flow of ideas in decision-making, it's now used to withhold entire drafts of
government documents, including reports and data analyses. FOIL should
limit the exception to objectively candid opinions necessary to the free flow
of ideas and should not include records like consultant reports that under-
pin decision-making. The Legislature needs to make clear within FOIL to
agencies and the courts that exceptions to disclosure should be rare
through revisions to the exceptions that make them harder to apply.
• Increase access to public meetings. The Open Meetings Law only re-
quires state agencies to broadcast or transmit public meetings “to the extent
practicable and within available funds.” An executive order issued in the
early stages of the Covid-19 pandemic required all public bodies to broad-
cast or transmit their meetings.
24
The result: public bodies at all levels, not
just the state, demonstrated that available technology makes broadcasting
or transmitting public meetings possible for every type of agency. Broad-
casting or transmitting public meetings should be mandatory for all bodies
under the Open Meetings Law’s jurisdiction.
In a provision set to expire on July 1, 2024, the Legislature has permitted
public bodies to use videoconferencing as allowed by a local law or resolu-
tion, provided the public body has a quorum present in a physical location
or locations where the public can attend. Members of public bodies may at-
tend via videoconference in extraordinary circumstances,
25
and the public
must be able to view a videoconference meeting by video. Video confer-
encing must allow for the same public participation through public com-
ment or testimony as in person.
26
The Committee on Open Government is
supposed to report on the videoconferencing provisions of the law and
make further recommendations by January 1, 2024.
27
Ideally before but no
later than 2024, the Legislature should mandate videoconferencing for pub-
lic meetings at all levels of government to encourage greater public partici-
pation.
• Define “meetings” in 21st century terms. The Open Meetings Law de-
fines a meeting as “the official convening of a public body for the purpose
of conducting public business.”
28
That made sense when “meeting” meant
an in-person gathering. But in 2022, group emails, texts, and messaging
platforms are among the places where deliberations can happen hidden
from the public. Consistent with its stated purpose of making sure citizens
can “attend and listen to the deliberations and decisions that go into the

THE NEXT NEW YORK
130
making of public policy,”
29
the Open Meetings Law needs to be revised to
adapt to such new technologies, and to cover all the ways in which “meet-
ings” can now occur.
ENDNOTES
1
L. 1974, ch. 578, § 2.
2
Bill Jacket, L. 1976, ch. 511, Assembly Mem. In Support, p.1.
3
L. 1976, ch. 511, § 1.
4
L. 1974, ch. 578, § 2.
5
L. 1977, ch. 933, § 1.
6
Public Officers Law, § 87(2).
7
For example, in 2020, bidders on a multi-billion-dollar offshore wind project submitted proposals so
heavily redacted the bids were impossible for the public to compare and evaluate. See 2020 Offshore
Wind Solicitation (Closed), NYSERDA, State of New York, accessed October 10, 2022,
https://www.nyserda.ny.gov/All-Programs/Offshore-Wind/Focus-Areas/Offshore-Wind-Solicita-
tions/2020-Solicitation.
8
L. 1977, ch. 933, § 1.
9
L. 2005, ch. 22, § 1.
10
Id.
11
Bill Jacket, L. 2006, ch. 492, Senate Introducer's Mem. in Support, p. 5.
12
Bill Jacket, L. 1982, ch. 73, Assembly Mem. in Support, p. 1.
13
L. 2006, ch. 492, § 1; L. 2017, ch. 453, § 1.
14
Matter of Capital Newspapers, Div. of Hearst Corp. v. Whalen, 69 N.Y.2d 246, 253 (1987).
15
L. 2021, ch. 482, § 3.
16
“Open NY,” State of New York, accessed October 10, 2022, https://data.ny.gov/browse?Dataset-
Information_Agency=Metropolitan%2BTransportation%2BAuthority&category=Transporta-
tion&utf8=%E2%9C%93&sortBy=newest.
17
Another example of proactive disclosure can be found on the website of Florida governor’s office
(https://www.flgov.com/open_government/) which provides links to its responses open records re-
quests, organized by month. What the website may lack in user friendliness it makes up in the time
saved on record searchers, which can be completed in minutes or hours versus days or weeks under a
FOIL request.
18
Steven J. Vaughan-Nichols, “Best Cloud Storage 2021: Expert Services and Pricing,” ZDNet, July 7,
2022, accessed October 10, 2022, https://www.zdnet.com/article/best-cloud-storage.
19
https://www.osc.state.ny.us/open-book-new-york
20
“State of Florida Employee Salaries,” State of Florida, accessed October 10, 2022, https://sala-
ries.myflorida.com.
21
See, eg., “Executive Office of the Governor Organizational Chart,” State of Florida, accessed Octo-
ber 10, 2022, https://www.flgov.com/wp-content/uploads/2022/08/EOG-Org-Chart-7-28-22.pdf;
“Governor’s Office Organizational Chart, “State of California, accessed October 10, 2022,
https://www.gov.ca.gov/orgchart.
22
L. 1982, ch. 73.
23
See, e.g., “About the Office of Open Records,” Commonwealth of Pennsylvania, accessed October
10, 2022, https://www.openrecords.pa.gov/AboutOOR.cfm.
24
Executive Order No. 202.1: Continuing Temporary Suspension and Modification of Laws Relating to
the Disaster Emergency, Governor Andrew M. Cuomo, March 12, 2020, accessed October 10, 2022,
https://govt.westlaw.com/nycrr/Docu-
ment/I6f220a46e23411ea942fb02e02de8851?viewType=FullText&originationContext=docu-
menttoc&transitionType=CategoryPageItem&contextData=(sc.Default)
25
Public Officers Law § 103-a(2).
26
Id.
27
Public Officers Law §103-a(4).
28
Public Officers Law § 102.
29
Public Officers Law § 100.
11.
Voter Access,
Election Integrity
By Kenneth Moltner
New York State’s long-standing voting rules, campaign finance guidelines, and
election schedules have been modified significantly in the past 20 years. Although
New York voters in 2021 rejected constitutional amendments proposed by law-
makers to rewrite election rules, other changes they have enacted in recent years
could pave the way for still more radical changes disrupting the always-delicate
balance of voter access, ballot security and election fairness.
The current era of election law changes began in 2002 with passage of the
federal “Help America Vote Act,” which prompted New York to end its long-
standing reliance on mechanical-lever voting machines and shift to computer-
scanned paper ballots, a transition that began in 2003.
1
More significant—and costly—moves by New York lawmakers would follow.
THE STATUS QUO
In 2019, New York State enacted a series of changes in its election calendar,
including nine days of early voting
2
and the establishment of a single June primary
date for both state and federal elections.
3
In response to the COVID-19 pandemic starting in the spring of 2020, Gov-
ernor Cuomo issued an emergency order suspending and modifying a wide range
of state laws, including those governing elections. The most significant, in terms
of its measurable outcome, affected the rules for absentee voting.
Prior to the pandemic, the casting of absentee ballots as an alternative to in-
person voting has been treated in New York as an exception permissible only
under limited conditions.
4
Article II, Section 2 of the state Constitution authorizes
the Legislature to “provide a manner” for the casting of ballots when voters are
either “absent” from their home county on election day or “unable to appear
personally at the polling place because of illness or physical disability.”
However, notwithstanding the constitutional provision, Governor Cuomo’s
pandemic emergency order allowed New Yorkers to apply for absentee ballots in
primary and general elections without having to cite any justification or excuse.
The unsurprising result: while absentee ballots typically made up four to 10 per-
cent of the total cast in contested races in years prior to the pandemic, that per-
centage jumped sharply in 2020—to record levels of more than 20 percent in
many jurisdictions, including 24 percent of all votes cast in New York City.
Meanwhile, via joint resolutions of the Assembly and Senate, the Legislature
proposed permanent fundamental changes to both election rules and the decen-
nial legislative redistricting process via amendments to the state Constitution.
THE NEXT NEW YORK
132
Submitted for voter approval in the November 2021 general election, the amend-
ments included:
o Proposal 1, which would have weakened the bipartisan apportionment
and redistricting reforms approved by voters in 2014.
o Proposal 3, which would have deleted the Constitution’s requirement that
citizens be registered to vote at least ten days before an election, allowing
the Legislature to enact different deadlines.
o Proposal 4, which would effectively have authorized an unlimited absen-
tee ballot option for all voters in all elections, without requiring any justi-
fication or excuse.
On election day, the three proposals were rejected by pluralities of 54 to 56
percent.
Just two months after no-excuse absentee balloting had been rejected by vot-
ers, and nearly two years since the start of the pandemic, Governor Hochul cited
the continuing spread of COVID-19 as justification for signing an election law
amendment
5
that extended, through 2022, access to absentee ballots to anyone
worried about the “risk of contracting or spreading a disease that may cause illness
to the voter or other members of the public.” That change and others in the
amendment were unsuccessfully challenged in subsequent lawsuits filed in state
Supreme Court by, among others, the state Republican and Conservative Party
chairs. At least some absentee ballots cast under the more permissive rule were
counted in New York’s November 8 elections.
A few months later, in June 2022, the governor signed the John R. Lewis Vot-
ing Rights Act of New York,
6
the stated purpose of which was to “ensure that
eligible voters who are members of racial, color, and language-minority groups
shall have an equal opportunity to participate in the political process of the state
of New York, and especially to exercise of the elective franchise.”
7
Under the new
law, ranked-choice voting, which had been implemented in New York City be-
ginning with the June 2021 primary election, would qualify as an “alternative”
method of election that a court could impose on the state upon finding a violation
of that act.
8
In a spring 2020 move with a delayed impact, the Legislature and Governor
Cuomo enacted a voluntary public campaign finance program
9
under which can-
didates for state legislative and statewide offices can receive multiple taxpayer-
funded matches of small donor contributions, starting with legislative races in
2024 and statewide elections in 2026.
Amid these significant changes, one key aspect of New York election law was
left unchanged: New Yorkers are not required to provide proof of identify when
they show up at the polls on election day, unless voting for the first time without
having provided valid identification at the time of registration. The standard meas-
ure for confirming a voter’s identification remains a simple visual comparison of
signatures.
On another election-related issue, Governor Hochul used her first State of the
State address in January 2022 to express support for a two-term limit for statewide
elected officials, which would require amending the state Constitution. This was
a purely symbolic stance, however, since (other than at a constitutional
Renewing and Reforming the Empire State
133
convention) proposed amendments can only be initiated by joint legislative reso-
lutions of the state Assembly and Senate, with no involvement by the governor.
Hochul’s term-limit proposal was ignored by the Legislature, where majority con-
ferences have never given serious consideration to any such proposed limitation
for any state office.
MOVING FORWARD
Advocates of New York’s recent series of election law changes continue to
push for more changes they say are needed to make it easier to vote—although
there is scant evidence that the Empire State’s previous laws were suppressing
voter access to any degree.
Such changes, however, also make it easier for all sides in political campaigns
to exploit the rules, undermining the equally necessary and salutary right of elec-
tion integrity, or needlessly expending citizen tax dollars.
As priority steps to address such problems, lawmakers should statutorily:
• Require voters to provide proof of identification. Thirty-five other
states require voter I.D. or allow election officials to request it at the polling
place.
10
Such a rule is even more defensible considering that New York
State makes available to all residents a Non-Driver Photo ID card for a
person with lawful status in the United States
11
, which would need to be
augmented by proof of citizenship to vote, and other forms of identifica-
tion for other purposes.
• Reaffirm and strengthen existing absentee balloting restrictions. Bar-
ring a constitutional amendment, the law should be amended to perma-
nently disallow issuance of absentee ballots for any reason other than (a)
election day absence from the voter’s home county, or (b) illness or physi-
cal disability making it impossible for the voter to appear at the polling
place in person. It should never again be possible for the Legislature to au-
thorize what amounts to no-excuse absentee balloting based on the sup-
posed risk posed by a public health “emergency” that, as reflected by the
governor’s own policies on issues such as indoor masking, had rendered
no-excuse absentee voting gratuitous well before Election Day.
• Prevent ballot harvesting. The early stages of the state’s 2020 general
election campaign produced two instances of alleged efforts by both Dem-
ocrats and Republicans to exploit the ambiguity created by current law
combined with easier absentee ballot requirements.
12
After the November
election, a Staten Island grand jury issued a report citing “numerous in-
stances of ballot harvesting fraud in a race for City Council last year—in-
cluding a ballot submitted on behalf of a dead person and signature fraud
involving dozens of other absentee ballots,” as the New York Post re-
ported.
13
The grand jury reportedly recommended election law reforms to
curb abuse of the absentee ballot application and counting process.
14
In
general, the remedy for all such cases would be an election law provision
THE NEXT NEW YORK
134
expressly forbidding third parties from submitting an absentee ballot appli-
cation for any voter, with criminal penalties for violations.
• Scale back the nine-day early voting period. Studies have found that
early voting does not boost voter participation.
15
A voting period stretching
over nine days ties up space at schools and other public facilities commonly
used as polling places. It’s also costly: the state Budget Division allocated
$10 million for the initial round of early voting in 2020, and a Citizens Un-
ion study found that early voting will cost New York taxpayers $85.4 mil-
lion over ten years.
16
A less costly alternative, addressing the concerns of
those whose work schedules prevent in-person voting on Tuesdays, would
be a modified schedule allowing early voting on the Friday and Saturday
preceding Election Day.
• Repeal the John Lewis Voting Rights Act. The law is deeply flawed. For
example, criteria for judging the validity of existing voting methods include
“the extent to which members of the protected class have been elected to
office in the political subdivision”—a result-oriented standard that en-
croaches on the bedrock principle that the propriety of an election is deter-
mined by its procedural fairness, not “who wins.” The law is impermissibly
ambiguous (by, for example, prohibiting any procedure that “may enhance
the dilutive effects of the election scheme”), overly broad (giving legal
standing to “any … organization whose membership includes … members
of a protected class, [or] organization whose mission, in whole or in part, is
to ensure voting access and such mission would be hindered by a violation
of this section”) and impinges on legislative authority (by, for example, al-
lowing a court to “reasonably increase the size of the governing body” and
implement “additional means of voting such as voting by mail” as remedies
for violations).
17
• Reject public campaigning financing. The stated purpose of such laws
is usually described as reducing the role of big money by multiplying the
impact of small donors. But the New York City system is hardly an encour-
aging precedent--at best it might be described as a mixed blessing, the main
beneficiaries of which have been political consultants. A far better—and
less expensive—alternative would be to boost transparency through
strengthened campaign finance disclosure requirements, including manda-
tory weekly online updates of campaign finance reports beginning at least
four weeks before start of voting, and daily updates starting the day before
the early voting period through primary or election days. In addition, state
law should bar the use of campaign funds to pay candidates’ personal ex-
penses. And to dispel Albany’s thick cloud of “pay to play,” state law
should prohibit campaign contributions by individuals doing business with
the state.
• Create a path for limited citizen initiative and referendum. Twenty-six
states have some form of I&R which, experience elsewhere and in New

Renewing and Reforming the Empire State
135
York City suggests, is the only route by which New Yorkers will ever have
an opportunity to decide on whether to establish term limits for state offi-
cials. A balanced model can be found next door in Massachusetts, which
provides for review of citizen petitions by the attorney general, followed by
legislative input.
18
The Massachusetts process is more thorough and deliber-
ative than, for example, California’s—which allows for a confusing plethora
of ballot proposals funded by interest groups end-running the normal legis-
lative process.
19
ENDNOTES
1
See New York State Help America Vote Act, State Implementation Plan Draft, New York State Board
of Elections August 2003, and Amended State Implementation Plan 2009.
2
Chapter 6 of the Laws of 2019,
3
In 2022, an additional primary (held August 23) was necessitated when the state Court of Appeals
found that New York’s legislatively drawn congressional and state Senate maps violated the 2014
New York constitutional amendment to the redistricting process. [In the Matter of Harkenrider, et al, v.
Hochul et al, 2022 NY Slip Op 02833, April 27, 2022.]
4
Testimony of New York State Board of Election Co-Chairs Brehm and Kellner to State Senate and As-
sembly Committees, August 11, 2020, p.4.
5
Chapter 2 of the Laws of 2022.
6
Chapter 226 of the Laws of 2022
7
Id.
8
Id.
9
Chapter 58 of the Laws of 2020, see also Id.
24 states allow citizens to bypass the legislature
and place a proposed law or constitutional
amendment on the ballot;
23 states allow voters to approve or repeal an act
of the legislature

THE NEXT NEW YORK
136
10
National Conference of State Legislatures (“NCSL”), https://www.ncsl.org/research/elections-and-
campaigns/voter-id.aspx.
11
dmv.ny.gov.
12
The state Democratic Committee acknowledged having mailed partially pre-filled absentee ballot
applications to an unspecified number of Democratic voters [see “‘Dirty tricks’: Hochul boosters ac-
cused of ‘deceit’ in pre-filled ballot applications,” New York Post, Sept. 12, 2022]. Also in September,
a Republican elections commissioner in Rensselaer County was indicted on federal charges of unlaw-
fully using the names and birth dates of voters to apply for absentee ballots submitted to the New York
State Board of Elections web site back in 2021 [see U.,S. Attorney’s Office press release at
https://www.justice.gov/usao-ndny/pr/rensselaer-county-elections-commissioner-indicted].
13
“Grand jury finds numerous instances of ballot fraud in NYC council race on Staten Island,” New
York Post, Nov. 23, 2022. https://nypost.com/2022/11/22/grand-jury-finds-numerous-instances-of-
ballot-fraud-in-nyc-council-race-on-staten-island/
14
“Staten Island grand jury calls for election law changes after finding alleged fraud in ‘21 race,”
Staten Island Advance, Nov. 22, 2022. https://www.silive.com/politics/2022/11/staten-island-grand-
jury-calls-for-election-law-changes-after-investigating-fraud-charges-in-21-race.html
15
The Cost of Progress for New York’s Voters, May 2018 (the “CU Report”), Appendix B (citation
omitted, bolded heading in original). Also, Heritage Foundation, “The Cost of Early Voting” 2017
https://www.heritage.org/election-integrity/report/the-costs-early-voting).
16
CU Report, p. 18 and Appendix B.
17
Chapter 226 of the Laws of 2022.
18
See Amendment Article 48 to the Massachusetts Constitution and www.mass.gov.
19
oag.ca.gov/initiatives.

The Empire Center for Public Policy, Inc. is an independent, non-partisan,
not for profit think tank dedicated to making New York a better place to
live and work by promoting public policy reforms grounded in free
market principles, personal responsibility, and the ideals of effective and
accountable government.
Nothing in this paper is to be construed as necessarily reflecting the
views of the Empire Center, or as an attempt to influence the passage,
defeat, approval or disapproval of any legislation or any other matter
before the State Legislature, the Governor, or any other state or local
agency.
The Empire Center is a 501(c)3 not for profit organization. Contributions
are tax-deductible to the fullest extent of the law. EIN #46-1987418
