
Report
/
March 2021
Build Back Better Homes
How to Unlock America’s Single-Family Green Mortgage Market

Authors
Rita Ballesteros, Consultant
David Heslam, Earth Advantage
Greg Hopkins
Authors listed alphabetically. All authors from RMI unless otherwise noted.
Contacts
Greg Hopkins, ghopkins@rmi.org
Copyrights and Citation
Rita Ballesteros, David Heslam, and Greg Hopkins, Build Back Better Homes: How to Unlock
America’s Single-Family Green Mortgage Market, RMI, 2021,
http://www.rmi.org/insight/build-back-better-homes.
RMI values collaboration and aims to accelerate the energy transition through sharing
knowledge and insights. We therefore allow interested parties to reference, share, and cite our
work through the Creative Commons CC BY-SA 4.0 license. https://creativecommons.org/
licenses/by-sa/4.0/.
All images used are from iStock.com unless otherwise noted.
Acknowledgments
The authors would like to thank Madeline Salzman from the US Department of Energy for
technical feedback and non-policy content review throughout the development of this report.
The authors also thank the following individuals for offering their insights and perspectives
on this work:
Steve Baden, Residential Energy Services Network (RESNET)
Elizabeth Beardsley, U.S. Green Building Council
Alysson Blackwelder, U.S. Green Building Council
Jeremy Bourne, RiskSpan
Jacob Corvidae, RMI
Michelle Foster, Home Innovation
Ken Gear, Leading Builders of America
Jim Gray, Lincoln Institute of Land Policy
Janet Jozwik, RiskSpan
Cliff Majersik, Institute for Market Transformation (IMT)
Ryan Meres, Residential Energy Services Network (RESNET)
Robert Sahadi, Montgomery County Green Bank
Andrew Speake, National Renewable Energy Laboratory (NREL)
Clayton Traylor, Leading Builders of America
Signo Uddenberg, MKThink
Lowell Ungar, American Council for an Energy-Efficient Economy (ACEEE)
This work was generously supported by Energy Foundation and the Ray & Tye
Noorda Foundation.
Authors & Acknowledgments
www.rmi.org
/
2Build Back Better Homes

About Us
About Earth Advantage
Earth Advantage is a 501(c)(3) nonprofit organization based in Portland, Oregon, that
addresses the environmental impacts of residential buildings by developing and promoting
green home standards, conveying green home data to the residential real estate market, and
supplying training to building professionals and a growing energy efficiency workforce.
About RMI
RMI is an independent nonprofit founded in 1982 that transforms global energy systems
through market-driven solutions to align with a 1.5°C future and secure a clean, prosperous,
zero-carbon future for all. We work in the world’s most critical geographies and engage
businesses, policymakers, communities, and NGOs to identify and scale energy system
interventions that will cut greenhouse gas emissions at least 50 percent by 2030. RMI has
offices in Basalt and Boulder, Colorado; New York City; Oakland, California; Washington, D.C.;
and Beijing.
www.rmi.org
/
3Build Back Better Homes

www.rmi.org
/
4Build Back Better Homes
Table of Contents
Executive Summary
Introduction
Background
Green Mortgages as a Scalable, Cross-Cutting Tool
Recommendations to Structure Single-Family Green
Mortgage-Backed Securities (MBS)
Methods to Scale Single-Family Green Mortgages
Opportunities for Federal Policymakers
Conclusion
Appendices
Appendix A: Calculations and Assumptions
Appendix B: Proposed Calibration Framework for Green Mortgages
Appendix C: Existing Green Mortgage Origination Process Map
Appendix D: NREL Home Energy Cost Estimator Methodology
Appendix E: ResStock Representative State-Level Information
Appendix F: Additional Green Mortgage Product/Process Recommendations
Appendix G: Model Language for the GSEs’ 2022–2024 Duty to Serve Plans
Appendix H: Residential Green and Energy-Related Data Sources
Endnotes
5
7
10
16
19
24
29
32
35
56
36
39
43
44
49
50
51
54

Executive
Summary

www.rmi.org
/
6Build Back Better Homes
Executive Summary
The vast majority of America’s housing
stock is in need of improvements—not for
cosmetics, but for performance, health, and
safety. Over the next decade, shifts in utility
models, energy and climate policy, weather events,
and recognition of health and resilience priorities
will greatly expand this need. This is especially true
for low- to moderate-income (LMI) households and
communities of color. And yet, because the upfront
costs for these kinds of improvements largely fall on
homeowners, they are not likely to happen fast enough
without scalable low-cost financing solutions.
Concurrently, there is growing interest and demand
among capital markets investors for environmental,
social, and governance (ESG) investment options and
“green” securities. Financial institutions representing
over $18 trillion globally recently committed to align
their portfolios with the goals of the Paris Agreement,
1
but they lack sufficient market-ready green
investments to fully make this shift. The mortgage
industry is well positioned to help fill this gap.
Mortgages can become a primary investment vehicle
for deploying billions of dollars to meet this investor
demand while also fulfilling consumer demand for
green home improvements. Although the market
for multifamily green mortgage-backed securities
has grown tremendously (making Fannie Mae the
largest green bond issuer in the world for the fourth
consecutive year in 2020
2
), the single-family market
has only just begun to emerge as a destination for
green capital.
Innovations in housing data analysis, mortgage
processing and automation, and low-interest financing
products can facilitate this market transformation
through the existing real estate transaction process.
This report proposes practical solutions to reduce
friction in originating and securitizing single-
family green mortgage products already offered by
government-sponsored enterprises Fannie Mae and
Freddie Mac (the “GSEs”) to create a new $2+ trillion
market within a decade. Specifically, this report offers:
•
A framework and qualification criteria for the GSEs
to structure single-family green mortgage-backed
securities. This would allow green mortgages for
retrofitting existing homes and for high-performing
new construction to be converted into a massive
new green bond market.
•
Methods for the GSEs and lenders to scale single-
family green mortgages. These include leveraging
green home data in underwriting and appraisal
processes to enable greater market efficiency
(targeting dedicated additional proceeds to higher-
opportunity homes and borrowers to pay for
improvements) and automating systems to reduce
existing burdens on lenders and appraisers.
•
Opportunities for federal regulators and
policymakers to support these goals, including
by ensuring information transparency to correct
major market failures and by climate-aligning GSE
lending activities.
As the primary engines in US housing finance,
Fannie Mae and Freddie Mac offer the scale and the
mechanisms for market transformation. The GSEs
and other housing finance leaders can capitalize on
favorable market and policy trends and other key
windows of opportunity underway to position this
market for success.

Introduction

www.rmi.org
/
8Build Back Better Homes
The US housing market faces a dynamic set of
interrelated challenges: affordability, equity, health
and safety, and resilience, all in the face of an
increasingly urgent climate crisis. These challenges
disproportionately affect low- to moderate-income
(LMI) households and communities of color. Housing
market actors are not yet effectively directing
resources toward addressing these issues. However,
scaling readily available mortgage products can
help change that by increasing access to green
home improvements. This report recommends
targeted interventions to scale up single-family
green mortgage products offered by Fannie Mae and
Freddie Mac through pathways that protect both
borrowers and lenders.
A robust single-family green mortgage market
can deliver significant benefits and investor-ready
environmental, social, and governance (ESG) impacts.
Fannie Mae and Freddie Mac could generate more
than $2 trillion of new green mortgage-backed
securities (MBS) within a decade by streamlining and
scaling up their existing green mortgage products to
comprise 15% of their annual single-family mortgage
volumes (half the penetration level achieved on the
multifamily side). This would improve nearly 9 million
homes across the country, generate net cost savings
of $12 billion for consumers, create roughly 650,000
domestic jobs, and avoid 57 million metric tons of
carbon emissions (see Appendix A for calculation and
assumption details).
3
Why Now?
Different market actors have attempted to scale
versions of green or energy-efficient mortgages in
the past, without much success at a national level.
In recent years, however, supply-side motivation and
consumer demand have become better aligned toward
common goals.
Capital markets have been seeing ESG demand from
investors continue to outpace supply, resulting in a
modest premium (or “greenium”) for green and ESG
investments like green bonds.
4
In the spring of 2020,
Fannie Mae launched its first single-family green MBS, in
part to meet such demand, sending a powerful market
signal. By the end of 2020, Fannie Mae had issued $111
million in these green bonds,
5
backed only by loans on
ENERGY STAR® Version 3.0 certified new construction
homes. However, this program can go further to include
pathways for millions of existing single-family homes to
benefit from green improvements.
Estimated 10-year impacts of scaling up single-family green mortgagesExhibit 1
Estimated 10-Year Impacts
$2.2 trillion 8.7 million $12 billion 650,000 57 million
Single-family green
mortgage-backed
securities market
Homes improved in
quality, performance, &
resilience nationwide
Net savings to
consumers, after higher
loan payments
Jobs created based on
consumer savings and
investment
Metric tons of
cumulative carbon
emissions avoided

www.rmi.org
/
9Build Back Better Homes
Streamlining mortgage financing for green home
upgrades will also support the efforts of many large
financial institutions (including some of America’s
top mortgage lenders) that have committed to
“climate-align” their portfolios with the goals of
the Paris Agreement through greener lending and
investment activities.
6
Additionally, there are now sophisticated, credible,
and readily available home energy data systems and
tools that can integrate into increasingly automated
mortgage underwriting and appraisal processes. The
GSEs have a timely opportunity to leverage these
tools and pursue tactical policy updates to streamline
single-family green mortgage adoption. The GSEs can
integrate these objectives into their upcoming Duty
to Serve plans (see Appendix G) and ensure that their
ongoing Uniform Appraisal Dataset (UAD) redesign
captures critical green data fields for all homes to
facilitate market development.
7
Now is the time to spur green products in the
mortgage market: historically low interest rates are
driving record high refinancing activity and can offer
attractive financing terms for green upgrades that
improve overall home quality and value. Finally, this
opportunity aligns well with key priorities of the new
Biden Administration to address inequities, housing,
and the climate crisis (including stated plans to
weatherize 2 million homes, retrofit 4 million buildings,
and build 1.5 million affordable new homes
8
), which can
be mutually tackled by unlocking a fair and data-driven
single-family green mortgage market.

Background
www.rmi.org
/
11Build Back Better Homes
Source: US Bureau of Labor Statistics, Consumer Expenditure Survey 2019
Average expenditures as % of net income for the 80 million households earning <$70k/yearExhibit 2
Concurrent Housing Crises
When attempting to fundamentally shift how the
mortgage market works at scale, it is important to
fully understand the current market’s impacts and
ripple effects across the economy. The solutions
posed in this report will not solve every housing crisis
mentioned in this section. Rather, the aim of this
report is to propose solutions that can help and that,
at minimum, do not exacerbate these crises. The goal
of this section is to acknowledge the array of complex
and interrelated housing issues affecting homeowners
and residents today for consideration by the GSEs
and other mortgage industry leaders, as well as
policymakers, regulators, and program designers.
For most households in America, energy costs are
higher than either property taxes or home insurance
(as shown in the graphs below), yet these costs are
not systematically included in mortgage affordability
calculations.
9
Energy costs amount to significant
financial burdens for many Americans. Barriers to
funding and financing for cost-effective housing
improvements have led to persistent underinvestment
in housing infrastructure, resulting in too many
Americans living in substandard housing that is
expensive to operate. There are more than 98 million
single-family homes in the United States, roughly half
of which were built before building energy codes were
introduced over 40 years ago.
10
Poor energy performance is really a symptom of
larger housing crises concurrently impacting American
homeowners and renters. Today’s housing affordability
crisis, often concentrated in densely populated urban
areas, is due in large part to a lack of supply.
11
This
issue is especially pronounced in rental housing, where
in recent decades, the real income of renters has
not risen at the same rate as rental costs.
12
Although
housing prices have increased over time, asset quality
of existing homes has largely stalled or declined due to
aging features and typical wear and tear.
7.1%
4.8%
4.2%
9%
8%
7%
6%
5%
4%
3%
2%
1%
16%
14%
12%
10%
8%
6%
4%
2%
Energy
Costs
Energy Costs Property Taxes Insurance & Maintenance
Income Band:
Households:
Property
Taxes
<$15k
7M (13%)
$15k–$30k
22M (17%)
$30k–$40k
13M (10%)
$40k–$50k
11M (8%)
$50k–$70k
17M (13%)
Insurance &
Maintenance
www.rmi.org
/
12Build Back Better Homes
This creates situations where both a home’s upfront
costs and maintenance costs rise, compounding the
cost pressure on home buyers and renters.
13
In addition,
inefficient homes are not only more expensive to
operate, but on average also have worse indoor air
quality that can increase occupants’ healthcare costs.
Without convenient and affordable capital investments,
these properties face higher risks in terms of energy
costs, health threats, and loan performance.
Increasingly frequent extreme weather events
pose additional risks. Older homes with deferred
maintenance may be more susceptible to significant
damage from high winds, heavy rainstorms, smoke
from wildfires, and extreme temperatures during
heat waves and cold snaps. According to the National
Oceanic and Atmospheric Administration (NOAA),
2020 was the sixth consecutive year with ten or more
billion-dollar weather and climate disaster events in
the United States.
14
In 2020 alone these disasters
caused $95 billion in damage nationwide, almost
doubling the damage in 2019.
15
As a result, insurance
costs to cover damages have been increasing or
becoming entirely unavailable to some homes.
16
A recent report commissioned by the Commodity
Futures Trading Commission issued stark warnings
about the impacts of climate change on financial
markets for these same reasons.
17
Fortunately, the
most exhaustive cost-benefit analysis of natural
hazard mitigation to date found that every $1 invested
in home retrofits to protect against floods and
hurricanes can save $6 (every $1 invested in retrofits
to protect against fires and earthquakes can save $2
and $13 respectively).
18
These housing risks disproportionately impact
lower-income households and households of color.
Nearly 31 million US households face high energy
burdens (i.e., spend more than 6% of their income
on utility bills, roughly double the national average).
And a staggering 16 million US households face
severe energy burdens (i.e., spend more than 10% of
their income on energy).
19
Approximately 25 million
households have reported foregoing necessities like
food or medicine to pay their energy bills (7 million of
which face that decision on a monthly basis).
20
High energy burdens can also lead households to
dangerous situations, such as using ovens for heat or
risking unsafe indoor temperatures. These burdens are
particularly concentrated in communities of color: the
median energy burden for Black households is 43%
higher, and for Hispanic households 20% higher, than
for non-Hispanic White households.
21
There has been a long history of racist housing and
lending policies and practices (including but not
limited to: New Deal enforced segregation, redlining,
restrictive covenants, biased appraisals, and real
estate agent steering). This has resulted in households
of color disproportionately making up lower-income
households and occupying lower quality housing
in the United States.
22
Intergenerational wealth is
often generated in families through homeownership
(and the financial security that assets can provide).
Thus, strategies that can upgrade existing housing
and reduce the costs of, while increasing access to,
homeownership can be particularly beneficial for
households that have been precluded from such wealth
accrual opportunities.
It has been found that the median White household has
nearly 20 times more wealth than the median Black
household.
23
And although 73% of White households
own their home, only 41% of Black households
do.
24
Additionally, communities of color are more
geographically concentrated in regions where land
prices have been increasing rapidly, contributing
to displacement as property taxes rise. These
communities are also often more exposed to, and
harder hit by, the fallout from natural disasters and
extreme weather, and are more likely to live close to
power plants and high-pollution areas.
25
This leads to
higher rates of health complications and particularly
asthma, which affects Black children at more than
double the rate of White children (16% versus 7%).
26
Meanwhile, the backdrop behind all these challenges
is an increasingly urgent climate crisis. The scientific
consensus is clear: to avoid the catastrophic effects of
climate change, we must limit global temperature rise
to 1.5°C, which will require a 50% reduction in global
emissions by 2030 compared with 2010 and net-zero
global emissions by 2050.
27
www.rmi.org
/
13Build Back Better Homes
Household energy use accounts for roughly 20% of
all US greenhouse gas emissions. However, our homes
represent a critical segment of the economy that is
not decarbonizing at nearly the rate required.
28
A lack
of information transparency and awareness, market
signals and incentives, and scalable low-cost financing
solutions all contribute to stagnant residential sector
progress on climate and equity issues. Failure to
change this trajectory will mean substantial risk
to both the housing stock and the mortgage and
insurance industries in the years ahead.
Single-Family Market Context
Together, Fannie Mae and Freddie Mac back nearly half
of all single-family mortgage originations, to the tune
of approximately $1 trillion per year.
29
The GSEs are
federally backed home mortgage companies that buy
single-family and multifamily mortgages originated by
lenders across the country, guarantee their principal
and interest payments, and then repackage and sell
them as mortgage-backed securities (MBS) on the
secondary market. This makes the mortgage market
more liquid, stable, and affordable. To that end, they
also standardize requirements to which lenders and
appraisers nationwide conform.
Between 2009 and 2019, annual mortgage origination
volume averaged $1.8 trillion for one- to four-unit
residential buildings, split roughly equally between
refinance and purchase products.
30
Yet only a tiny
fraction of this volume prioritized getting families into
homes with low energy costs or improving the housing
stock. In 2018, only 3% of the total mortgage loan
volume was in home improvement financing products,
and limited data suggests only a small portion of these
are dedicated to green home improvements.
31
Fannie Mae and Freddie Mac both offer green
mortgage products that finance energy (and other
green) improvements, but neither have been
effectively adopted by lenders at scale to allow
widespread access. Furthermore, neither GSE has yet
identified a full framework for green improvement
financing of existing homes to be included in single-
family green MBS; Fannie Mae’s new single-family
green MBS program currently only covers ENERGY
STAR certified new construction homes.
Although the percentages of mortgage loan volume
including home improvement costs so far are
small, the total potential for financing green home
improvements is compelling. To put this market in
context, the total annual budget of the Weatherization
Assistance Program (WAP)—the US government’s
energy improvement assistance program for low-
income families—is $1.1 billion, less than 2% of the
annual volume of home improvement mortgage loans.
i
Adding in the total annual amount spent on residential
energy efficiency through all utility-funded programs
nationwide, this volume of annual spending is still only
about 6% of the existing home improvement mortgage
loan market size, or only 0.18% of the total annual
mortgage market by volume.
ii
Unlocking even a fraction of the existing single-family
mortgage market to enable streamlined access to low-
interest financing for green improvements will help
millions more residents access the benefits of higher-
performing homes. Given the significant potential for
cost-effective green home upgrades, a substantial
portion of the GSEs’ single-family mortgage issuance
could become green within 10 years.
Today, homeowners are spending money on home
improvements, but typically need to seek out
upgrade packages, financing, and products on
their own. According to Harvard’s Joint Center for
Housing Studies report, Improving America’s Housing
2019, US homeowners spent $68 billion in 2017 on
improvements to roofing, siding, windows, doors,
HVAC systems, and insulation—all projects that could
generate meaningful home energy savings if more
i
2018 home improvement loans were $60 billion; WAP in FY18 totaled $1.1 billion ($250M from DOE, $453M from LIHEAP, $407M from
nonfederal sources).
ii
Utility energy efficiency program spending on residential programs was slightly under $3 billion in 2018:
https://www.eia.gov/todayinenergy/detail.php?id=42975

www.rmi.org
/
14Build Back Better Homes
efficient options are installed. Such systems and
equipment replacements were the fastest growing
segment of the home improvement market in recent
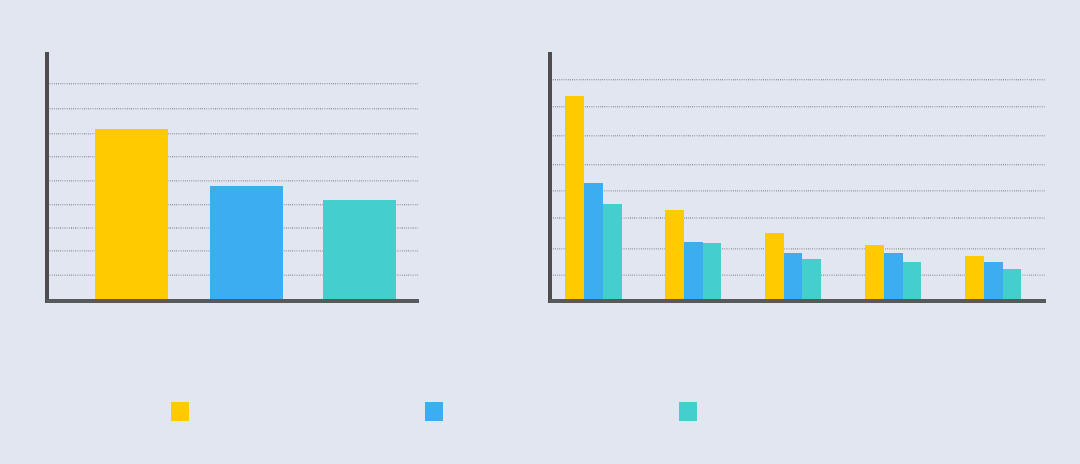
years (see pie charts below).
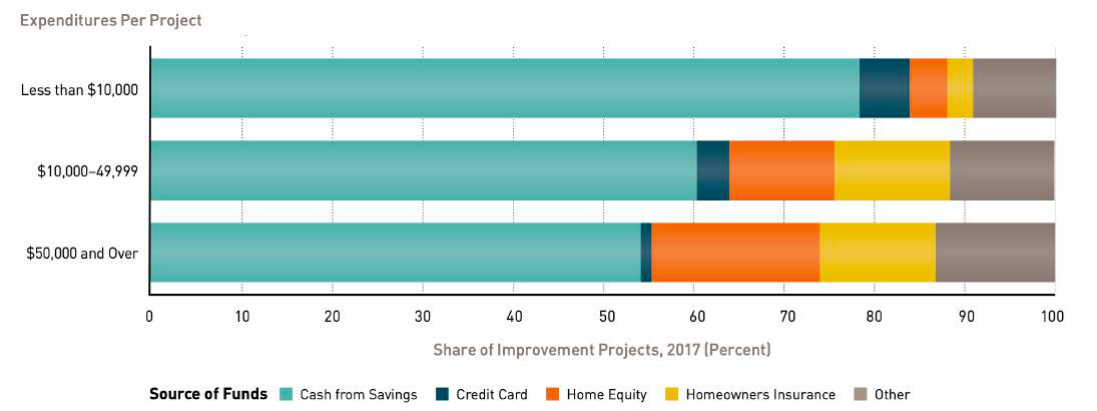
Notably, US homeowners used cash from savings to
pay for 77% of home improvement projects, with
the next largest sources being credit cards or retail
store charge cards. This paradigm disproportionately
excludes lower-income households that do not have
the savings or credit to pay for these upgrades.
The report concludes that the share of replacement
projects is likely to remain high in the coming
decade as the housing stock ages, and that offering
homeowners additional financing options (in lieu of
cash savings) would likely lead to significantly stronger
growth in improvement expenditures.
32
Replacement projects take up a growing share of homeowner improvement budgets Exhibit 3
Notes: Replacements include exterior, systems and equipment, and interior projects. Discretionary projects include kitchen and bath remodels,
room additions, and outside attachments. See Table A-1 in Harvard’s Joint Center for Housing Studies report, Improving America’s Housing 2019,
for more detailed definitions of project categories. Homeowner improvement spending totaled $220 billion in 2007 and $233 billion in 2017.
Source: Improving America’s Housing 2019, Joint Center for Housing Studies of Harvard University.
www.rmi.org
/
15Build Back Better Homes
Most homeowners rely on cash from savings to finance improvementsExhibit 4
In addition to replacements, national surveys show
that consumers want energy efficiency in their homes
but the market is not yet meeting that demand.
In a Demand Institute survey of more than 10,000
households, increased energy efficiency was the
number one housing desire, ranked according to the
size of the “satisfaction gap.” In other words, 71% of
respondents thought energy efficiency is important
but only 35% were satisfied with their current home.
Increased energy efficiency was ranked higher than
updated kitchens and finishes, safe streets, privacy,
and more.
33
Key findings from the National Association of
REALTORS’ latest annual survey of its members
include that: 70% of agents and brokers reported
that energy efficiency promotion in listings is valuable
and 61% found that consumers are interested
in sustainability. Yet 61% were not confident
connecting clients with green lenders, and the highest
ranked market issue (from a list of 13 issues) is
“understanding lending options for energy upgrades
or solar installations.”
34
Notes: Credit Card category includes retail store charge cards. Home Equity includes cash from refinancing, home equity loans, and home
equity lines of credit. Other includes contractor-arranged financing and all other funding sources, including those not reported.
Source: Improving America’s Housing 2019, Joint Center for Housing Studies of Harvard University.

Green Mortgages as
a Scalable, Cross-
Cutting Tool

www.rmi.org
/
17Build Back Better Homes
These trends point to a compelling opportunity for
green mortgages to overtake a substantial market
share in the years ahead, if the delivery process
can be sufficiently streamlined and scaled. A viable
solution requires the right mortgage products and
the right processes to make delivering those products
easy, targeted, and scalable. The right products
are largely in place now, but process improvements
are still needed so that these products can become
standard offerings to borrowers. The following
sections of this report discuss how to better activate
the market for deployment.
Fannie Mae’s HomeStyle® Energy mortgage and
Freddie Mac’s GreenCHOICE® mortgage allow
borrowers to use mortgage proceeds to finance the
cost of green single-family home improvements
when purchasing or refinancing a home, up to 15%
of its “as-completed” value. Eligible improvements
within their “green” scope include energy efficiency
measures (e.g., air sealing, insulation, high-efficiency
windows and HVAC equipment), water efficiency
measures (e.g., low-flow fixtures), renewable energy
(e.g., solar panels), and also resilience improvements
(e.g., hazardous brush and tree removal in fire zones,
storm surge barriers and retaining walls, foundation
retrofitting for earthquakes).
They also permit homeowners to finance certain pre-
existing debt related to green improvements (e.g.,
from residential PACE,
iii
utility efficiency programs,
consumer loans), rolling those pre-spent dollars into the
new mortgage. This takeout mechanism can enable the
GSEs to play a role in providing liquidity for other green
home financing providers in the marketplace. This can
free up more capital for those actors to redeploy within
their programs while affording borrowers the lower
interest rates of a mortgage product.
These types of green home improvements are not
a comprehensive solution for all the housing crises
described above. However, when well-implemented,
they can meaningfully improve affordability and health
and safety outcomes for borrowing households, while
also reducing loan performance risk and climate risk
at scale. Given the housing and energy burdens that
iii
Property-assessed clean energy, a loan product financed through the property’s tax assessment.
www.rmi.org
/
18Build Back Better Homes
LMI households and households of color often face,
these groups can benefit significantly from well-
designed and consumer-protected financing products.
At current historically low interest rates, mortgage
products offer what may be the most affordable
financing available for such projects. When offered
through standard real estate transaction and refinance
processes, these mortgage products can scale to
impact millions of homes each year.
Appendix A includes an example of project-level
financial benefits for households that finance energy-
and/or water-saving green home improvements
through green mortgages at a basic level (15%
savings) and deeper level (25% savings). In practice
these figures will vary depending on the measures
and technologies installed. A household could
realize average annual net savings (i.e., utility cost
savings offset by slightly higher mortgage payments,
assuming the full project size is added to the mortgage
balance) of $314 after a basic retrofit and $326 after a
deeper retrofit based on the assumptions in Appendix
A. The GSEs and/or lenders can set up automated
checks to confirm that expected net savings are
estimated to be positive for borrowers upfront to
better protect consumers. Note that these examples
do not take into account other potential value streams,
such as reduced health and safety costs or increased
home value.
Green homes offer more than just utility cost
savings. Residents also benefit from improved
comfort and indoor air quality, increased resilience
to environmental disasters, and reduced carbon
emissions.
35
Green homes also have the potential
to experience reduced loan default rates: one study
covering a time period that included the Great
Recession found 32% lower default rates for energy-
efficient homes than non-energy-efficient homes.
36
Freddie Mac’s own analysis found that RESNET’s
Home Energy Rating System (HERS) rated homes sold
for 2.7% more than comparable unrated homes, and
that better-rated homes sold for 3%–5% more than
lesser-rated homes. Additionally, the study showed
that loans with high debt-to-income ratios (45% or
above) with ratings appear to have lower delinquency
rates than unrated homes.
37
A separate meta-analysis
of dozens of valuation studies found a 4.3% value
premium for certified green homes.
38
Given that
appraisal standards do not yet explicitly account for
home performance, this premium is likely based on
perception and may be understated.

Recommendations
to Structure Single-
Family Green
Mortgage-Backed
Securities (MBS)

www.rmi.org
/
20Build Back Better Homes
The ability to pool and securitize a sufficient volume of
eligible mortgages that can be sold in the secondary
market as green MBS is key to keeping capital flowing
to finance green homes and improvements. This value
chain can generate mutually reinforcing benefits
for the GSEs, lenders, and borrowers. Studies have
found that capital markets investors pay a premium
for green bonds, particularly for those that are
government issued and investment grade, and that
follow defined governance and reporting procedures.
For example, an average “greenium” up to 9 basis
points has been observed on the secondary market.
39
The additional cash flow stream from such premiums
can benefit market participants in different ways,
depending on the type of securitization. In the case of
lender swap transactions (the most common type), this
can be a significant incentive for lenders and, in turn,
can enable lenders to offer discounted interest rates
to borrowers of green mortgages, bolstering demand.
In the case of portfolio securitization transactions, this
can be a significant incentive for the GSEs themselves,
which could be partially passed on to the benefit of
lenders and/or borrowers of green mortgages.
40
The GSEs’ single-family green MBS business can take
lessons learned from their successful multifamily
counterparts, which began issuing green MBS in 2012
and grew substantially—likely in part thanks to the
use of incentives. Although it took five years for the
multifamily market to achieve multibillion dollar scale,
existing performance standards and access to data
in the single-family market means there does not
need to be such a long period for a robust and viable
single-family green MBS market. Although single-
family loan sizes are inherently smaller and more
fragmented with more participants, adding complexity
to the securitization process relative to the multifamily
business, this can also offer advantages for investors
in terms of risk diversification across MBS pools.
As mentioned above, the securitization of single-
family green MBS started in 2020 with Fannie Mae’s
new program. At time of writing, that program only
uses one method to identify properties for inclusion:
the EPA’s ENERGY STAR Certified Homes program
for new construction. Expanding the single-family
green MBS market to include homes that are already
green, as well as homes that can access financing to
become green, is necessary for equitable distribution
of benefits and achieving scale. This report proposes a
framework and qualification criteria to that end.

www.rmi.org
/
21Build Back Better Homes
Multifamily Green MBS Context
Fannie Mae offered its first multifamily green
mortgage loans in 2011 and issued its first
multifamily green MBS in 2012. These were initially
based on multifamily new construction projects.
In 2014, Fannie Mae and the EPA announced the
ENERGY STAR Score for multifamily buildings,
creating a consistent method to measure
performance of existing multifamily buildings.
In 2018, Fannie Mae established a Green Bond
Framework. By the end of 2020, Fannie Mae had
issued over $85 billion in multifamily green bonds,
making it the world’s largest green bond issuer
for four straight years.
41
On average over those
four years, Fannie Mae’s multifamily green MBS
represented over 30% of its total multifamily
mortgage volume.
42
Although Freddie Mac started
this effort after Fannie Mae, its multifamily green
business has also been growing. It has purchased
$63 billion in multifamily green mortgages since
2016 and issued over $3 billion in multifamily green
MBS since 2019. In the multifamily market, the
large majority of green MBS volume has been for
green improvements to existing buildings, primarily
through Fannie Mae’s Green Rewards program.
Fannie Mae’s cumulative green MBS issuanceExhibit 5
Source: Fannie Mae Capital Markets, “Multifamily Green MBS," 2021; excludes retired Fannie Mae green programs.
$90,000M
$80,000M
$70,000M
$60,000M
$50,000M
$40,000M
$30,000M
$20,000M
$10,000M
Single-Family (ENERGY STAR Certified
Construction)
Multifamily Green Building Certification Multifamily Green Rewards
2012 2013 2014 2015 2016 2017 2018 2019 2020
$72B
$13B
$111M

www.rmi.org
/
22Build Back Better Homes
Methods to Scale Single-Family
Green MBS
Given the needs of much of the single-family
housing stock, there is a significantly larger market
opportunity for single-family green mortgages. Single-
family green MBS achieving market penetration of
15% of total GSE single-family mortgage volumes (half
the level achieved by Fannie Mae’s multifamily green
business) would equate to over $150 billion per year
as shown in Appendix A, with most of that financing
existing homes.
The single-family green MBS market can expand
into both new and existing homes simultaneously by
continuing to identify and securitize more new green
homes, and by developing a framework to identify
and categorize green improvements for existing
homes. The discussion below provides a summary of
this proposal, which follows the logic of Fannie Mae’s
Multifamily Green Bond Framework. Further details
can be found in Appendix B, along with a discussion
of the importance of leveraging rating systems in
addition to certification programs.
Single-family green mortgages can be categorized for
three types of homes: new construction that meets
varying levels of above-code criteria, comprehensively
retrofitted existing homes, and existing homes
that have had basic (yet impactful) upgrades. We
propose a framework to establish these qualifications
for evaluation into green MBS with five tiers of
related performance and impact (details on specific
certifications, ratings, and other criteria are included
in Appendix B).
Existing homes that undergo improvements should
achieve a rating or certification with appropriate
designation based on the level of savings or impact.
This framework can be used to give green designations
to homes with mortgages that finance energy- or
water-saving improvements with independent third-
Methods to measure required achievement for single-family green mortgage tiersExhibit 6
Qualifying Home
Types
Towards Zero Group 1:
High
Performance +
Ventilation
Group 2:
High Efficiency
Group 3:
Base
Certifications/
Ratings
Group 4
Basic
Retrofits
High-Performance
New Construction
Homes
Via Certification Via Certification Via Certification
or Rating*
Via Certification
or Rating*
N/A
Comprehensive
Retrofits and/or
Solar
Via Certification Via Certification Via Certification
or Rating*
Via Certification
or Rating*
N/A
Basic Retrofits
and/or Solar
N/A N/A Via Rating Via Rating Via Rating
* Note on certifications versus ratings: green home certifications such as LEED, ENERGY STAR, and Passive House establish that a home
has achieved a target level of high performance and/or met other criteria. Home energy ratings such as HERS and Home Energy Score can
assess any home’s assets (equipment, envelope, etc.) and model energy consumption, assigning a score and recommending cost-effective
improvements that save energy and money. At a practical level, ratings can be more easily leveraged to gauge retrofit impacts while more
comprehensive certifications will typically apply to higher tiers.
www.rmi.org
/
23Build Back Better Homes
party verified or modeled savings of at least 15% on
a whole-home basis, measured against the home’s
current performance. This 15% savings threshold is
based on the GSEs’ multifamily green criteria and
aligns with existing Duty to Serve criteria for single-
family green mortgages.
In cases where the green mortgage allows for basic
improvements without an energy report (currently
up to $6,500 for Freddie Mac or $3,500 for Fannie
Mae—which we recommend increasing to at least
$5,000), those basic improvements should be chosen
from prequalified lists of cost-effective measures
that have been determined to reliably deliver cost-
effective savings. Such eligible measure lists can be
curated, short, easily verifiable (as better than existing
conditions), and reevaluated annually based on
studies of a sampling of homes to verify that expected
savings are being realized. For reference, the DOE’s
Weatherization Assistance Program achieves average
energy cost savings of 13% with basic measure
packages that cost on average $4,695 per home.
43
The expansion of multifamily green MBS to handle
existing buildings required the development of a rating
system for existing multifamily buildings. In the single-
family market there are already two energy rating
systems in use nationally: HERS® and Home Energy
Score™. These programs deliver energy reports (each
with a score or rating of the home’s current condition)
that can be used to qualify improvements financed
by the GSEs’ green mortgage products. The scores
produced from these two rating systems can also be
used on their own to categorize loans into the lower
tiers of the proposed single-family green mortgage
designation framework.
As part of the final certification of completion
process, the GSEs could require that lenders have
qualified third parties inspect each completed
project and provide a final rating. This step will
ensure the work is verified by an energy professional,
protecting consumers and mitigating the risk of
fraud. Additionally, a “test out” score can be used
to determine relative performance and inform green
MBS disclosures and tracking. The large and growing
number of trained green raters nationwide can supply
updated score reports through established business
models. A benefit of requiring a rating after work is
completed is that some homes may qualify for higher
green tiers, which could offer lower interest rates for
those borrowers. Another benefit is that the rating will
generate a verified energy cost estimate, which can
facilitate an automated valuation adjustment of the
property based on its relative energy performance.
A critical component of updated processes is to
capture green mortgage loan designations in loan
delivery data. The GSEs use the Uniform Loan Delivery
Dataset (ULDD),
44
an aligned format for lenders to
communicate details about each mortgage loan sold.
The ULDD informs the key characteristics needed by
the GSEs in order to pool and securitize loans into
MBS. Several green home databases now exist that
document third-party home certifications and ratings
(see Appendix H for more detail). The automated
integration of such data can enable lenders and the
GSEs to identify both qualifying green properties
that are already in their portfolios and new green
properties as loans are acquired.
The GSEs’ next update of the ULDD should include the
necessary data fields for green mortgage loans. In
the interim, an industry working group can be formed
to recommend how existing green home data sources
(including those recommended in this report) can be
leveraged for this purpose.

Methods to
Scale Single-
Family Green
Mortgages

www.rmi.org
/
25Build Back Better Homes
Before the single-family green MBS market can
reach its potential, single-family green mortgage
processes must be improved. Adoption of the GSEs’
existing single-family green mortgage products
remains extremely low to date because of a lack of
awareness and demand from consumers and specific
operational pain points that add complexity, time,
and cost for lenders.
The GSEs provide favorable terms for lenders, giving
a $500 credit per loan for green mortgage origination
and allowing lenders to close and deliver these
loans without recourse before the improvements
are completed. There is no rate premium for green
mortgages, and they can be bundled with other GSE
products (e.g., low down payment mortgages) that
further improve affordability and access to capital.
But along with these perks come additional process
steps and considerations that have made them more
challenging than conventional mortgage originations.
For reference, Appendix C includes a high-level
diagram illustrating the single-family green mortgage
origination workflow based on existing GSE guidelines
for lenders.
Single-family green mortgage products will inevitably
involve some level of additional process steps
compared with a standard mortgage. However, these
need not be obstacles because innovations in housing
data analysis and automation can be leveraged.
Below are the top three operational pain points that
can be addressed in the immediate term (additional
recommendations can be found in Appendix F):
Lack of awareness/demand and inability to
effectively sell green mortgage products
Burdensome project evaluations for lenders
Limited market of green appraisers and lack of
comps for as-completed valuations
Data and automated solutions available today, in
combination with updates to GSE policies and lender
guidelines, can help overcome these process barriers
to scale up adoption. Below are brief descriptions of
these significant but surmountable lender process
pain points, followed by recommendations for the
GSEs, FHFA, and market-leading lenders to consider
as part of broader efforts to unlock the single-family
green mortgage market:
Lack of awareness/demand and inability to
effectively sell green mortgage products:
Home energy information has been largely
invisible to most homeowners and residents,
except for a handful of jurisdictions in the United
States with residential energy disclosure policies.
Without access to this information, lenders
have been unable to account for energy costs in
mortgage underwriting and appraisal standards,
leaving them no way to identify borrowers and
homes that can meaningfully benefit from green
home improvements through green mortgages.
Because of these information barriers, both
lenders and borrowers miss opportunities to
pursue green mortgage products.
Leverage home energy cost data to increase
visibility of home performance and drive
demand: Data exists today—high-quality,
nationally standardized data from trusted
sources such as the US Department of Energy
(DOE)—that can be leveraged to auto-populate
home energy cost estimates and other
performance metrics into the underwriting
process. This data can enable lenders to initiate
conversations about green mortgage products
with borrowers and more effectively target
homes that may be costly to operate. Adding
a data field for “home energy cost estimate”
(ECE) through the GSEs’ ongoing Uniform
Appraisal Dataset (UAD) redesign initiative

www.rmi.org
/
26Build Back Better Homes
can effectively capture this information for all
homes nationwide.
Existing tools and databases can allow lenders
to capture ECEs from home ratings (e.g., HERS
or Home Energy Score) and green certifications
when they are available, or capture a baseline
ECE for the majority of homes with no third-
party rating. This same data field can be
leveraged in two use cases: by lenders to better
target and sell green mortgage products,
and by automated valuation models (AVMs)
and appraisers as a baseline for calculating
appraised value adjustments.
The DOE’s National Renewable Energy
Laboratory (NREL) recently developed a Home
Energy Cost Estimator tool to generate home-
specific energy cost estimates for this context
and use case, presenting an automated solution
aligned with the use of automated underwriting
systems and AVMs. This tool is built on
ResStock™, NREL’s comprehensive database
of national housing stock characteristics that
leverages advanced energy modeling and high-
performance computing.
The data is post-processed via six common
appraisal fields: home size, age, location,
utilities, cooling type, and foundation type.
This tool could be integrated with the GSEs’
automated underwriting software (Fannie Mae’s
Desktop Underwriter® and Freddie Mac’s Loan
Product Advisor®) as an additional third-party
vendor, similar to how credit scores are imported
from external sources. This would introduce
a key data point that can jumpstart the green
mortgage origination process. For more detail on
the NREL tool and its methodology, please see
Appendix D.
Burdensome project evaluations for lenders:
Currently, lenders must verify the eligibility
and cost-effectiveness of itemized energy
technologies for green mortgage products
(including to receive credit under Duty to
Serve). However, lenders lack the expertise in
energy technologies and building science to
conduct this work confidently. Due to a lack of
underwriting system integration, this typically
also involves manual calculations outside of
largely automated loan origination processes,
adding complexity, time, cost, and confusion to
the process for lenders.
Leverage eligible measure lists to simplify and
streamline project evaluations for lenders:
State- or region-specific eligible measure lists for
cost-effective measures can be used to streamline
eligibility and cost-effectiveness determinations
for lenders. This concept is permitted by FHFA’s
Duty to Serve regulation,
45
but it is not being
used in practice.
At minimum, the GSEs’ seller
guidelines should be updated to permit the use of
such lists. ResStock has data that could be used to
create lists for this purpose,
46
and further analysis
could allow for prequalified eligible measure lists
at a state or regional level for use by lenders.
Additional resources like state- and utility-led
residential efficiency programs can be leveraged
to establish regionalized eligible measure
lists for upgrades that will most reliably
deliver energy and cost savings to homes,
with added potential to align with state policy
goals. These lists can be curated and updated
annually based on independent verifications
of a sampling of homes to ensure that savings
estimates maintain accuracy over time. For
a representation of ResStock’s state-level
information, see Appendix E.

www.rmi.org
/
27Build Back Better Homes
Limited market of green appraisers and lack of
comps for as-completed valuations:
The GSEs’ current green mortgage products
require appraisers to determine the home’s as-
completed value (i.e., after the improvements
are made) for every project before the financing
has been approved. This adds time and cost
to the process and presents a challenge for
appraisers to attest to market reaction to green
features that have not yet been installed. Today,
only a small subset of appraisers are trained to
perform green appraisals, and these appraisers
do not have access to widespread comps for
green features. Again, the green mortgage
market is stymied because standard processes
do not capture the necessary data.
Leverage automation to simplify and streamline
as-completed valuations:
The GSEs can mitigate the as-completed appraisal
challenge by recognizing the value added by
efficiency improvements using automated
methods based on the income valuation approach.
Automating this step in the process, for example
via the GSEs’ automated appraisal tools, will
remove a significant barrier to help jumpstart the
market for green mortgages. With available data
like home energy cost estimates and the use of
prequalified measure lists for basic improvements
as described above, the opportunity exists to
change the system of valuation into one of
evaluation (i.e., AVM-based value adjustments
confirmed by human appraisers) rather than full
manual appraisals in all cases.
This approach also helps protect consumers by
requiring the energy savings to be higher than
the cost of improvements, thus creating positive
cash flow for the borrower. If no efficiency-
related improvements are made, then there
is no attribution of value, mitigating the risk
of devaluing homes and/or limiting access to
credit. Basic improvements should only require
automated evaluations, which can open up the
market to borrowers that need smaller—but still
valuable—energy upgrades. More comprehensive
retrofits will still benefit from the analysis that
comes with full as-completed appraisals.
Additional recommendations to address other
operational challenges are detailed in Appendix
F. Given the needs of the US housing market, we
also recommend expanding the scope of the GSEs’
single-family green mortgage program to include the
following activities:
•
Expand eligible measures to further improve
health and safety outcomes: The pandemic
has shined new light on the importance of
healthy indoor air quality. There are increasingly
understood and well-documented risks to
respiratory health from combustion-based
appliances in homes, which release toxic pollutants
that can increase indoor air pollution to levels
that would be illegal outdoors.
47
Related health
risks exacerbated by poor housing infrastructure
are also gaining attention from policymakers and
consumers. These health risks disproportionately
affect lower-income households, and especially
children. Therefore, green mortgage products
should also be able to finance home electrification
upgrades and other health improvements.
Replacing combustion-based appliances and
equipment with cost-effective, clean electric
alternatives (e.g., heat pumps, heat pump water
heaters, induction stoves) can not only improve
health, it can also save money. And it is a critical
part of meeting climate targets—decarbonizing
the economy requires solutions for the 70 million
homes and buildings that burn fossil fuels on-site.
48
•
Develop plans to increase access, affordability,
and consumer protection for communities of
color: The mortgage industry has an opportunity
to improve racial equity and ensure communities
of color can access the benefits of higher-
performance homes through green mortgages.
These products can be used to help correct some
of the racial inequities historically driven by the
mortgage industry, such as disparate housing
quality and energy burdens.
For example, the GSEs can develop plans and
partner with lenders and community organizations
to more effectively deliver green mortgages in
the highest energy-burdened zip codes of the
www.rmi.org
/
28Build Back Better Homes
United States. These mortages can finance green
improvements for low-performance homes that
have lacked access to capital in the past. This could
be integrated into efforts to support first-time
homeownership in these communities, including
by educating consumers about green mortgage
products in combination with other GSE affordable
lending products and down payment assistance.
As use of AVMs continues to grow in the mortgage
industry, the GSEs should also take steps to assess
impacts in majority-Black neighborhoods. New
research has shown that AVMs can produce larger
errors in these neighborhoods that may reinforce
the impacts of past racial discrimination.
49
FHFA and the GSEs should work with counseling
agencies, community organizations, industry
experts, and other stakeholders to develop
actionable plans designed to meet the needs of
these underserved communities.
These solutions can be tested by the GSEs, market-
leading lenders, and other partners through pilot
projects to track and quantify the impacts. Pilot
projects and ambitious green mortgage targets can be
incorporated into the GSEs’ next Duty to Serve plans
for the period 2022–2024, as proposed in Appendix
G, and/or developed outside of Duty to Serve. Better
designed processes through automated and data-
driven solutions means these efforts can scale with
only limited training and education needs for lenders
and appraisers.
Various consumer protection measures are key to
delivering benefits to both borrowers and lenders.
Consumer protection measures include activities
like automated checks to confirm positive net
savings expectations for borrowers, curated cost-
effective eligible measure lists, qualified contractor
networks, post-completion independent third-party
verification ratings, and quality control systems
that include follow-up evaluations for a sampling of
completed projects to verify savings. The GSEs can
work with industry experts, consumer advocates,
and other key stakeholder groups to ensure that
consumer protections are sufficiently incorporated
into efforts to scale up this market. Ultimately, the
GSEs must ensure that financed home performance
improvements actually translate into increased
asset value for homeowners. This work can redirect
consumer spending away from utility bills and toward
their own home’s value.

Opportunities
for Federal
Policymakers
www.rmi.org
/
30Build Back Better Homes
The federal government can also take action to better
align housing finance with its economic, equity, and
climate goals, including by scaling up the single-family
green mortgage market. There are many reasons
to take on this effort: to improve the US housing
stock, correct market failures, protect consumers,
address inequities, and create durable green home
retrofit jobs at scale. Since the New Deal, the federal
government has used the credit system to shape the
housing market. Policymakers enabled the expansion
of the suburbs starting in the 1930s, in part using
mortgage subsidies through the GSEs and the tax
code. The federal government has new opportunities
today to start building back a better housing market
through finance.
In support of the new Biden Administration’s broader
agenda focused on economic recovery, racial justice,
housing, health, and climate (which includes stated
plans to weatherize 2 million homes, retrofit 4 million
buildings, and build 1.5 million affordable new homes
50
),
the federal government can pursue the following:
•
Enable home performance labeling and disclosure
nationwide: Residents have a right to know about
the energy benefits or burdens of a home based
on its inherent physical assets before they move
in. Home energy labels highlight key information
about expected energy costs and cost-effective
improvement recommendations. Nationally
standardized ratings based on professional on-
site assessments—such as RESNET’s HERS for
new construction or DOE’s Home Energy Score for
existing homes—can be disclosed to prospective
buyers and occupants at time of listing and time
of rental.
The federal government can prioritize mandatory
home energy labeling nationwide and provide
resources and technical support for local
government implementation. This would enable
consumers to have better information when
budgeting and making housing choices, which can
especially help lower-income households identify
and avoid less tenable living situations.
Strengthening the link between these labels
and financing also enables borrowers to more
easily finance energy and other green home
improvements as part of their mortgages. Some
local governments have already established these
policies.
51
These can provide a model for scaling
access to energy labels nationally, which would also
drive up demand for green mortgage products to
complement supply-side efforts by the GSEs and
lenders. The costs of professional home energy
ratings could also be subsidized by the federal
government for LMI households.
•
Incorporate green home data fields into GSE
underwriting and appraisal standards: With or
without a national home performance disclosure
policy, FHFA can call on the GSEs to incorporate
key home energy and other green data fields
for all homes nationwide (not just for those with
certifications and ratings). This will help lay the
foundation for greater market efficiency. This would
be possible by, for example, adding a data field
for home-specific energy cost estimates into the
Uniform Appraisal Dataset (UAD) redesign initiative
(underway through 2021). The UAD could be auto-
populated for all homes by tools like NREL’s Home
Energy Cost Estimator, including homes that do not
have third-party ratings or certifications.
This tool is described in greater detail in Appendix
D. This one metric could then be used by lenders
to identify good candidates for green mortgages
and by appraisers and AVMs as a baseline for value
adjustments for home efficiency. This would also
allow for the collection of data over time that can
be aggregated and analyzed to better measure the
benefits of green homes for lenders, borrowers, and
capital markets investors.
•
Measure, disclose, and reduce GSE portfolio
emissions and climate risk exposure: Many of the
world’s largest banks and financial institutions
have committed to climate-align their portfolios
(i.e., bring lending and investment activities
into alignment with 1.5°C-consistent emission
pathways).
52
Similarly, the federal government
www.rmi.org
/
31Build Back Better Homes
through FHFA can call on the GSEs to start
measuring and disclosing carbon emissions
estimates for their portfolios, establish reduction
targets in line with federal climate goals, and
develop programs to reduce those emissions
accordingly. Existing DOE and market-available
tools can be leveraged to accelerate this
measurement process.
In addition, FHFA can work with other federal
agencies (e.g., NOAA, FEMA) to invest in or start
developing asset-level data that would enable the
GSEs to assess and disclose their portfolios’ climate
risk exposure to increasing floods, wildfires, winds,
sea-level rise, and other sources.
53
Scaling single-
family green mortgages can be a key tool for both
mitigation and adaptation.
•
Position mortgages to become a primary vehicle
for financing home performance and resilience
upgrades: FHFA could push the GSEs to provide
stronger incentives for lenders to market and
include their single-family green mortgage products
as built-in, opt-out options in all new and refinance
mortgage transactions. The resulting market size
and impacts could double or triple earlier estimates
as many more consumers could be reached with
information about cost-effective upgrades. This
would also drive broader market adoption as non-
agency and government mortgage lenders would
likely follow suit in offering similar product designs.
At a minimum, this mechanism could offer the
basic improvement financing by utilizing AVM-
based evaluations instead of full as-completed
appraisals to streamline origination for lenders.
The GSEs can help build out the green home
improvement market in this way, with the
labor need met quickly (as was the experience
in Portland and Austin with rating disclosure
ordinances). This would help meet the needs of
most US homes to make upgrades while also
aligning with the climate and ESG goals of major
lending institutions and capital markets investors.
• Although not the focus of this report,
the Departments of Housing and Urban
Development, Agriculture, and Veterans Affairs
already require newly built homes with FHA
loans and other federally assisted mortgages to
meet building energy codes (roughly a quarter
of mortgages for new homes). However, the
criteria are mostly still at 2009 code levels and
should be updated to 2021 code levels, which
would cut energy use of these buildings by at
least a third.
54
These agencies should adopt the
2021 code and the GSEs can be required to do
the same, ensuring that even more new homes
are built to high performance standards.

Conclusion

www.rmi.org
/
33Build Back Better Homes
Borrower Story #1:
A young couple was looking to buy a newly built
townhome as their first home, but they were unsure
that would be possible. When they found a new
townhome certified to the DOE Zero Energy Ready
Home standard, they were pleasantly surprised
to see how low the utility bills were estimated to
be on the real estate listing. They were even more
surprised when their loan officer told them the
energy savings compared to a standard new home
could be considered funds available to be spent
on their mortgage payments. Additionally, the
high performance certification on this home would
qualify them for a discounted interest rate.
The energy cost and interest savings amounted to
$100 per month—enough to allow them to afford
the home. Their mortgage was bundled as part of a
top-tier green MBS pool, enabling their lender and
Fannie Mae to claim ESG credit for the transaction.
What could this market look like in practice when fully up and running? Below are three
hypothetical stories of borrowers benefiting from a robust green mortgage and MBS market:
Borrower Story #2:
To get ready for a comfortable retirement, an older
couple living in a rural area added insulation to
their 1950s home and replaced their furnace with
a high-efficiency heat pump (both paid for with
cash savings). Through a local utility program they
received a Home Energy Score (HES) report that
rated their home an 8 out of 10.
After her husband died a few years later, the widow
decided to move closer to family and listed her
home for sale. When the eventual buyer informed
their loan officer of the home, the loan origination
software confirmed this home was a high performer
that would qualify as Group 3 green mortgage. The
buyer received preferential mortgage terms and
paid a slightly higher price for the home, allowing
the widow to more than recoup her investment in
the upgrades because the appraised value took into
account the high HES.

www.rmi.org
/
34Build Back Better Homes
Unlocking the single-family green mortgage and MBS
market is not only possible today—given advances in
data and automation as well as favorable financial
market and policy trends—it is also necessary. Five
years from now, conversations between friends and
neighbors about green home improvements financed by
mortgages and recognized in the transaction process
can become mainstream all over the country. Time is
of the essence to advance readily deployable solutions
capable of addressing the dynamic, intersectional
crises facing the housing market. Done correctly,
single-family green mortgage products can shift capital
and resources at scale to make living situations more
affordable, healthy, equitable, and resilient—better
serving American households and especially those who
stand to benefit disproportionately.
Scaling access to low-cost green improvement financing
is also in the mortgage industry’s best interests: it
offers an enormous new market opportunity catering
to both consumer and investor demand, while also
helping to future-proof the mortgage business itself
by mitigating ever-increasing climate risk. Mortgages,
through their inherent role in financing America’s
housing, can soon become a primary vehicle for
deploying billions of dollars toward these goals each
year. This report highlights targeted interventions
toward this end, but is also intended to serve as a
starting point in this continuously evolving space. A
coalition of home performance experts and other key
partners already collaborating with ambitious state and
local governments stands ready to support Fannie Mae,
Freddie Mac, FHFA, and other mortgage market leaders
in this important and timely pursuit.
Borrower Story #3:
A middle-income family was buying a move-up
house that needed some work. They were not first-
time home buyers so they felt they understood the
mortgage process. But they were pleased when the
loan officer saw that this home might have higher
utility bills and asked if they were interested in
financing green or energy-related improvements.
By this point they knew the house they were buying
had an old, inefficient water heater, was missing
crawlspace insulation, and had almost no insulation
in the attic. They were able to take advantage of
the basic eligible measures offered through Freddie
Mac to finance a new heat pump water heater and
new insulation. And they worked with a contractor
to have both projects installed within six months
after closing. They felt better knowing they had
created a more comfortable living environment for
their children.

Appendices

www.rmi.org
/
36Build Back Better Homes
Appendix A
Calculations and Assumptions
10-year impact estimatesExhibit A1
Certified New
Construction
High-
Performance
Deeper
Retrofits
Avg 25%
Savings
Basic
Retrofits
Avg 15%
Savings
Avg Loan
Amount
10-Yr Avg GSE Volume
Avg Project Cost
$12,500 $5,000 $250,000 $1,069,000,000,000
Growth
5% 10% 10%
Year
# New
Homes
#
Existing
Homes
#
Existing
Homes
Total
Homes
Mortgage
Volume
Project
Financing
Green Mortgage
Volume
% of
GSE Volume
1
70,000 90,000 450,000 610,000 $152,500,000,000 $3,375,000,000 $155,875,000,000 14.6%
2
73,500 99,000 495,000 667,500 $166,875,000,000 $3,712,500,000 $170,587,500,000 16.0%
3
77,175 108,900 544,500 730,575 $182,643,750,000 $4,083,750,000 $186,727,500,000 17.5%
4
81,034 119,790 598,950 799,774 $199,943,437,500 $4,492,125,000 $204,435,562,500 19.1%
5
85,085 131,769 658,845 875,699 $218,924,859,375 $4,941,337,500 $223,866,196,875 20.9%
6
89,340 144,946 724,730 959,015 $239,753,777,344 $5,435,471,250 $245,189,248,594 22.9%
7
93,807 159,440 724,730 977,977 $244,494,171,211 $5,616,653,625 $250,110,824,836 23.4%
8
98,497 175,385 724,730 998,611 $249,652,767,146 $5,815,954,238 $255,468,721,384 23.9%
9
103,422 192,923 724,730 1,021,074 $255,268,593,491 $6,035,184,911 $261,303,778,403 24.4%
10
108,593 212,215 724,730 1,045,538 $261,384,441,827 $6,276,338,652 $267,660,780,479 25.0%
Total
880,452 1,434,368 6,370,943 8,685,763 $2,171,440,797,895 $49,784,315,176 $2,221,225,113,071
Notes: Market size assumes year 1 green mortgages comprising 450,000 basic retrofits or 5% of all ~9 million annual single-family mortgage
loans, 90,000 deeper retrofits conservatively assumed at 1% of all loans, and 70,000 green new construction homes per proposed framework.
Combined this is just under 15% of GSE volume (half the level achieved by Fannie Mae’s multifamily green business), reaching 25% by year 10.
Basic and deeper retrofits are assumed to grow 10% per year (for basic, leveling off after year 5) and new construction at 5%. Other project-
level assumptions are detailed below. Cumulative impacts are based on weighted average savings (weighted by market share) for existing
home retrofits.

www.rmi.org
/
37Build Back Better Homes
Weighted Average
Savings
Weighted Average Net
Cost Savings
Weighted Average
Household CO
2
Savings
16.7% $316 1.45 metric tons
Year Retrofitted Homes Cumulative Net Savings
Cumulative CO
2
Avoided
(Metric Tons)
1
540,000 $1,706,400,000 7,803,000
2
594,000 $1,689,336,000 7,724,970
3
653,400 $1,651,795,200 7,553,304
4
718,740 $1,589,852,880 7,207,055
5
790,614 $1,499,004,144 6,854,623
6
869,675 $1,374,087,132 6,283,405
7
884,170 $1,117,590,867 5,110,503
8
900,114 $853,308,109 3,901,994
9
917,652 $579,956,376 2,652,016
10
936,945 $296,074,554 1,353,885
Total
7,805,311 $12,357,405,262
56,507,755
Jobs Created
8
jobs per $ million of consumer savings
11
jobs per $ million of investment
$12,357
million of consumer savings
$49,784
million of investment
98,859
jobs from savings
547,627
jobs from investment
646,487
total jobs created
Sources: Household carbon footprint based on US
EPA data (8.67 metric tons per home x 16.67%
weighted average savings) https://www.epa.gov/
energy/greenhouse-gases-equivalencies-calculator-
calculations-and-references; job creation estimates
based on Assessing National Employment Impacts
of Investment in Residential and Commercial Sector
Energy Efficiency: Review and Example Analysis, Pacific
Northwest National Laboratory, 2014, https://www.
pnnl.gov/main/publications/external/technical_
reports/PNNL-23402.pdf.

www.rmi.org
/
38Build Back Better Homes
Example project-level financial benefitsExhibit A2
NET SAVINGS Basic Retrofit Deeper Retrofit
Estimated Project Cost
$5,000 $12,500
National Average Home Utility Costs/Year
$2,646 $2,646
Average Project Savings
15% 25%
Average Utility Cost Savings
$397 $662
Present Value of 30-Year Savings*
$16,536 $27, 559
Estimated GSE Conventional Mortgage Amount
$250,000 $250,000
Estimated Interest Rate
2.5% 2.5%
Average Mortgage Payments/Year
$11,854 $11,854
Average Green Mortgage Amount
$255,000 $262,500
Green Mortgage Payments/Year
$12,091 $12,446
Incremental Green Mortgage Payment/Year
$237 $593
Sum of Incremental Payments (30 Years)
$7,112 $17,780
Average Annual Household Net Savings*
$314 $326
Notes: Examples for illustrative purposes only and results will vary depending on measures installed. Green mortgage balance assumes
loan-to-value ratio enables 100% of project costs to be financed. Example does not account for incremental income tax benefits from higher
interest payments, or other potential value streams such as reduced household health and safety costs or increased home value. (A meta-
analysis of several studies found a 4.3% value premium for certified green homes,
55
which is likely based on perception given that appraisal
standards do not yet explicitly account for home performance and thus may be understated.)
Average utility costs include energy and water. The assumed average loan size of $250,000 is based on actual 2019 average single-family
loan size of $246,222 for Freddie Mac and $259,897 for Fannie Mae. The assumed $5,000 basic retrofit project size is based on Freddie Mac
and proposed Fannie Mae thresholds, and the $12,500 deeper retrofit project size is based on 5% of average loan amount; 15% and 25%
savings are assumed based on field experience relative to these project costs. The assumed 2.5% interest rate is based on current market
rates for 30-year fixed mortgages. The analysis assumes 2.0% annual energy price escalation based on actual 1981–2011 average retail
electricity price increase.
Sources: Bureau of Labor Statistics, Consumer Expenditure Survey 2019; US Energy Information Administration Electricity Data Browser
https://www.eia.gov/electricity/data/browser/; Fannie Mae 2019 10-K (page 77) https://www.fanniemae.com/sites/g/files/koqyhd191/files/
migrated-files/resources/file/ir/pdf/quarterly-annual-results/2019/q42019.pdf; Freddie Mac Single-Family Origination Summary https://
clarity.freddiemac.com/historical/origination/origination-summary; www.bankrate.com accessed 2/14/2021.
*Assumes 2% annual energy price escalation; net savings remain the same regardless of original mortgage size
www.rmi.org
/
39Build Back Better Homes
Appendix B
Proposed Calibration Framework for Green Mortgages
This appendix proposes a framework and methods
similar to those used by the GSEs in Form 4250,
56
which groups and details various green building
certifications approved by the GSEs to qualify as a
green mortgage loan for green MBS. Below are group
definitions from Fannie Mae’s Multifamily Green Bond
Framework for reference.
57
The multifamily framework only references
certifications, but our suggested groupings for single-
family include the use of qualifying ratings from either
RESNET’s Home Energy Rating System (HERS) or
DOE’s Home Energy Score system. The use of both
ratings aligns with the policy guidance developed by
the National Association of State Energy Officials in
the EMPRESS project, which aimed to harmonize the
usage of these two scoring systems. In our proposed
format these ratings could align with either Group
2 or Group 3, as defined below, but they would not
qualify a home for either of the top groups because
they do not have ventilation requirements. With a few
edits (in italics) this single-family framework would
align with the multifamily framework.
“Towards Zero” Group: This group recognizes
buildings aiming for net-zero energy (NZE) or water
use, or energy use reductions at NZE-ready levels.
An NZE-ready building is one that is sufficiently
energy efficient such that if solar photovoltaic (PV)
were added, it could operate at NZE.
Group 1: High Performance + Ventilation
Requirements: Group 1 is for green building
certifications that require projected energy
savings of at least 20% relative to federal model
codes, plus ventilation requirements for new
construction projects. Proper ventilation is a
particularly important consideration in energy-
efficient buildings that typically have tight
building envelopes and, thus, more limited outdoor
air exchange.
Group 2: High-Efficiency Buildings: These
certifications must require projected energy
savings of more than 15% relative to federal
model codes. This group does not necessarily have
ventilation requirements.
Group 3: Base Green Building Certifications:
Group 3 certifications must require projected
energy savings of 10% or more relative to the
national baseline or a score improvement akin to
at least a 25% reduction in energy use. This group
does not necessarily have ventilation requirements.
These same group definitions can largely apply to
designate single-family green mortgages (as adjusted
below), and in addition we recommend one more
grouping for the single-family market context:
Group 4: Basic Retrofits: These would encompass
all green mortgages that financed basic
improvements deemed to deliver at least 15%
savings without the need for an energy report.
The GSEs’ underwriting requirements cap these
amounts at small levels. We propose providing
green designation status for mortgages that
include at most $5,000 for this use (assuming
Fannie Mae increases its current $3,500 threshold;
Freddie Mac’s threshold is currently $6,500).
In addition to the four tiers borrowed from Fannie
Mae’s Multifamily Green MBS Framework, we propose
adding this fifth tier (Group 4: Basic Retrofits) for
projects using the green mortgage criteria for basic
improvements. These projects will have completed
improvements selected from prequalified eligible
measure lists (see page 26) that are deemed to
deliver at least 15% whole-home savings. These
projects represent a lighter shade of green, but it
is still critical to include them in the single-family
framework for their capacity to scale loan volumes
and realize the benefits of ample green data for more
accurate valuation while also supporting borrowers

www.rmi.org
/
40Build Back Better Homes
with thinner margins for loan amounts. Including
basic retrofits in Group 4 creates the opportunity
for nearly any home or borrower to qualify and
participate in this market. This includes opportunities
for serving borrowers and homes with a few “low
hanging fruit” projects for improvements.
The size of single-family loans is much smaller than
those for multifamily buildings, and single-family
homeowners will not have the same capacities as
multifamily landlords for ongoing measurement,
verification, and reporting. In recognition of this, we
recommend incorporating score improvements (i.e.,
point changes) into the framework, which translate
into estimated energy savings. The proposed score
improvement levels required to qualify for Group
3 translate to more than 25% savings and will be
much simpler to track for all parties involved. This
would also mean homeowners would not be required
to submit utility bills annually, as is required for
multifamily buildings. There have been studies of
both HERS and Home Energy Score that show they
work well on average to estimate annual energy
usage.
58
The GSEs can leverage these asset rating
tools to estimate streams of energy savings. Score
improvements can be measured using HERS or Home
Energy Score as follows:
•
Any home with a HERS rating above 100 must
reduce the HERS score by 35 points to qualify.
•
Any home with a Home Energy Score of 1, 2, or 3
must increase the score by 4 points (i.e., to at least
5, 6, or 7, respectively) to qualify.
Placement in the following framework is our
best estimate and subject to further analysis
and refinement:
Table of qualifying certifications and rating values for single-family homesExhibit B1
TOWARDS ZERO CERTIFICATIONS
ORGANIZATION CERTIFICATION VERSION LEVEL
International
Living Future
Institute
Living Building Challenge 2, 3, 3.1, 4 Certified Living
Zero Carbon Certification 1 Certified Zero Carbon
Zero Carbon Certification Not Applicable Zero Energy Certified
Passive House
Institute (PHI)
Certified Passive House 2016 Classic, Plus, Premium
EnerPHIT Certified Retrofit 2016 Classic, Plus, Premium
Passive House
Institute US
(PHIUS)
PHIUS+ Certified
2015 PHIUS+ 2015, PHIUS+ Source Zero
2018
PHIUS+ Core, PHIUS+ 2018, PHIUS+
Source Zero
USGBC
LEED Zero LEED Zero Zero Energy, Zero Water
Home Innovation
National Green Building Standard
(NGBS) Green
2020 NGBS Emerald + Zero Energy

www.rmi.org
/
41Build Back Better Homes
GROUP 1 CERTIFICATIONS
ORGANIZATION CERTIFICATION VERSION LEVEL
Build It Green
GreenPoint Rated
1.9–2.1 Certified, Silver, Gold, Platinum
6 Certified, Silver, Gold, Platinum
7 Certified, Silver, Gold, Platinum
8 Certified, Silver, Gold, Platinum
US Dept. of Energy
Zero Energy Ready Home Certified
US Environmental
Protection Agency
ENERGY STAR Certified Homes
3
Certified3.1
3.2
Earth Advantage
Earth Advantage Home Certification Earth Advantage Zero Energy Ready
USGBC
LEED BD+C: Homes
3 Certified, Silver, Gold, Platinum
4 Certified, Silver, Gold, Platinum
GROUP 2 CERTIFICATIONS/RATINGS
ORGANIZATION CERTIFICATION VERSION LEVEL
Build It Green
GreenPoint Rated Existing Home
Whole Home
2.1 Certified, Silver, Gold, Platinum
Built Green
Built Green 4-star, 5-star, Emerald
Earth Advantage
Earth Advantage Home Certification Silver, Gold, Platinum
Southface
EarthCraft
2012 Certified, Silver, Gold, Platinum
2014 Certified, Silver, Gold, Platinum
1 Certified, Silver, Gold, Platinum
2 Certified, Silver, Gold, Platinum
Home Innovation
Research Lab
NGBS Green Home Certification
2015 Bronze, Silver, Gold, Emerald
2020 Bronze, Silver, Gold, Emerald
US Dept. of Energy
Home Energy Score 10
RESNET
HERS Rating 55 or less

www.rmi.org
/
42Build Back Better Homes
GROUP 3 CERTIFICATIONS/RATINGS (Delivering 25% Whole-Home Energy Savings)
ORGANIZATION CERTIFICATION VERSION LEVEL
Home Innovation
Research Lab
NGBS Green Home Remodeling
Certification
2012, 2015 Bronze, Silver, Gold, Emerald
US Dept. of Energy
Home Energy Score
8–9
or 4-point improvement
RESNET
HERS Rating
56–65
or 35-point improvement
GROUP 4 BASIC RETROFITS (Delivering 15% Whole-Home Energy Savings)
ORGANIZATION CERTIFICATION VERSION LEVEL
Fannie Mae
HomeStyle Energy without energy
report
Installation of prequalified
improvements with a minimum 15%
deemed savings (aligns with at least
$5,000 spent; requires Fannie Mae to
increase from current limit of $3,500)
Freddie Mac
GreenCHOICE without energy
report
Installation of prequalified
improvements with a minimum 15%
deemed savings (aligns with at least
$5,000 spent)

www.rmi.org
/
43Build Back Better Homes
Appendix C
Existing Green Mortgage Origination Process Map
Existing green mortgage origination process map based on the GSEs’ selling guides
59
Exhibit C1

www.rmi.org
/
44Build Back Better Homes
Appendix D
NREL Home Energy Cost Estimator Methodology
This appendix summarizes a draft unpublished
methodology white paper by the National Renewable
Energy Laboratory (NREL) for calculating energy cost
estimates (ECEs) of single-family detached homes
based on a handful of attributes commonly found in
residential appraisals. The objective of this tool is to
demonstrate accurate cost estimations for single-
family detached homes using readily available inputs
that, in turn, can be leveraged for a range of potential
use cases in the market, including standard home
appraisal processes.
Because a home’s overall energy performance is the
product of many complex (and often hidden) home
energy features and characteristics, stakeholders
across the residential industry who stand to benefit
from this information have long been challenged in
factoring it into decision-making. As a result, DOE and
NREL set out to develop a tool capable of generating
conservative energy cost estimates for single-family
homes in the United States, based on nationally
standardized data. These conservative ECEs are
intended to mitigate risk for both borrowers and
lenders by enabling more complete homeownership
costs to be considered, and serve as a baseline upon
which energy costs of upgraded homes can
be compared.
The following diagram shows the general steps in
determining a home ECE (note that Form 1004 is the
GSEs’ Uniform Residential Appraisal Report):
Workflow diagram for estimating annual home energy costs Exhibit D1
Notes: ResStock is used for energy modeling and the Home Energy Cost Estimator represents post-processing of the data.
Weather Data
Building
Input Data
Energy Use
Lookup Table
Local Utility
Rates
Energy Cost
Estimate
($/year)
User Inputs
(Form 1004)
ResStock™
Energy Cost
Estimator

www.rmi.org
/
45Build Back Better Homes
To select inputs for building models, the tool
considers responses on typical appraisal forms that
are most relevant to a home’s energy loads. The
table below shows the six common appraisal fields
chosen to inform the energy cost estimator, alongside
the corresponding ResStock parameters, and the
number of possible options for each parameter. These
inputs are chosen because they closely impact the
energy demand of a home and can be pulled from
the appraisal form, while limiting the computational
resources needed for larger sets of inputs. To ensure
that each combination of these options is represented
with a unique building model, NREL evenly distributes
the frequency of each option in the ResStock sampling
routine and generates 362,880 models.
Appraisal form inputs mapped to ResStock parameters and the number of ResStock
options for each
Exhibit D2
Form 1004 Input ResStock Parameter # of Options Option Values
Zip Code
Weather File Location 216 Atlanta, Denver, etc.
Age
Vintage 7 <1950s–2000s
Floor Area
Floor Area 4 1,000–4,000 ft
2
Cooling
Cooling Type 3 Central, Room, None
Utilities
Heating Fuel 5 Natural Gas, Electric, etc.
Foundation
Foundation Type 4 Slab, heated basement, etc.

www.rmi.org
/
46Build Back Better Homes
The ResStock sampling routine decides the likeliness
of selecting options using a unique distribution
within each parameter, often dependent on other
parameters such as location, home size, or vintage.
However, to maintain consistency among the ECE
building models, and prevent outlying options
from skewing results, NREL fixes distributions of
options for the remaining parameters based on their
categorization. The remaining inputs not relayed from
the Uniform Residential Appraisal Report (Form 1004)
are categorized and assigned in three ways:
1. Energy-related parameters, such as HVAC
systems or insulation R-values, are fixed at the
20th percentile of efficiency for a given set of
dependencies. The 20th percentile is determined
by sorting options from least to most efficient and
provides a conservative estimate of energy demand.
2. Design parameters, such as garage size or number of
stories, have a less direct impact on energy demand,
and cannot be sorted by efficiency. These are fixed
at the most common option for each parameter.
3. Operational parameters, such as hot water draw
schedules, are set to a single schedule.
Upon fixing input options for the building models,
ResStock utilizes high-performance computing to
simulate models and generate annual energy use
data for the unique combinations of appraisal form
inputs. This energy data includes electricity, natural
gas, propane, and fuel oil loads, and is the basis for
determining final cost estimates. The methodology
for ECEs involves post-processing steps to expand
the potential input options and translate energy data
to consumer costs. The figure below shows example
inputs and their outputs:
Example inputs and outputs of the ECE lookup toolExhibit D3
area = 1025
zipcode = 97035
vintage = 1990
heating = 'Natural Gas'
cooling = 'Central'
foundation = 'Crawl'
Energy Cost Estimate: $1,350/yr
Total Electricity: 28.4 mbtu/yr
Total Natural Gas: 41.5 mbtu/yr
Total Propane: 0.0 mbtu/yr
Total Fuel Oil: 0.0 mbtu/yr
Total Energy: 69.9 mbtu/yr

www.rmi.org
/
47Build Back Better Homes
To test and analyze ECE data, NREL retrieved a
sampling of homes from the Home Energy Score
database and calculated what the energy estimates
would be using the ECE tool for those houses. In
this way NREL could use the HES data as a “truth
standard” for comparison. The figures below compare
the cost data. In general, the ECE estimates costs to
be higher than the HES, because all energy-related
parameters are assumed to be the 20th percentile in
efficiency. This results in a majority of ECE costs being
0%–30% higher than HES, underscoring the tool’s
conservatism. Additionally, ECE costs have a direct
correlation with HES costs. Data points that diverge
from this correlation have ECE parameters that do not
align with the HES because 1) they are not available
in the appraisal form, and 2) the assumptions used in
ResStock do not match that home.
Distribution of percent differences between the ECE and HESExhibit D4
Notes: (ECE Cost – HES Cost) / (HES Cost); positive percent differences indicate the ECE overpredicts compared to HES, while
negative percent differences indicate an underprediction.
20%
18%
16%
14%
12%
10%
8%
6%
4%
2%
0%
% of Homes
Energy Cost Percent Difference
Difference = ECE - HES
% Homes < 0 16.45%
% Homes >= 0 83.55%
-40% -30% -20% -10% 0% 10% 20% 30% 40% 50% 60% 70% 80% 90% 100% 110% 120%
0.4%
2.4%
4.5%
9.9%
15.9%
18.7%
17.1%
13.2%
8.4%
4.6%
2.3%
1.2%
0.7%
0.4% 0.3% 0.2%

www.rmi.org
/
48Build Back Better Homes
Scatter plot of yearly energy costs as calculated by HES and by the ECEExhibit D5
Notes: The fit line, y=1.2x, is the expected relationship given the assumption of lower efficiency in the ECE. The R
2
and RMSE values
are calculated from this line.

www.rmi.org
/
49Build Back Better Homes
Appendix E
ResStock Representative State-Level Information
ResStock’s State Fact Sheets provide a summary of
the cost-effective residential savings potential and
top priority energy efficiency improvements in that
state. This same data can be customized, simplified,
and reconfigured to serve the needs of lenders and
loan officers in their interactions with borrowers.
ResStock accounts for the vast diversity in age,
size, construction practices, installed equipment,
appliances, and resident behavior of the single-family
and multifamily residential housing stock nationally,
in addition to the diverse range of climates. As an
example, Pennsylvania’s top 10 improvements are
shown below.
Pennsylvania top 10 improvements Exhibit E1
Source: ResStock State Fact Sheets https://resstock.nrel.gov/factsheets/
www.rmi.org
/
50Build Back Better Homes
Appendix F
Additional Green Mortgage Product/Process Recommendations
Below are additional recommendations for the
GSEs from a home performance perspective. These
recommendations are intended to improve their single-
family green mortgage products and/or processes to
streamline adoption and scale impact:
•
Adjust guidelines for allowances for small projects:
Energy reports are currently not required by the
GSEs for basic energy and water efficiency upgrades
with costs below $3,500 for Fannie Mae or $6,500
for Freddie Mac. We recommend that Fannie Mae
increase its threshold to at least $5,000, and ideally
higher to align with Freddie Mac’s and reduce market
confusion. Currently as-completed appraisals are
required for all improvements, regardless of size,
including for smaller measures like programmable
thermostats. Green mortgages could be streamlined
significantly if basic improvements below these
thresholds only require evaluations (i.e., automated
AVM-based value adjustments confirmed manually
by appraisers). As-completed appraisals would
remain necessary for larger retrofit projects above
these thresholds.
•
Extend timeline for previous energy reports:
Per GSE seller guidelines, a property may use an
energy report that is less than 120 days old for
green mortgage financing. Extending this window
to at least two years will limit barriers to borrowers
seeking financing for single-family properties. On
the multifamily side, green building certifications
dated within five years are recognized.
•
Improve data integration and facilitate systems
updates: Fannie Mae requires that lenders’ loan
origination systems (LOS) be able to submit certain
energy data fields to Desktop Underwriter, Fannie
Mae’s automated underwriting system. Most
lenders have not made system updates for these
fields. Both GSEs require lenders to submit Uniform
Loan Delivery Dataset (ULDD) data upon loan
delivery. Lender systems must be able to populate
these fields specific to green mortgages and
many have not yet been updated to do so, adding
complication that limits adoption. The GSEs can
work with the industry to determine if incentives or
other mechanisms can spur LOS updates to better
streamline data transfers. At the same time, the
GSEs should ensure that their Uniform Appraisal
Dataset redesign initiative incorporates a few
critical foundational data fields (e.g., home energy
cost estimate for all homes) to support these goals.
•
Expand underwriting: Through data-driven
analyses, the GSEs can evaluate the impact of
utility expenses on borrowers and incorporate this
information into standard underwriting practices.
This would allow GSEs to beneficially account
for reduced housing costs through green home
improvement measures. Both Fannie Mae and
Freddie Mac already have guidance in place to
allow for higher expense ratios when improvements
meet a certain efficiency threshold, but only for
manually underwritten loans. By conducting pilots
with access to much more information about home
energy costs, expanded criteria can be considered
and built into automated underwriting.
•
Expand Duty to Serve credit: We recommend that,
after the 2022–2024 plan cycle, FHFA reopen the
DTS rulemaking. When the regulation is revised,
we recommend amending Section 1282.34(d)(3)
of the regulation to include any and all types of
upgrades financed by green mortgages (including
increasingly important resilience improvements)
as qualifying for Duty to Serve credit. This would
align with the GSEs’ existing green mortgage
requirements and would ease FHFA’s added
qualifying and reporting requirements. This
approach is reasonable given the multiple benefits
green improvements can provide to LMI households
and the reduced risks for the GSEs.

www.rmi.org
/
51Build Back Better Homes
Appendix G
Model Language for the GSEs’ 2022–2024 Duty to Serve Plans
Duty to Serve Overview
Under the Housing and Economic Recovery Act of
2008, the “Duty to Serve” provisions established
by their regulator, the Federal Housing Finance
Agency (FHFA), require Fannie Mae and Freddie Mac
to facilitate a secondary market for mortgages on
housing for very low-, low-, and moderate-income (LMI)
families in three underserved markets: manufactured
housing, affordable housing preservation, and rural
housing. To fulfill this mandate, the FHFA’s Duty
to Serve Regulation, published in December 2016,
requires each GSE to adopt three-year Underserved
Markets Plans with specific activities. The Affordable
Housing Preservation market includes activities
related to purchasing energy and water efficiency
improvement loans on multifamily and single-family
properties with Fannie Mae or Freddie Mac first
mortgage liens. Both GSEs can incorporate this
report’s recommendations into their new plans due
to FHFA in May 2021 for the 2022–2024 period. More
information can be found on FHFA’s website.
60
Model Language for 2022–2024
Plans
The following proposed objectives and
actions illustrate how the GSEs can take the
recommendations in this report and build them into
their upcoming Duty to Serve plans. These high-
level actions will need further details, narrative, and
impact discussion in the submission of the plans in
order to meet FHFA’s requirements.
Proposed objectives and actions for 2022–2024Exhibit G1
Objective: Increase annual purchases of green mortgage loans from less than 200 in number to 5% of all
loans for low- and moderate-income families by 2024.
Proposed Actions for 2022–2024
Year 1—Loan Product
•
To enable borrower and lender identification of green home improvement potential and to address burdensome project evaluations for
lenders:
•
Evaluate tools like NREL’s Home Energy Cost Estimator that can auto-generate a home’s energy cost estimate (ECE).
•
Develop and execute a pilot to assess one or more tools’ impact on consumer decision-making in pursuing green mortgage products.
•
Develop a plan to allow lenders to use prequalified eligible measure lists in order to streamline cost-effectiveness and eligibility
determinations.
•
Initiate discussions with the Uniform Appraisal Dataset (UAD) redesign initiative project team to share evaluation findings and
consider necessary UAD data fields to support this objective.
Year 2—Loan Product
•
Based on findings in year 1, finalize the terms and publish guidance on how to incorporate such information into the appraisal
standards and underwriting process to identify green mortgage candidates.
•
Collaborate with UAD redesign project managers to ensure key new data fields are added for home ECEs and other green home data in
alignment with Duty to Serve and broader GSE goals.
•
Establish a lender outreach plan to promote use of new tool(s) and prequalified eligible measure lists so they can increase their ability
to effectively market green mortgage products.
Year 3—Loan Purchase
•
Purchase a number of green mortgage loans representing 5% of all loans for low- and moderate-income families.

www.rmi.org
/
52Build Back Better Homes
Objective: Increase the percentage of Duty to Serve eligible green mortgage loans for basic retrofits
(saving >15%) purchased annually that are underwritten with automated valuation models from zero to
50% by 2024.
Proposed Actions for 2022–2024
Year 1—Loan Product
•
Evaluate how to recognize the value added by basic green improvements below stated energy report size thresholds using automated
methods, in collaboration with home performance experts.
•
Develop a methodology for fulfilling the completion certification without the use of a full as-completed appraisal.
•
Identify third parties (e.g., qualified HERS or Home Energy Score raters) who can inspect, verify, and document green improvements
after completion.
•
Develop a plan to pass findings from the inspection to automated valuation models (AVMs).
Year 2—Loan Product
•
Work with industry stakeholders to ensure project completion data is integrated and accessible to AVMs and to lenders via a
green database.
•
Develop and publish guidelines for when automated valuation is permitted, a full as-completed appraisal is required, and a combination
of automation and verification is acceptable.
•
Work with key stakeholders in the appraisal industry to develop training and educational materials for appraisers and evaluators about
changes to the valuation approach for this purpose.
Year 3—Loan Purchase
•
Purchase a number of green mortgage loans underwritten with AVMs that represent 50% of Duty to Serve eligible green
mortgage loans.
Objective: In 5 of the top 10 energy-burdened areas of the United States, annually purchase a number of
green mortgage loans that represent 10% of all loans for low- and moderate-income families by 2024.
Proposed Actions for 2022–2024
Year 1—Outreach
•
Identify five underserved communities with disproportionate concentrations of low-performing homes that make it more expensive to
maintain safe and comfortable conditions (e.g., leveraging ACEEE energy burden data).
•
Develop a plan to test new approaches to reach populations in these areas that are currently not well-served by access to comfortable,
safe, and healthy green housing.
•
Execute a pilot in at least two of these markets to more effectively offer the benefits of green mortgages.
Year 2—Outreach
•
Develop and execute an incentive program for first-time home buyers, in collaboration with community programs and partnerships, to
combine down payment assistance and affordable lending products with green mortgage financing in the five selected areas.
Year 3—Loan Purchase
•
In the five selected energy-burdened areas, purchase a number of green mortgage loans representing 10% of all loans for low- and
moderate-income families.

www.rmi.org
/
53Build Back Better Homes
Objective: Increase liquidity for green improvements and meet investor demand for green MBS
by issuing 5% of all single-family MBS backed by green mortgages that finance existing home
improvements by 2024.
Proposed Actions for 2022–2024
Year 1—Loan Product
•
Outline a calibration framework with tiers based on levels of energy efficiency for planned green improvements to existing homes (in
addition to new construction):
•
Engage investors of ESG securities and reporting organizations to understand demand, drivers, and required disclosures for green
bond securities and to allow them to review the framework.
•
Assess how required disclosure data on proposed and completed improvements will be consolidated from third parties and green
databases.
•
Assess the feasibility to identify improvements financed outside the mortgage process that can be used to categorize a home’s
green tier within the framework.
•
Develop and execute a pilot that evaluates expected savings on planned improvements with actual savings on completed
improvements.
•
Outline required changes to the ULDD and impacted systems to support required disclosures for the framework; engage industry
stakeholders to begin the update process.
Year 2—Loan Product
•
Update MBS disclosure documents to incorporate the calibration framework.
•
Continue to lead efforts to update the ULDD; develop a plan to support internal and external impacted systems.
Year 3—Loan Purchase
•
Issue a number of single-family MBS backed by green mortgages that finance existing home improvements that represents 5% of all
single-family MBS and that includes a proportionate number of mortgages for low- and moderate-income homeowners.
www.rmi.org
/
54Build Back Better Homes
Appendix H
Residential Green and Energy-Related Data Sources
Multiple databases and related data services have
been developed by nonprofits and government entities
to provide access to records of energy performance
for homes. Four example products that could act as
beneficial resources as discussed in this report include:
•
RESNET National Registry
•
HELIX from Northeast Energy Efficiency
Partnerships
•
Green Building Registry from Earth Advantage
•
ResStock Analysis Tool and Home Energy Cost
Estimator API service from National Renewable
Energy Laboratory
The RESNET National Registry allows a public user to
enter a street address at https://www.hersindex.com/
hers-rated-home-search/ to determine if that home
has a HERS rating. If the home does have a HERS
rating, then the following information is provided:
rating company that rated the home, date that rating
was completed, and the HERS Index Score of the
home. RESNET also offers an API service that can be
used to retrieve HERS records for a given address.
The Home Energy Labeling Information eXchange
(HELIX) is a multi-state project that aims to automate
the transfer of home energy data to Multiple Listing
Services (MLSs) across the Northeast region. HELIX
will make home energy information accessible to local
MLSs and other market interests (e.g., assessors,
appraisers, energy efficiency programs and service
providers, lenders, and energy code officials),
ultimately making the energy efficiency of homes
visible and better understood at the time of sale or
rental. Although HELIX focuses on the Northeast
region, it aims to provide a replicable, open-source
model that can be used throughout the country. The
project will include training delivered to real estate
professionals as well as continuous engagement with
stakeholders in the real estate market to ensure a
useful and effective product. For more information on
HELIX, visit https://neep.org/home-energy-labeling-
information-exchange-helix.
The Green Building Registry (GBR), developed by
Earth Advantage, is a software-as-a-service system
that aggregates green building data and makes it
available through a public search website and an
API to which listing services can directly connect.
The system went live in late 2017 in conjunction with
the City of Portland Home Energy Score program. It
directly auto-populates listings in the state’s largest
MLS and transforms Home Energy Score data into a
locally branded, two-page label format that provides
local energy prices, local carbon information, and
actionable linkage to contractors, financing products,
and incentives. In 2018 the GBR deployed state-level
reports based on Home Energy Score and HERS
data that align with the NASEO-endorsed EMPRESS
recommendations for home energy labels.
GBR contains all of the HERS Index ratings in the
RESNET National Registry; the green certification
data from LEED, NGBS, and the major regional green
certifications; solar data from select localities;
and Home Energy Score reports from select HES
Partners. GBR contains over 1.7 million third-party
verified home performance records. GBR has also
integrated the Home Energy Cost Estimator tool
from NREL to provide a reference value against
which verified energy cost estimates from ratings
can be compared. The GBR API is available to the
MLS systems nationwide. For more information
on the Green Building Registry, visit https://www.
greenbuildingregistry.com.
www.rmi.org
/
55Build Back Better Homes
The ResStock™ analysis tool is helping states,
municipalities, utilities, and manufacturers identify
which home improvements save the most energy and
money. Across the country, there’s a vast diversity
in the age, size, construction practices, installed
equipment, appliances, and resident behavior of the
housing stock, not to mention the range of climates.
These variations have hindered the accuracy of
predicting savings for existing homes. With support
from the US Department of Energy (DOE), researchers
at NREL developed ResStock. It is a versatile tool that
takes a new approach to large-scale residential energy
analysis by combining:
•
Large public and private data sources
•
Statistical sampling
•
Detailed subhourly building simulations
•
High-performance computing
This combination achieves unprecedented granularity
and, most importantly, accuracy in modeling the
diversity of the single-family housing stock. With
NREL supercomputing, the ResStock team has run
more than 20 million simulations using a statistical
model of housing stock characteristics. With this data,
researchers have uncovered $49 billion in potential
annual utility bill savings through cost-effective
energy efficiency improvements.
Detailed information on the technical and
economic potential of residential energy efficiency
improvements and packages is available for 48 states
domestically. Policymakers, program designers,
and manufacturers can use these results to identify
improvements with the highest potential for cost-
effective savings in a particular state or region, as well
as to help identify customer segments for targeted
marketing and deployment.
In 2020, NREL researchers used the ResStock
database to create the Home Energy Cost Estimator
tool described in Appendix D to produce a relatively
conservative estimate of energy consumption and cost
for any home in the United States.
For an example of how this data can be utilized, this
home record (https://us.greenbuildingregistry.com/
green-homes/OR10009268) shows that a home built
in 1912 has a poor Home Energy Score of 1. However,
the verified energy cost estimate (ECE) of $2,261/year
is substantially lower than the reference ECE provided
by NREL, which is $2,900/year. Reviewing the home’s
HES report (https://rpt.greenbuildingregistry.com/
hes/OR10009268.pdf) shows the home already has
an efficient furnace and some insulation installed, but
it could save another $681/year if straightforward
cost-effective improvements are made that have
paybacks of 10 years or less.
Another example would be this new home built in
2020 (https://us.greenbuildingregistry.com/green-
homes/OR10188324) that has a verified ECE of
$970/year from an HES report. This is compared with
a reference ECE from NREL of $1,450/year that might
be expected from a code-built new home of the same
size in this location.
Why Asset Ratings versus
Utility Bills?
Home energy costs can be derived from either asset
data (via ratings like HERS and Home Energy Score
and tools like NREL’s Home Energy Cost Estimator)
or operational data such as from utility bills. Asset
ratings provide modeled information using data about
a home’s design and physical characteristics to reveal
intrinsic energy performance with standardized
assumptions about how it is operated. Utility bills
provide operational data based on actual energy
use, occupancy, and behavior, which can change
significantly when a home’s occupants change (e.g.,
an elderly couple selling their home to a family of six).
This makes asset data and ratings more useful in the
context of real estate transactions and transfers of
ownership. For more on this distinction, visit https://
empress.naseo.org/home-energy-labeling-tools.
In addition, analysis by the EMPRESS project team
found that there are several laws that ban the sharing
of utility data, but there are no laws banning the public
sharing of asset ratings as of this writing. Please
see “Considerations and Best Practices for Publicly
Disclosing Energy Information” in the EMPRESS final
report for more detail: https://empress.naseo.org/
Data/Sites/21/media/documents/empress-project-
final-report_v1[1].pdf.
www.rmi.org
/
56Build Back Better Homes
1. Sarah LaMonaca, Tyeler Matsuo, Brian O’Hanlon,
and Lucy Kessler, Charting the Course to Climate-
Aligned Finance: Five Barriers to Alignment and
How a Sectoral Approach Can Help, RMI, 2020,
https://rmi.org/navigating-five-barriers-to-
climate-aligned-finance/.
2. “Record $269.5bn Green Issuance for 2020: Late
Surge Sees Pandemic Year Pip 2019 Total by
$3bn,” Climate Bonds Initiative, January 24, 2021,
https://www.climatebonds.net/2021/01/record-
2695bn-green-issuance-2020-late-surge-sees-
pandemic-year-pip-2019-total-3bn.
3. DM Anderson, DB Belzer, OV Livingston, and MJ
Scott, Accessing National Employment Impacts
of Investment in Residential and Commercial
Sector Energy Efficiency: Review and Example
Analysis, Pacific Northwest National Laboratory,
2014, https://www.pnnl.gov/main/publications/
external/technical_reports/PNNL-23402.pdf.
4. Lyubov Pronina and Tom Freke, “Why Bonds
Good for the Earth Now Carry a ‘Greenium’,”
Bloomberg Green, October 29, 2020, https://
www.bloomberg.com/news/articles/2020-10-30/
why-bonds-good-for-the-earth-now-carry-a-
greenium-quicktake; and S. MacAskill, E. Roca,
B. Liu, R.A. Stewart, and O. Sahin, “Is There
a Green Premium in the Green Bond Market?
Systemic Literature Review Revealing Premium
Determinants,” Journal of Cleaner Production,
Volume 280, Part 2, January 20, 2021, https://
www.sciencedirect.com/science/article/abs/pii/
S0959652620345352.
5. “Fannie Mae Issues More Than $100 Million of
Single-Family Green MBS Since April 2020,”
January 28, 2021, https://www.fanniemae.com/
newsroom/fannie-mae-news/fannie-mae-issues-
more-100-million-single-family-green-mbs-
april-2020.
Endnotes
6. “Center for Climate-Aligned Finance,” accessed
February 1, 2021, https://climatealignment.org/.
7. “Uniform Appraisal Dataset: Improving the Quality
and Consistency of Appraisal Data,” accessed
February 5, 2021, https://singlefamily.fanniemae.
com/delivering/uniform-mortgage-data-program/
uniform-appraisal-dataset.
8. “The Biden Plan to Build a Modern, Sustainable
Infrastructure and an Equitable Clean Energy
Future,” accessed February 14, 2021, https://
joebiden.com/clean-energy/.
9. “Consumer Expenditure Surveys,” US Bureau of
Labor Statistics data, 2019, https://www.bls.gov/
cex/tables.htm#annual.
10. “Selected Housing Characteristics – American
Community Survey,” United States Census
data, 2019, https://data.census.gov/cedsci/
table?q=us%20housing&tid=ACSDP1Y2019.
DP04&hidePreview=false.
11. “Housing Affordability in the U.S.,” Esri
Demographics, accessed January 22, 2021, https://
www.arcgis.com/apps/Cascade/index.html?a
ppid=1419fe7ee70c4267a7258eb59a9a824c;
and The State of the Nation’s Housing 2019, Joint
Center for Housing Studies of Harvard University,
2019, https://www.jchs.harvard.edu/sites/default/
files/reports/files/Harvard_JCHS_State_of_the_
Nations_Housing_2019%20%281%29.pdf.
12. “HUD’s New Rental Affordability Index,” PD&R
Edge, accessed January 25, 2021, https://
www.huduser.gov/portal/pdredge/pdr-edge-
trending-110716.html.
www.rmi.org
/
57Build Back Better Homes
13. David Stiff, “Land Values Drive Home Price
Volatility,” CoreLogic Insights Blog, September 20,
2016, https://www.corelogic.com/blog/2016/09/
land-values-drive-home-price-volatility.aspx;
and Brad Hunter, “Skyrocketing Land Costs
Have Driven the Runup in Home Prices,” Forbes,
June 28, 2019, https://www.forbes.com/
sites/bradhunter/2019/06/28/skyrocketing-
land-costs-have-driven-the-runup-in-home-
prices/?sh=6e9429063631.
14. “U.S. Billion-Dollar Weather and Climate
Disasters: Overview,” NOAA National Centers for
Environmental Information (NCEI), 2021, https://
www.ncdc.noaa.gov/billions/.
15. Christopher Flavelle, “U.S. Disaster Costs Doubled
in 2020, Reflecting Costs of Climate Change,”
New York Times, January 7, 2021, https://www.
nytimes.com/2021/01/07/climate/2020-
disaster-costs.html.
16. “How Climate Change Is Changing Your Insurance,”
PBS News Hour, November 27, 2018, https://www.
pbs.org/newshour/economy/making-sense/how-
climate-change-is-changing-your-insurance.
17. Coral Davenport and Jeanna Smialek, “Federal
Report Warns of Financial Havoc from Climate
Change,” New York Times, September 8, 2020,
https://www.nytimes.com/2020/09/08/climate/
climate-change-financial-markets.html.
18. Mitigation Saves: Mitigation Saves up to $13 per $1
Investment, National Institute of Building Sciences,
2020, https://cdn.ymaws.com/www.nibs.org/
resource/resmgr/reports/mitigation_saves_2019/
mitigationsaves2019_complete.pdf.
19. Ariel Drehobl, Lauren Ross, and Roxana Ayala,
How High Are Household Energy Burdens? An
Assessment of National and Metropolitan Energy
Burden across the United States, American
Council for an Energy-Efficient Economy (ACEEE),
September 2020, https://www.aceee.org/sites/
default/files/pdfs/u2006.pdf.
20. “One in Three U.S. Households Faces a Challenge
in Meeting Energy Needs,” US Energy Information
Administration, September 19, 2018, https://www.
eia.gov/todayinenergy/detail.php?id=37072.
21. Drehobl et al., How High Are Household Energy
Burdens?, ACEEE, 2020.
22. “’The Color of Law’ Details How U.S. Housing
Policies Created Segregation,” NPR’s All Things
Considered, May 17, 2017, https://www.npr.
org/2017/05/17/528822128/the-color-of-
law-details-how-u-s-housing-policies-created-
segregation.
23. Brian Thompson, “The Racial Wealth Gap:
Addressing America’s Most Pressing Epidemic,”
Forbes, February 18, 2018, https://www.forbes.
com/sites/brianthompson1/2018/02/18/the-
racial-wealth-gap-addressing-americas-most-
pressing-epidemic/#5e0fa3a07a48.
24. Danyelle Solomon, Connor Maxwell, and Abril
Castro, “Systemic Inequality: Displacement,
Exclusion, and Segregation,” Center for
American Progress, August 7, 2019, https://
www.americanprogress.org/issues/race/
reports/2019/08/07/472617/systemic-
inequality-displacement-exclusion-segregation/.
25. Drehobl et al., How High Are Household Energy
Burdens?, ACEEE, 2020.
26. Brady Seals and Andee Krasner, Health Effects
from Gas Stove Pollution, RMI, Physicians for
Social Responsibility, Mothers Out Front, and
Sierra Club, 2020, https://rmi.org/insight/gas-
stoves-pollution-health/.
27. “Special Report: Global Warming of 1.5°C: Summary
for Policymakers,” The Intergovernmental Panel on
Climate Change (IPCC), 2018, https://www.ipcc.ch/
sr15/chapter/spm/.
www.rmi.org
/
58Build Back Better Homes
28. Benjamin Goldstein, Dimitrios Gounaridis, and
Joshua P. Newell, “The Carbon Footprint of
Household Energy Use in the United States,”
Proceedings of the National Academy of
Sciences, August 2020, https://www.pnas.org/
content/117/32/19122.
29. “Housing Finance at a Glance: A Monthly
Chartbook (December 2020),” Urban Institute
Housing Finance Policy Center, December
2020, https://www.urban.org/sites/
default/files/publication/103430/housing-
finance-at-a-glance-a-monthly-chartbook-
december-2020_0_0.pdf.
30. “Mortgage Statistics: Historical & Current
United States Residential Mortgage Origination
& Loan Servicing Statistics for 2021,” Mortgage
Calculator, accessed February 4, 2021, https://
www.mortgagecalculator.org/helpful-advice/
mortgage-statistics.php; and Mortgage Bankers
Association (MBA).
31. Ibid.
32. Improving America’s Housing 2019, Joint Center
for Housing Studies of Harvard University, 2019,
https://www.jchs.harvard.edu/sites/default/
files/reports/files/Harvard_JCHS_Improving_
Americas_Housing_2019.pdf.
33. “The Housing Satisfaction Gap: What People Want,
but Don’t Have,” Demand Institute, 2014, https://
climateaccess.org/system/files/top-10-housing-
desires.pdf.
34. “2020 REALTORS® Sustainability Report,”
National Association of REALTORS, April 30,
2020, https://www.nar.realtor/sites/default/files/
documents/2020-sustainability-04-30-2020.pdf.
35. “Why Energy Efficiency Upgrades,” US
Department of Energy Office of Energy Efficiency
& Renewable Energy, accessed January 16, 2021,
https://www.energy.gov/eere/why-energy-
efficiency-upgrades.
36. Home Energy Efficiency and Mortgage Risks,
Institute for Market Transformation and UNC Center
for Community Capital, March 2013, https://www.
imt.org/wp-content/uploads/2018/02/IMT_UNC_
HomeEEMortgageRisksfinal.pdf.
37. Robert Argento, Xian Fang Bak, and Lariece
M. Brown, Energy Efficiency: Value Added to
Properties & Loan Performance, Freddie Mac
Single-Family, 2019, https://sf.freddiemac.com/
content/_assets/resources/pdf/fact-sheet/
energy_efficiency_white_paper.pdf.
38. Martin J. Brown and Taylor Watkins, The
“Green Premium” for Environmentally Certified
Homes: A Meta-Analysis and Exploration, 2016,
http://martinjohnbrown.net/wp-content/
uploads/2016/02/green-premium-metaanalysis-
2015-10-24-for-researchgate.pdf.
39. S. MacAskill et al., “Is There a Green Premium in
the Green Bond Market?” 2021.
40. “Basics of Fannie Mae Single-Family MBS,” Fannie
Mae, February 2021, https://www.fanniemae.com/
media/17751/display.
41. “Multifamily Green MBS,” Fannie Mae, accessed
February 10, 2021, https://capitalmarkets.
fanniemae.com/sustainable-bonds/green-bonds/
multifamily-green-mbs.
www.rmi.org
/
59Build Back Better Homes
42. Aleksandrs Rozens, “Fannie Mae Multifamily
Closes 2017 with Record Volume of More than $67
Billion,” Fannie Mae, January 25, 2018, https://
www.fanniemae.com/newsroom/fannie-mae-
news/fannie-mae-multifamily-closes-2017-
record-volume-more-67-billion; Aleksandrs
Rozens, “Fannie Mae Multifamily Closes 2018
with Volume of More than $65 Billion,” Fannie
Mae, January 24, 2019, https://www.fanniemae.
com/newsroom/fannie-mae-news/fannie-mae-
multifamily-closes-2018-volume-more-65-billion;
Aleksandrs Rozens, “Fannie Mae Multifamily
Closes 2019 with Record Volume of More than $70
Billion,” Fannie Mae, January 16, 2020, https://
www.fanniemae.com/newsroom/fannie-mae-
news/fannie-mae-multifamily-closes-2019-
record-volume-more-70-billion; and “Fannie Mae
Multifamily Closes 2020 with Record Volume of
More than $76 Billion,” Fannie Mae, January 14,
2021, https://www.fanniemae.com/newsroom/
fannie-mae-news/fannie-mae-multifamily-closes-
2020-record-volume-76-billion.
43. “Weatherization Works!”, US Department of
Energy Office of Energy Efficiency & Renewable
Energy, 2019, https://www.energy.gov/sites/prod/
files/2019/07/f64/WAP-Fact-Sheet-2019.pdf.
44. “Uniform Loan Delivery Dataset: Improving Loan
Delivery Consistency,” Fannie Mae, Accessed
February 2, 2021, https://singlefamily.fanniemae.
com/delivering/uniform-mortgage-data-program/
uniform-loan-delivery-dataset.
45. 12 CFR Part 1282, “Enterprise Duty to Serve
Underserved Markets,” Federal Housing Finance
Agency, Section 1282.34(d)(3), December 29,
2016, https://www.govinfo.gov/content/pkg/FR-
2016-12-29/pdf/2016-30284.pdf.
46. “ResStock: State Fact Sheets,” National
Renewable Energy Laboratory, accessed January
17, 2021, https://resstock.nrel.gov/factsheets/.
47. Seals and Krasner, Health Effects from Gas Stove
Pollution, 2020.
48. The Impact of Fossil Fuels in Buildings: A Fact Base,
RMI, 2019, https://rmi.org/insight/the-impact-of-
fossil-fuels-in-buildings/.
49. Michael Neal, Sarah Strochak, Linna Zhu, and
Caitlin Young, “How Automated Valuation Models
Can Disproportionately Affect Majority-Black
Neighborhoods,” Urban Institute, December
29, 2020, https://www.urban.org/research/
publication/how-automated-valuation-models-
can-disproportionately-affect-majority-black-
neighborhoods.
50. “The Biden Plan to Build a Modern, Sustainable
Infrastructure and an Equitable Clean Energy
Future,” accessed February 14, 2021, https://
joebiden.com/clean-energy/.
51. “Home Energy Labeling: Residential Energy
Disclosure Policies in States and Cities,” National
Association of State Energy Officials (NASEO),
accessed January 11, 2021, https://www.naseo.
org/issues/buildings/home-energy-labeling.
52. “Center for Climate-Aligned Finance,” accessed
February 1, 2021, https://climatealignment.org/.
53. Dr. Lindsay Owens, Soaked: A Policy Agenda to
Prepare for a Climate-Triggered Housing Crash, The
Great Democracy Initiative, July 2020, https://
greatdemocracyinitiative.org/wp-content/
uploads/2020/07/Climate-and-Housing-Report-
Final-Copy.pdf.
54. Lowell Ungar, “Three Steps Federal Agencies
Can Take toward a Better Climate,” American
Council for an Energy-Efficient Economy (ACEEE),
July 29, 2020, https://www.aceee.org/blog-
post/2020/07/three-steps-federal-agencies-can-
take-toward-better-climate.
55. Brown and Watkins, The "Green Premium" for
Environmentally Certified Homes, 2016.
www.rmi.org
/
60Build Back Better Homes
56. “Green Building Certifications (Multifamily),”
Fannie Mae, accessed February 12, 2021, https://
multifamily.fanniemae.com/sites/g/files/
koqyhd161/files/2019-12/4250.pdf.
57. Rachel Cluett, Marshall Duer-Balkind, James
Perakis, James Tosh, and Molly Simpson, Driving
Market Transformation: Ranking and Rewarding
Certifications for Energy-Efficient and Healthy
Multifamily Buildings, Fannie Mae, September
2020, https://multifamily.fanniemae.com/
media/14001/display.
58. Danny Parker, Evan Mills, Leo Rainer, Norm
Bourassa, and Greg Homan, Accuracy of the Home
Energy Saver Energy Calculation Methodology,
Lawrence Berkeley National Laboratory, 2012,
http://hes-documentation.lbl.gov/accuracy;
and Emelie Cuppernell, Existing Home Energy
Rating and Disclosure Laws, Programs and Best
Practices, New York State Energy Research and
Development Authority (NYSERDA), September
2015, http://www.ulysses.ny.us/pdf/Attachment-
2.-Report-on-Existing-Home-Energy-Rating-and-
Disclosure-Programs.pdf.
59. Selling Guide, Fannie Mae Single Family, February
3, 2021, https://singlefamily.fanniemae.com/
media/25071/display; and Seller/Servicer Guide,
Freddie Mac Single-Family, February 10, 2021,
https://guide.freddiemac.com/ci/okcsFattach/
get/1002095_2.
60. “Duty to Serve Program,” Federal Housing Finance
Agency, accessed January 9, 2021, https://www.
fhfa.gov/PolicyProgramsResearch/Programs/
Pages/Duty-to-Serve.aspx.

Rita Ballesteros, David Heslam, and Greg Hopkins, Build Back Better Homes: How to Unlock
America’s Single-Family Green Mortgage Market, RMI, 2021,
http://www.rmi.org/insight/build-back-better-homes.
RMI values collaboration and aims to accelerate the energy transition through sharing
knowledge and insights. We therefore allow interested parties to reference, share, and cite
our work through the Creative Commons CC BY-SA 4.0 license.
https://creativecommons.org/licenses/by-sa/4.0/.
All images used are from iStock.com unless otherwise noted.
RMI Innovation Center
22830 Two Rivers Road
Basalt, CO 81621
www.rmi.org
© March 2021 RMI. All rights reserved.
Rocky Mountain Institute® and RMI®
are registered trademarks.
